Crypto Academy Week 14 - Homework Post for @kouba01
Hello every steemian welcome to my homework post given by @kouba01 who talked about how to identify signals for a good trade and obviously he gave home work so without waisting your time lets get this started.
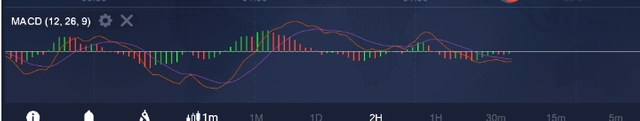
The Moving Average Convergence Divergence also known as MACD can be define as an indicator that that calculates the difference between exponential moving averages to give signals. It contain of 3 different components.
Histogram is known as a bar ploy that shows the difference between the the MACD line and the signal line. The plot we are talking about is the red and green line in histogram The plots are green and above the zero line when the MACD line is above the Signal line and red when the Signal line is above the MACD line. At the point of intersection of the MACD and Signal line the histogram is at a 0.
What is known as the signal line is which is calculated by something known as the 9 period EMA of the MACD line. It being the average of the last 9 period of the MACD line, you can say that it is a more smoother MACD line. It is slower also.
Also known MACD line which is the difference between a 12 EMA period and a 26 EMA period.
Why MACD is good for trading Cryptocurrency
Predictions can not always be very correct like 100% because is a tool for prediction of signals to buy and sell in the cryptocurrency market. It also calculate data so it's prediction can be wrong but is it a gold indicator for trading i will say yes because indicators should be used with other tools to be sure on the correct signal but from what i know one indicator is not enough to make a decision, also other analysis like fundamental should be considered to confirm how true a signal is since indicators are based on calculations.
MACD or RSI
I noticed that MACD is the best because it is made by the joining of many indicators (signal line, MACD line and histogram which aid an investor in making a more strong judgment in his day to day crypto trading.
Adding MACD Indicator to the Chart
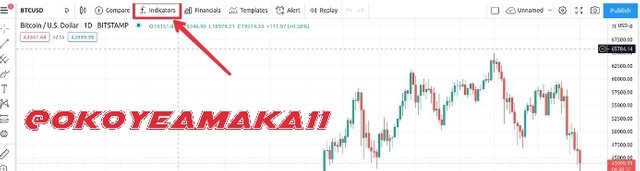
The first step to add MACD indicator is by selecting fx indicators.
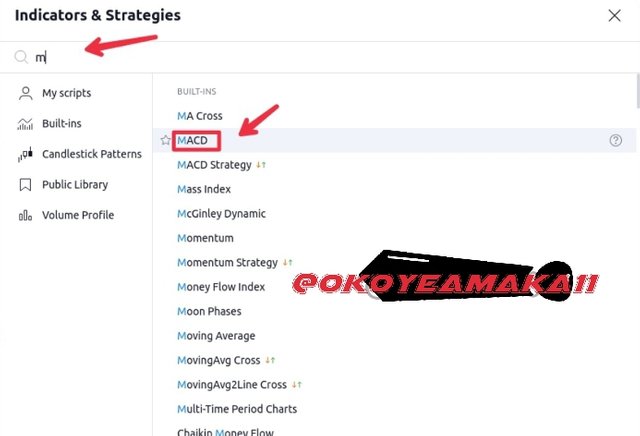
Second step is to search MACD, select MACD from the results.
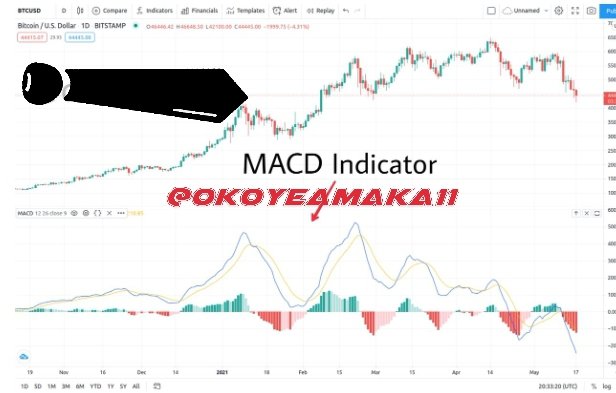
The MACD indicator is now added to the chart.
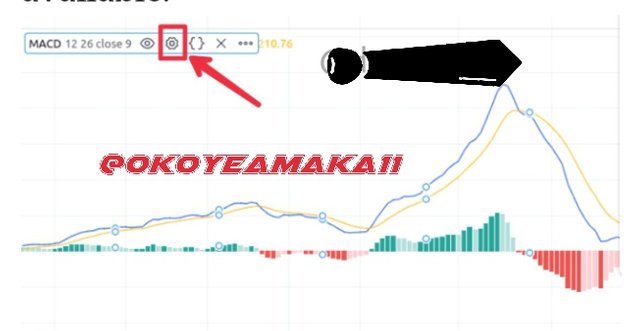
Settings For MACD
To enter the settings of the MACD, move to the top left of the indicator were you see MACD click it and An horizontal bar would extend. Select the settings icon. Upon selection a box would open showing you the settings available.
Explain how to use MACD with crossing MACD line and signal line? And How to use the MACD with the crossing of the zero line?
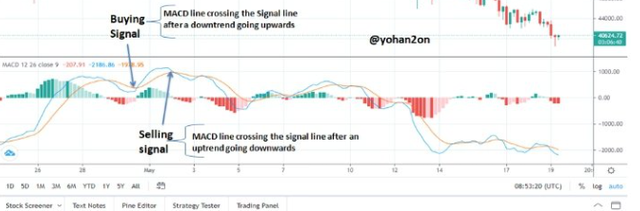
In the scenario when MACD crosses the single line from a uptrend to the downtrend, this tells a trader that to is time to sell. On the other hand, when the MACD line crosses the Flag line from a continuing uptrend, this means to us a sellout
When MACD line crosses the Zero line
This occurs when the MACD is crossing the 0 line which means sell signal , On another hand, when the MACD line crosses the zero line proceeding upwards, it signifies buying a signal.
How to Detecting False Signals
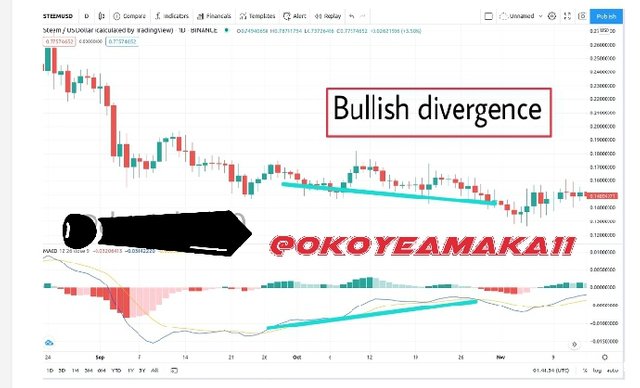
From the Chart that i am going to provide, if you can spare time just look at them and you will notice the there are some times that the chart is showing the things it shouldn't most times it shows a similar but then change to another thing, well it is called this divergence. Divergence is when the main chart is showing something different from what the MACD indicator is showing. There are two types of divergence.
This Bullish divergence is a scenario that shows the chart showing a price downtrend but the MACD indicator is showing a uptrend meaning there going to be a bullish divergence Take a look at the chart below. You can see how actual price has declined whereas the indicator is showing an increase in price.
The Bearish Trend is when the have been uptrend and it is looking bullish in the chart the MACD indicator shows otherwise. You'd notice price is increasing but then the MACD indicator is rather showing a decrease in price.
MACD Finding Support and Resistance
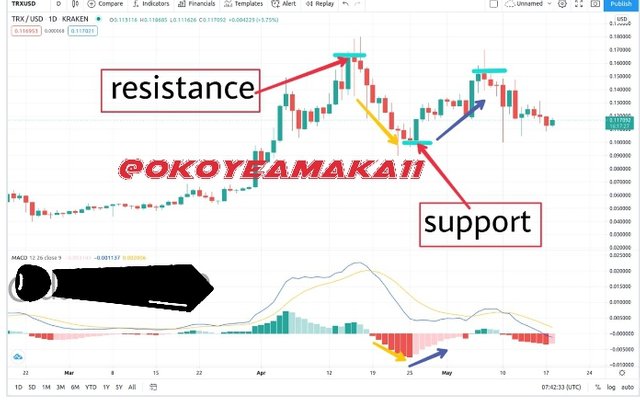
It is simple because at the peak of the histogram for instance below the zero line, it formulates a support point and at the lowest of the MACD line, the MACD forms a resistance point.
Conclusion
Thanks for reading i hope you use MACD os your future trade because it helps a lot any thanks for reading.
Cc: @kouba01
Hello @okoyeamaka11,
Thank you for participating in the 6th Week Crypto Course in its second season and for your efforts to complete the suggested tasks, you deserve a 3/10 rating, according to the following scale:
My review :
An article with sub-standard content, your thoughts are scattered, not rising to form an integrated paragraph, the lack of analysis in the answers and also you did not make the last question.
Thanks again for your effort, and we look forward to reading your next work.
Sincerely,@kouba01