Strategy and use of Donchian Channels - Crypto Academy / S5W1 - Homework post for @ lenonmc21

Image self created on Canva
Explain and define in your own words what the Donchian Channels are?
The Donchian Channel was created in 1950 by Richard Donchian as an indication tool to understand and visualize the market trend. The Donchian Channel consists of three band lines that proceeds along side one another and a formulated channel. These band lines include an Upper band line, a Lower band line and a Mid-Range line which is created to be centrally positioned in between the upper and the lower band lines. In between the upper and lower band is a shaded area which looks like a river channel. This shaded area forms the channel where the Donchian Channel idealize it name from and this definitely differentiate it from a similar Indicator such as Bollinger Band.
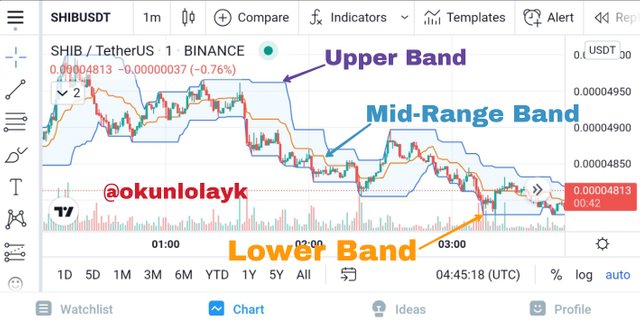
Traders use the the Donchian Channel to Identify market trends and obtain information necessary for decision making in their trades.
Do explain in detail how Donchian Channels are calculated (without copying and pasting from the internet)?
As stated earlier, the Donchian Channel is made up of three lines; the Upper Band line, the Mid-Range line and the Lower band.
The upper band of the Donchian Channel indicates the highest price reached over a number of periods while the lower band indicate the lowest price reached over the same number of periods. The period represents the interval at which the chart is being visualized. For example the period could be minutes, hours, days or months as indicated by the trader.
The algorithm of the Donchian Channel indicator compares the highs that has been achieved over a number of periods and Identify the highest to create the upper band. The lower as well is created with a similar pattern by comparing the low prices attained and indicating the lowest across the given periods. The number of periods can be adjusted just as the period itself can be adjusted to suit the trader's preference. The Mid-Range is created as an average of the highest high and the lowest low over the number of periods.
Let's take for example, we have chosen our period to be an hour (1h) which means the candlesticks on our chart is hourly based. We indicate the number of periods to be used as 20 (as default). However, the Donchian Channel algorithm will compare the market price per hour over the last 20 hours (20 candlesticks) and then plot the highest price attained as the Upper Band. To calculate the Lower Band the Donchian Channel algorithm compares the low prices in the market over the last twenty hours and plot the lowest price attained as the Low Band. The Mid-Range band is created by subtracting the lowest price from the highest price and then divide by 2.
Explain the different types of uses and interpretations of Donchian Channels (With examples of bullish and bearish trades)?
The Donchian Channel can be used to identify and interpret the following in the market.
Volatility:
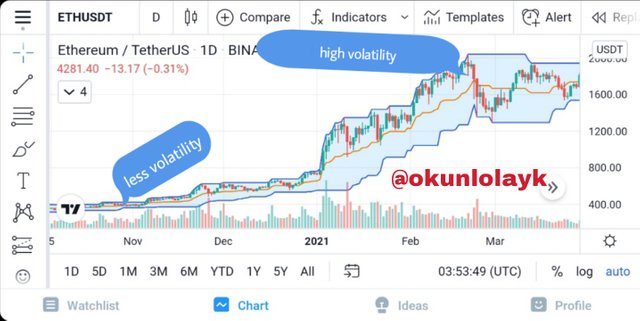
The Donchian Channel indicator all helps to easily visualize the extent of volatility in the market both during a Trend or a Range. The extent to which price rise and fall with time can be observed on this channel. This can be seen as the extent of the space in between the bands. A more stable market with less volatility would have a narrow channel while a highly volatile market would have a wider channel.
Here is an example of Identification of volatility in the market
Overbought and Oversold
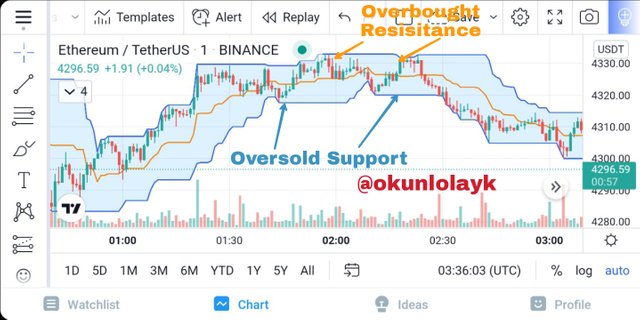
The highest price limit reached can also be considered as an Overbought signal while the Lowest price limit reached can be considered as an oversold signal. These can also be seen as a support floor or resistance ceiling for a particular trend or range. For example, the lower band could serve as a support where price is expected to bounce off while the higher band can be considered as a resistance where market price should bounce of and retrace the trend.
Strong Trend and Key Zone Breakout
The Donchian Channel can be used to identify the strength of a trend. This is where traders look out for breakout of the upper and lower band. It is definitely possible that the price will not bounce off the band as earlier indicated as an Overbought or oversold but in the case of a strong uptrend or downtrend, there is a breakout and the price stick around upper or lower band. In this case, the trader would necessarily not wait for a reversal on hitting the band but at the same use it to understand the trend and take new entries.
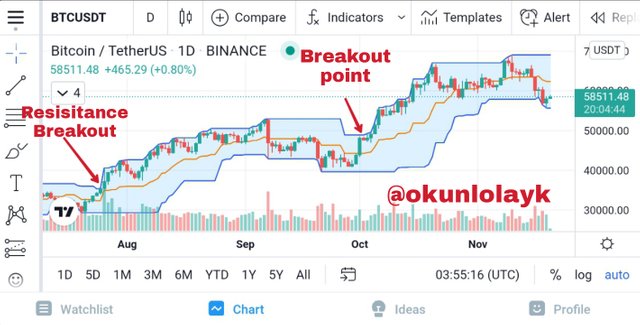
Breakout Along Upper band in an Uptrend
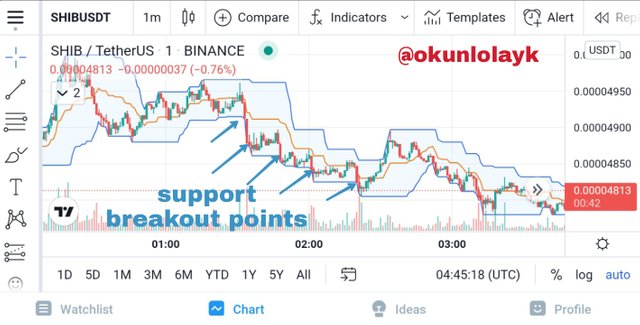
Breakout Along Lower band in a DownTrend
Donchian Channel Breakout Strategy
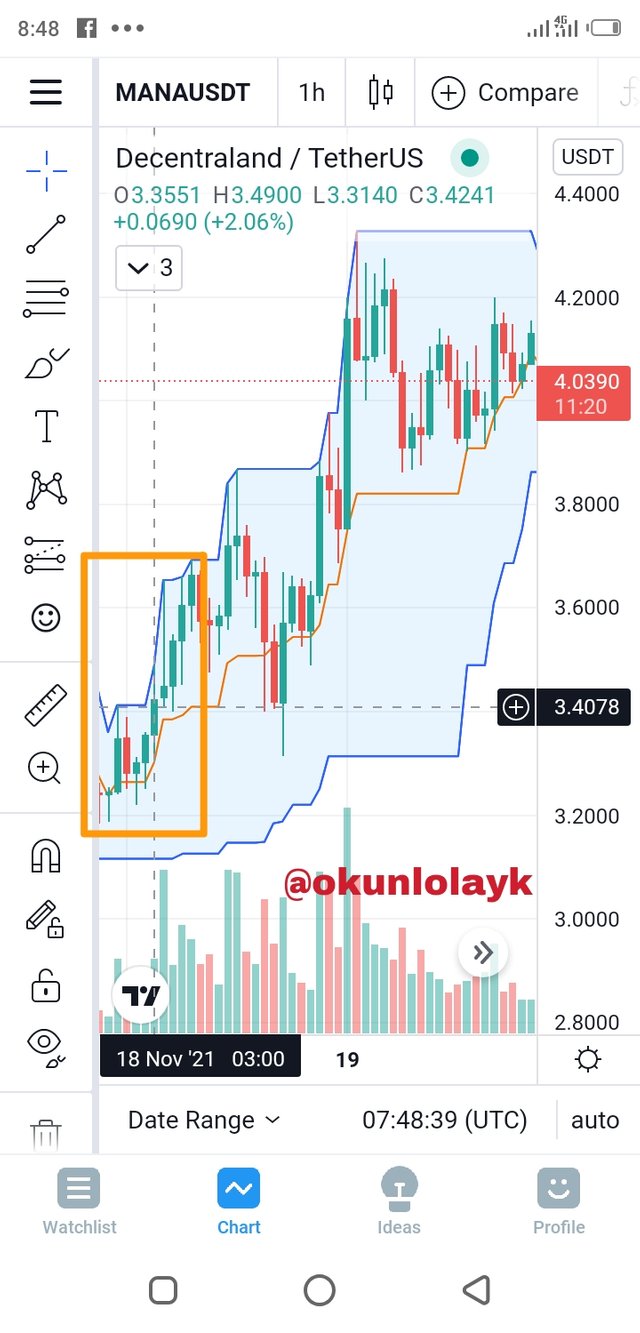
The breakout strategy or rupture strategy is used when the market choose to flow along a particular trend. This is Identified when the price hit the upper or lower band and then breakout instead of bouncing away. This strategy would presume that the price would subsequently adhere to the band in question.
Here is an example of a breakout strategy with a MANA/USDT chart. The market price breaks out of the upper band at a price of 3.4078 USDT which I presume there would be a subsequent Uptrend follow up in later sticks to create a temporary adherence to the Upper Band.
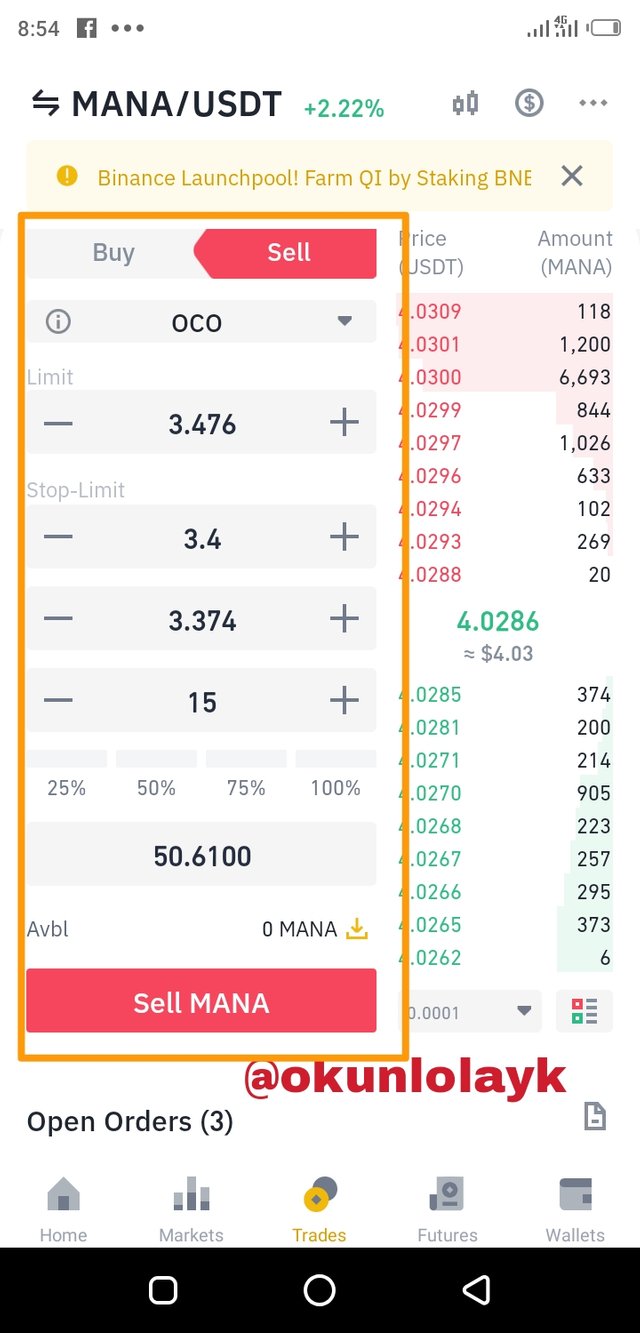
I would enter at this level buying at the market price and then place an OCO (one cancel the other) sell order with a limit price of 3.476 (a 2% increase) with a stop loss at 3.374 (a 1% loss risk).
Reversal and Retracement Strategy
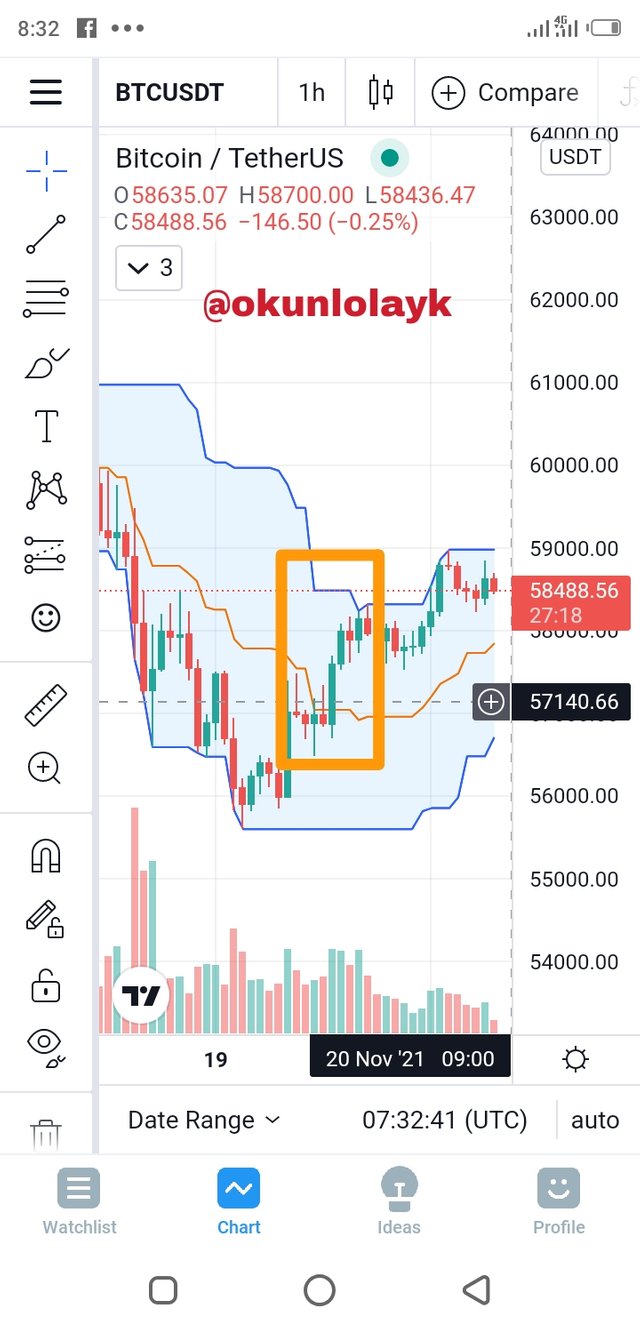
This is a strategy that is employed to take advantage of minute Volatility in the market. Using this strategy ruled out the fact that one has to wait till the price hit support or resistance. The Mid-Range band is used as a temporary support anticipating a pullback after a break off the Mid-Range band towards the lower band or a continuation towards the upper band. Using this strategy would require using a stop loss which would help reduce the amount loss if the projection goes wrong.
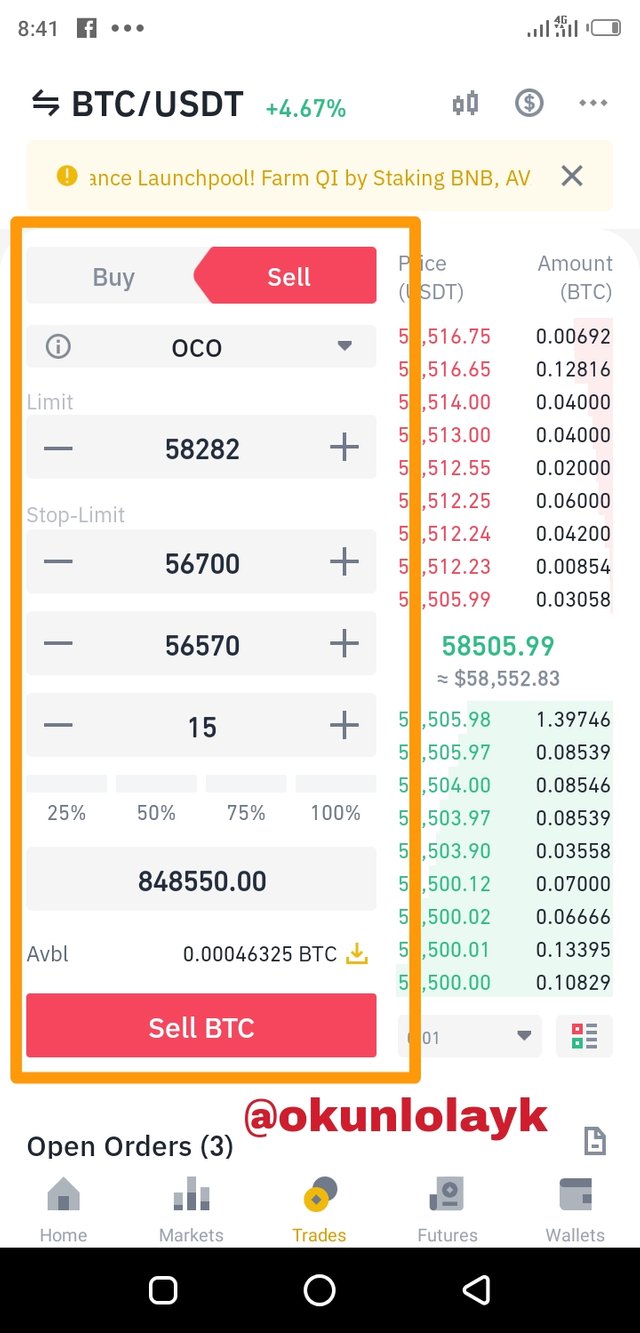
Here is an example of a reversal/retracement strategy with the BTC/USDT chart. The market price has just crossed the Mid-Range line from the Lower band to reposition towards the Upper Band. There is a probability that the price would reach directly for the Upper Band or pull back towards the Mid-Range line. However, I made an entry at the immediate crossing of the midline at 57,140.66 USDT and then open an OCO sell order to pick profit at 58,282 (2% pick profit) and stop loss at 56,570 (1% loss risk).
Conclusion
Richard Donchian created the Donchian Channel to calculate the market behavior over a period of time. however, this indicator has been widely accepted among quite number of traders and a number of strategies has been developed around it. Being a line structured indicator enables traders to easily identify limits such as support and resistance level and when there is a breakout. The Mid-Range line which is similar to moving average creates a demarcation into two regions; the upper and lower region. Transition along or out of a region is significant to trade decision making.
Image Disclaimer:
Unless otherwise stated, all images used in this post are self generated screenshots by me @okunlolayk from TradingView or Binance
Cc: @lenonmc21
Best Regards!!
