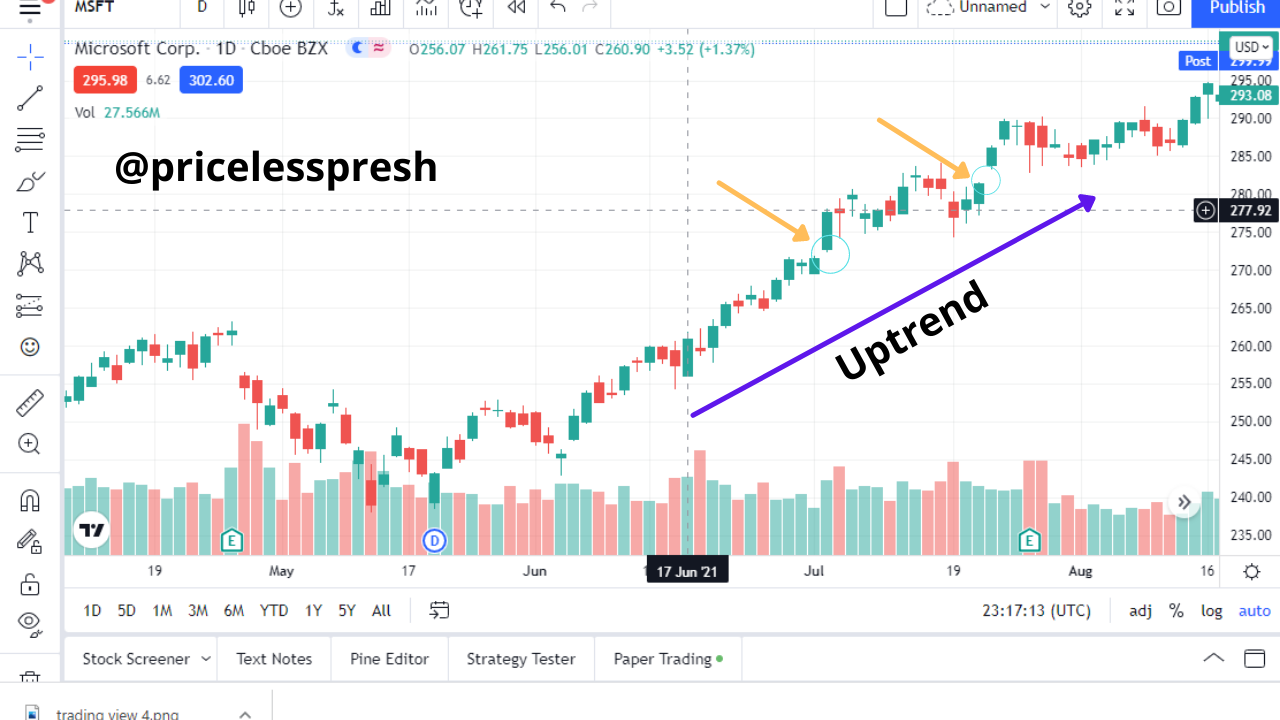
Crypto Academy / Season 4 / Week 1 - Homework Post for For professor @allbert || Topic: Trading with Strong, Weak, Gap.


1- Graphically, explain the difference between Weak and Strong Levels. (Screenshots required) Explain what happens in the market for these differences to occur.
Strong Level
A strong level is a price level where the price of an asset touches and repels or changes direction, multiple times. These levels literally act as support or resistance points during the movements of the price of an asset. The best way to detect a strong level is by drawing a line that cuts across different price levels and then watching out to see if the line made the price of an asset bounce or repel from it severally. A strong level that acts as a support level can turn out to be a resistance level, likewise, a strong level that acts as a resistance level can turn out to be a support level. It is a very reliable level that traders can depend on for making trading decisions.
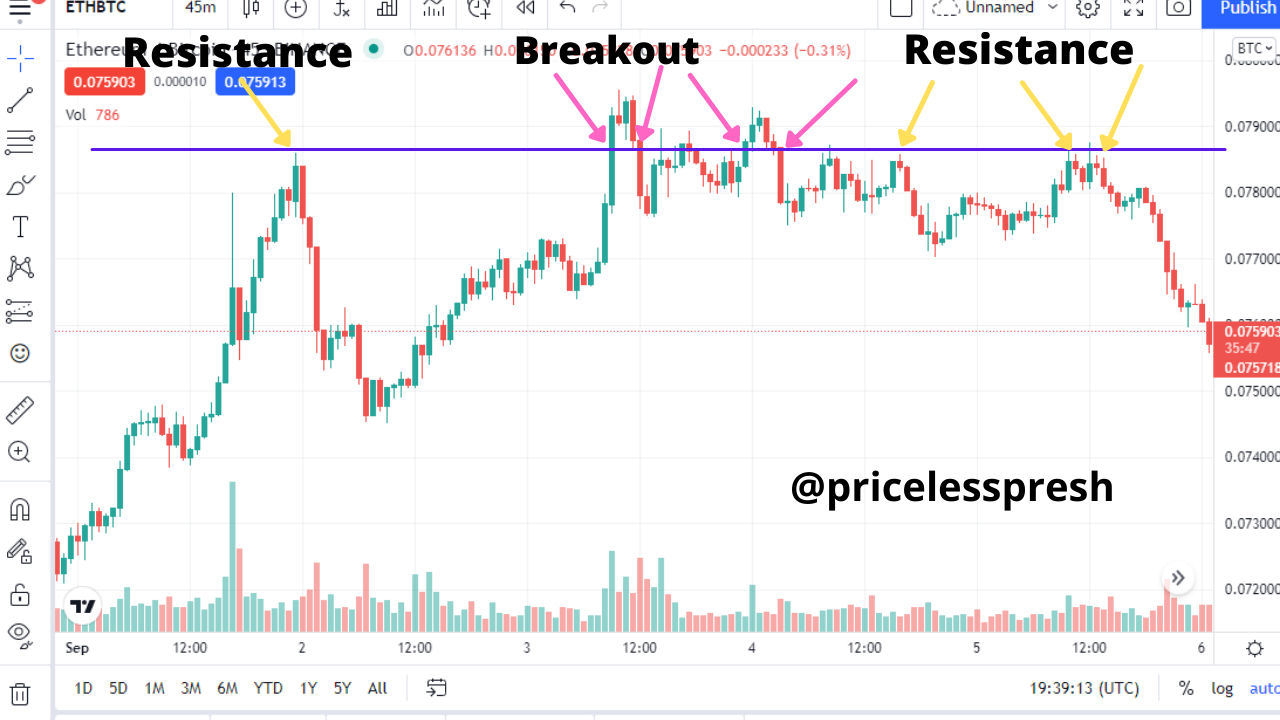
From the graph above it can be seen that the level was hit several times and it had a repelling effect as the price went back in the opposite direction. There were also breakouts but they weren't significant as the breakouts kept hovering around the strong level. The yellow arrows represent the strong level acting as resistance and the purple lines represent the breakouts.
Most times it is recognized that traders have placed pending orders on the market to execute buy or sell orders at a strong level. And when this happens liquidity is provided to the market. So when the price of the asset reaches these levels, the orders are then executed. And as this happens a lot of money enters into the market and moves thereby bringing about much liquidity and as a result modifying the movement of the price.
Weak Level
A weak level is one where there are minimal touches of an asset's price on a certain price level. It is also a support and resistance level. It is not a reliable level.
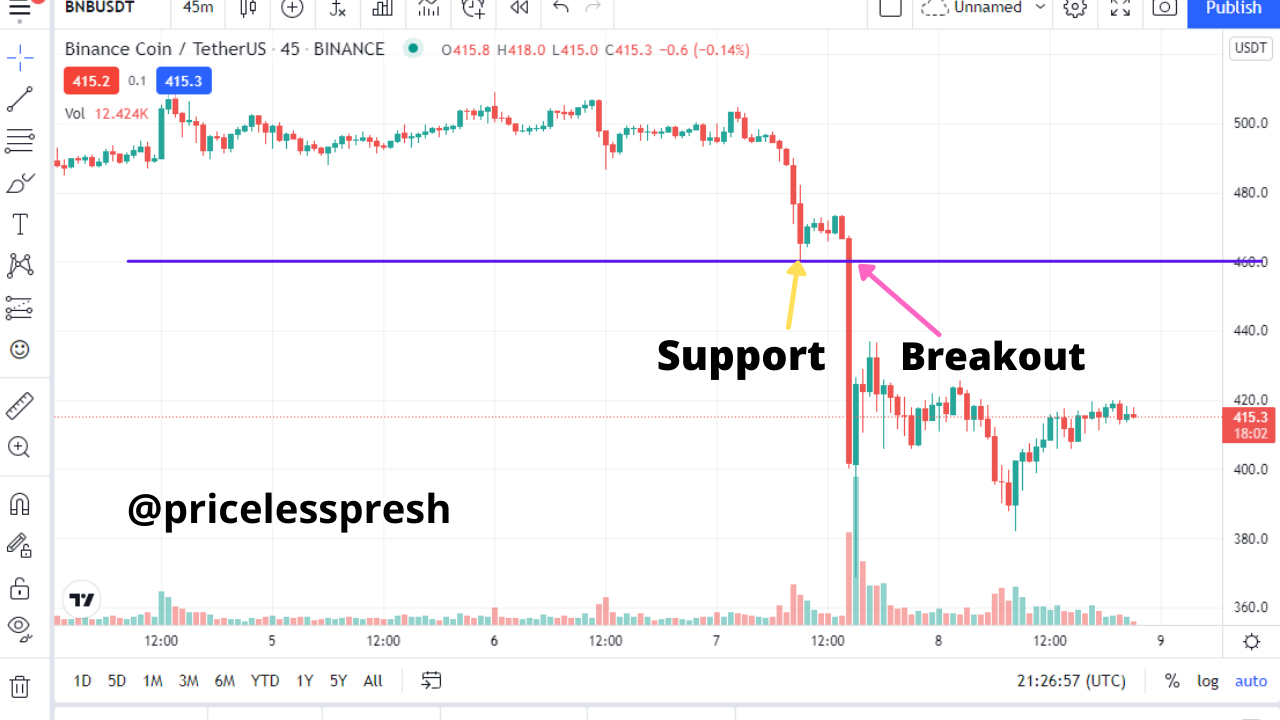
On a chart, it can be seen that the price of the asset bounced once. The level where the bounce occurred acted as a support level. After that, the market moved up very little then broke out from the support zone.
From the market point of view, this is a level where pending orders are being made, but the amount of money involved is much smaller than at the strong level. So when the price of the asset hit the weak level, the liquidity that came from the market was small enough to make the price react, but it was too small that the price had to quickly get exhausted. The price then passed through this level again without any pending order in place. So the level was simply broken as support.
When there are pending buy orders, then the level line acts as support, and when there are pending sell orders the level acts as resistance. The strength of the level that makes it act as a support level or a resistance level would depend on the amount of buy and sell orders and the volume of orders in the market.
2-Explain what a Gap is. (Required Screenshots) What happens in the market to cause It.
A Gap is the space in a chart that shows when an asset's price moves up or down in a quick manner, with less or no trading involved. This is represented in the asset's chart that there is a gap in the asset's price movement. It skips certain levels and puts itself on top of others without following the movement of the others.
A gap can occur because of the Initial Exuberance displayed by traders, in that there is a sharp movement (spike) in an asset's price due to some fundamental news. They occur unexpectedly because there is a sudden change in the perceived value of the asset. For instance, a crypto company can have a much-needed improvement in its service which the market hears of. The price of the crypto asset can gap up the next day. Gaps can also occur due to technical factors.
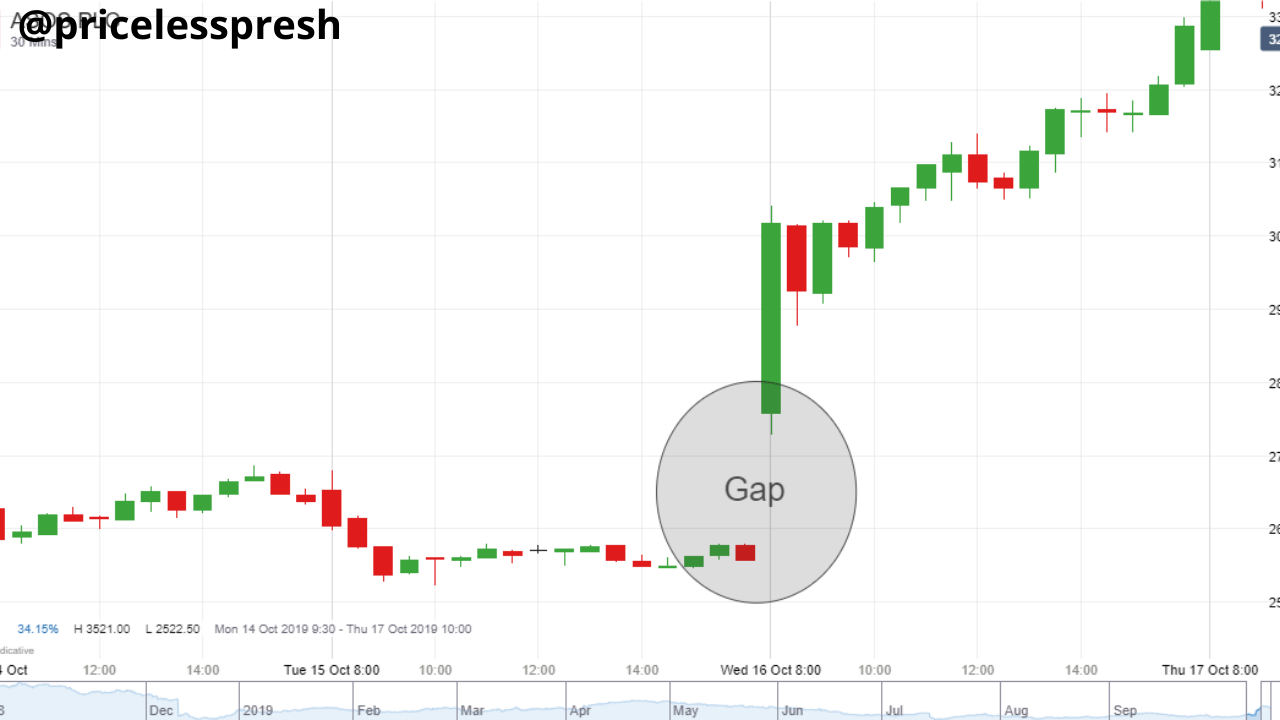
Graphically, it is shown when there is a big space between the closing price of a previous candle and the candle's opening price that gapped. In the market, these gaps are formed when there is a sudden rush in the movement of an asset price as a result of market entries with large volumes. Because of the sudden rush in market entry, the gap levels represent good support or resistance levels when doing a trading operation.
3- Explain the types of Gap (Screenshots required, it is not allowed to use the same images of the class).
There are typically three different types of gaps that can be found in the chart of an asset according to how they are formed. They include:
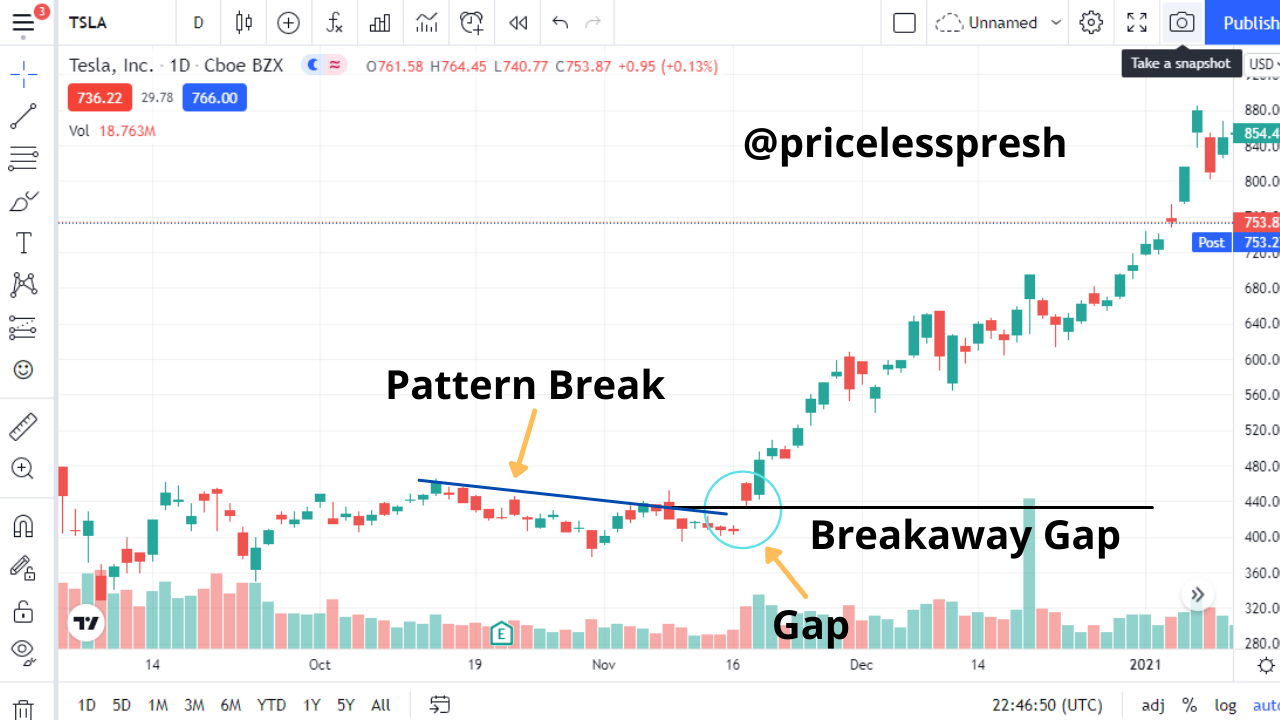
1. Breakaway Gap:
This is a gap that takes place due to a breakout in a price pattern–Lateral movement or from a previous trend. It signals the start of a price movement or trend. It also indicates that the price level can act as strong support or resistance.
2. Runaway Gap:
A gap forms when a trend just started because they show up in the middle of the price trend formation. It represents the rush of traders who share a common belief in the future direction of the crypto asset. It can be used by traders as a trend continuation indicator. However, they are very difficult to identify because they are mostly confused with the following/succeeding ones. But when they are identified, the gap level can be seen as an important resistance or support level because they are in the middle of a new trending market.
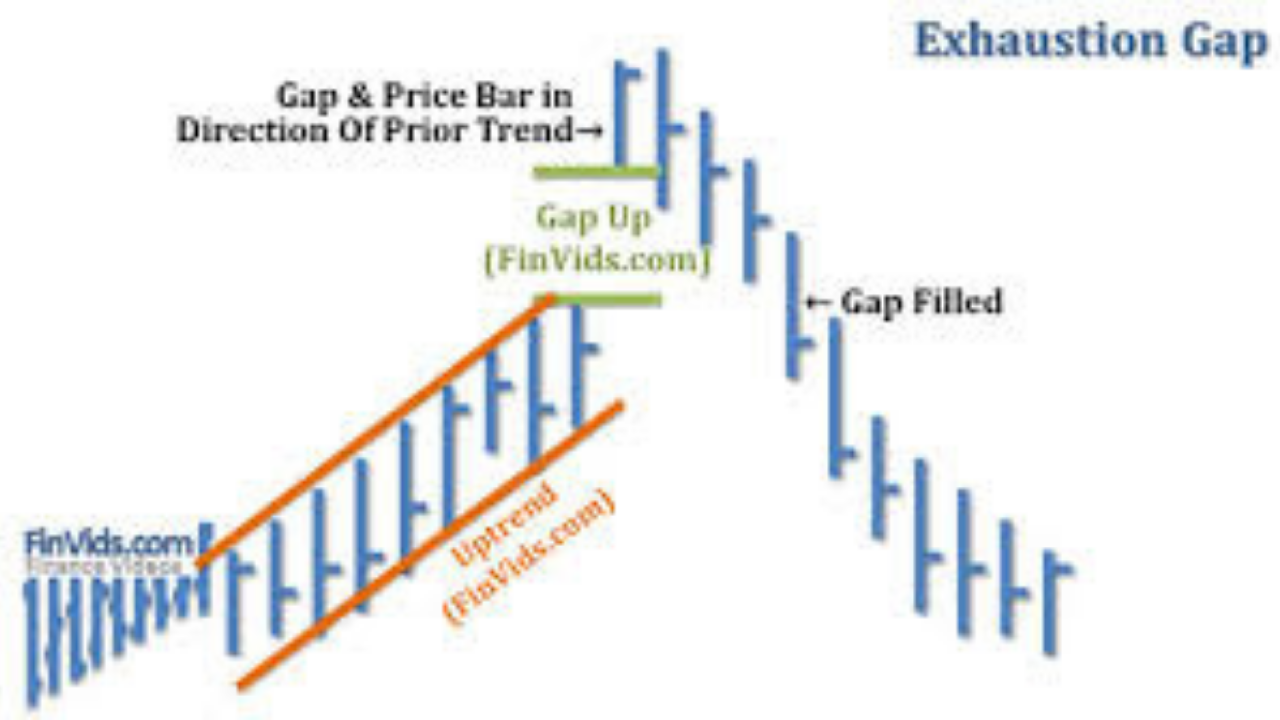
3. Exhaustion Gap:
These are gaps that show up near the end of a current trend. It indicates the last impulse of the trend. They aren't easily identified because they are usually confused with runaway gaps and can only be identified once the formation has occurred. The price level in this gap is less important because the movement of the price will naturally fill the gap. Because of this, this gap type is traded in the opposite direction, since the price is to come back and fill the price level that the gap created.
4- Through a Demo account, perform the (buy/sell) through Strong Supports and resistances. Explain the procedure (Required Screenshots).
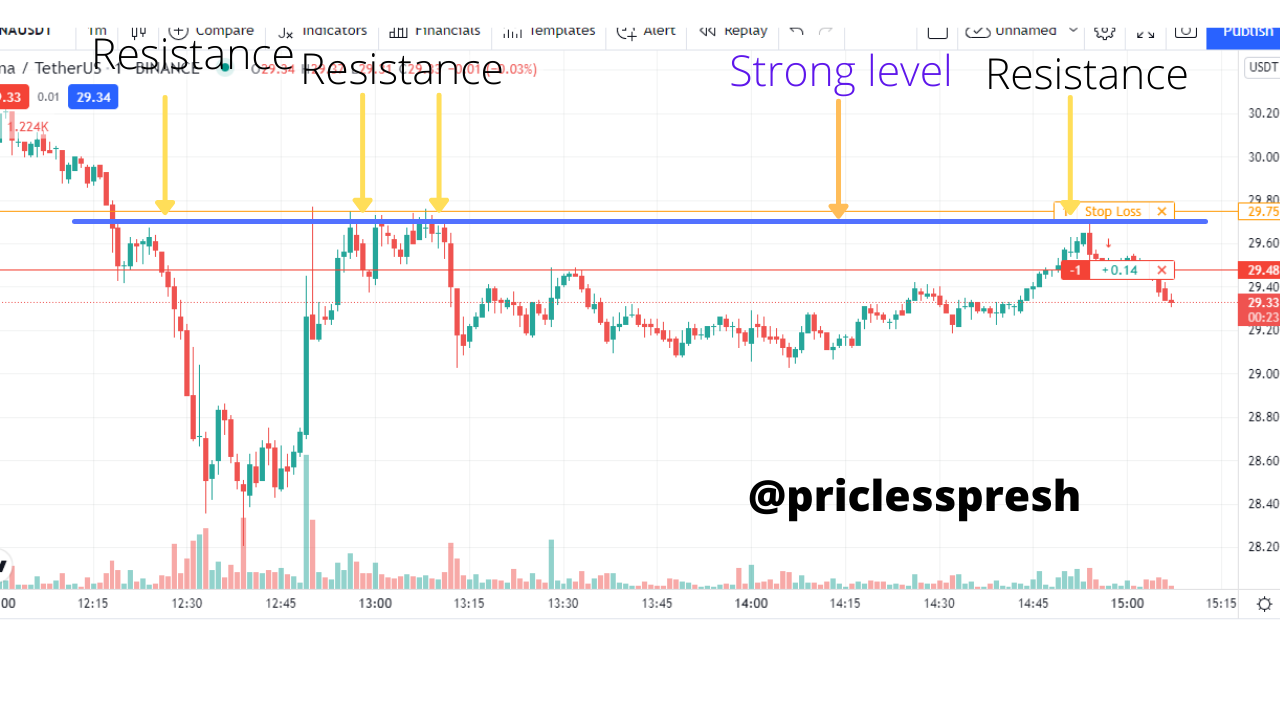
The chart above is an illustration of spotting a strong level either as a support level or as a resistance level. The strong level spotted was at $29.65. The level had been showing signs of being a strong level. On so many occasions, prices repelled when they hit the level. Most of the reactions were resistant as price tended to move back downwards when it hit the line.
So I opened a sell position at $29.49 and place my stop-loss a $29.75. The price went down to $29.33, then I decided to close the position. I made a small profit of $0.13 because the trade was finally closed at $29.36.
5- Through a Demo account, perform the (buy/sell) through Gaps levels. Explain the procedure (Required Screenshots).
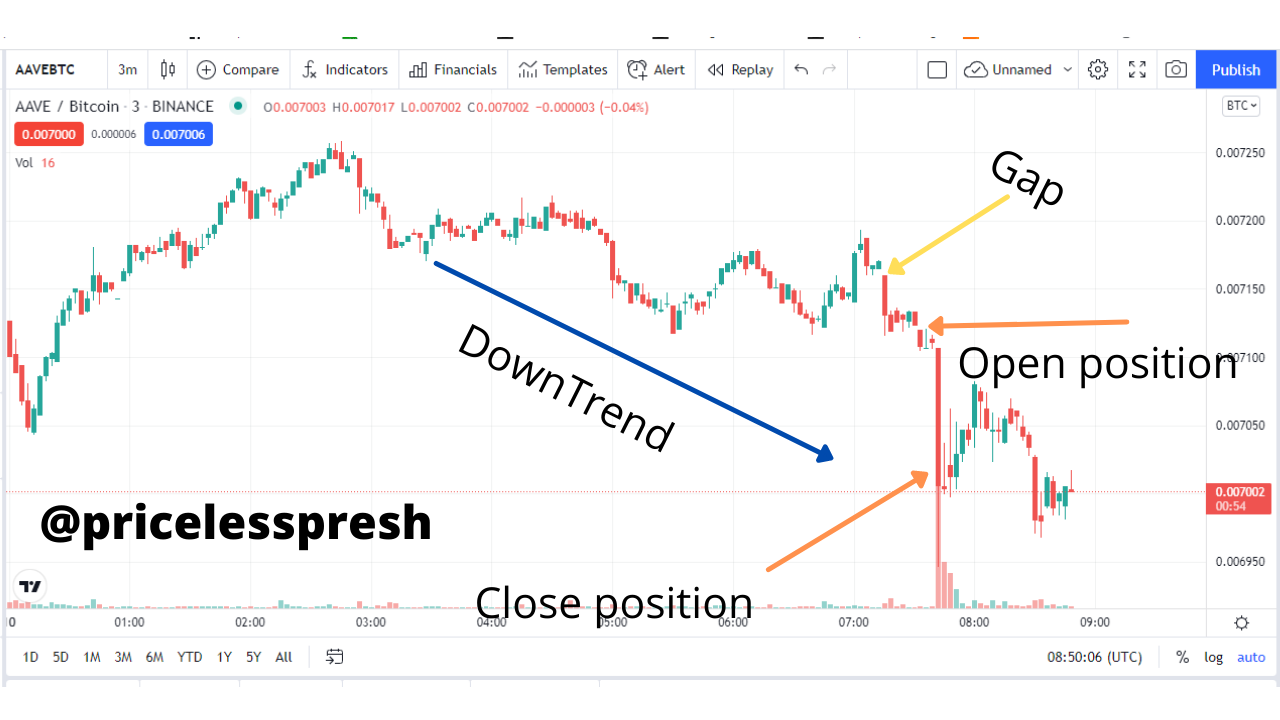
This is a chart of AAVEBTC. The market was generally in a downtrend, the price of the AAVE was going down. However, there was a weak level where the market had touched and repelled twice. At the 0.007122 BTC level, the price hit it and repelled twice in its downward movement.
After the second repulsion, the market still came back down. There was a small increase in the price as bull traders were optimistic that the price of AAVE would continue to go up, but at last, it didn't happen. Then at 0.007160 BTC, the price of AAVE gapped down.
I opened a position at 0.007119 BTC because the price had gapped down and it had broken past the weak level of 0.007122 BTC. The price to 0.007009 BTC and I closed the position there, thereby making a profit of 100 points.
CONCLUSION
In conclusion using the strong, weak and gab level allows a trader to find a good trading opportunity.
However strong level gives traders more confident because the level makes it easier to have a good entry point. And also for Gab level break away gab level is the best because before the level occur the market is moving in a particular direction and when the break away occur the break away gab level moves in an opposite direction.
The point in which the break away gab level occurs is a good for traders to make good decision.
Note: All images are from tradingview.com unless otherwise stated.
Sorry but this class has been invalidated due to the reasons given to you in your first post: You have been receiving upvotes and have gained a reputation using bid bot/vote-buying services, then you are not eligible to participate in any Tasks(Fixed+Dynamic) in Steemit Crypto Academy.
No stress 🤗