Fear and Greed Index - Crypto Academy / S4W5 - Homework Post for professor @wahyunahrul

1). Explain why emotional states can affect cryptocurrency price movements?
Cryptocurrency is a digital or virtual currency. Therefore it is not backed by any central authority especially a government of a Nation. Due to this, cryptocurrencies experience very high fluctuations in the market. This is one of the main reasons why they are highly volatile and very risky to trade.
It experiences high volatility in the market because it is humans who are in direct control over their cryptocurrency. What this means is that a person can decide to buy or sell his cryptocurrency based on the predominant traits that humans have Greed and Fear.
Since a person has the free will to buy or sell cryptocurrency in the markets, then it is only right that the law of demand and supply becomes enacted. So as more people decide to buy a certain cryptocurrency, therefore the price would go up or increase. In the same vein if more people decide to sell their cryptocurrency, then the price would go down or decrease.
2). In your personal opinion, is the Fear and Greed Index a good indicator of the market's emotional state? if not, try to give reasons and examples of other similar indicators for comparison.
Yes the Fear and Greed index is a good indicator of the market's emotional state. Because it makes use of some critical data that is fetched from the cryptocurrency market. Remember that the cryptocurrency market is made of humans who make buying and selling decisions.
These data include Market volatility, Market volume and momentum, Social media, Surveys, Coin dominance against the cryptocurrency market, and trends. Each of these data has a percentage of which they give to the Fear and Greed indicator. For example, Market volatility which indicates the change in the price of a cryptocurrency shows when the cryptocurrency market is fearful or not. It consists of 25% of the data input.
Combing the data together makes the signals given by the index to be of high accuracy. Because of this a trader or an investor can get a view of the latest emotions from the market. As it is seen that it is the human who owns these cryptocurrencies that make buying and selling decisions based on certain emotions, this is then shown through the Fear and Greed index. So if the market is down trending using the Fear and Greed index shows that the market is fearful at that time. Likewise, if the market is uptrending, the index shows that the market is greedy at the time.
Due to how the Fear and Greed indicator is used, it gives signals for trend reversals. For example, when the market is in an extreme emotional phase either Fear or Greed, then it means that we should get ready for a trend reversal. I would also like to add that the Fear and Greed index indicator is also very easy to understand and use.
However, as with all technical tools, they are not 100% efficient. This also is the case with the Fear and Greed index. It is best to use the Fear and Greed index in conjunction with another indicator to help confirm the initial signal found.
3). Give your personal opinion on what data should be added to the Fear and Greed Indicator
Most of the Technical Indicators make use of data input that is derived from past movements in the market. This is what helps the indicators to generate signals which a trader or investor can use for his trading operations.
But the Fear and Greed index uses data derived from external sources that are not related to previous price movements. That is why the signals given are different. The index just gives signals on when the market is in a greedy phase and when the market is in a fearful phase. While technical indicators generally tell us when the market was in an uptrend, downtrend, or is ranging.
The Fear and Greed index is used as an indicator and only gives traders the direction the market can go via emotions of the market. It doesn't show how the market is moving. However, if there is one indicator that should be added it should be the market's Order Book. An order book is an electronic list of buy and sell orders which have been placed by market makers. The orders being placed are limit orders.
I choose this data to be added to the list of data used on the Fear and Greed index indicator because the order book also gives a clue for when the market is about to go up or down through the volume of limit orders placed by the market makers.
Through this, it gives the Fear and Greed index indicator a clearer view of the direction the market is going. And this view is backed by a core element which is the activities currently on the market.
4). Do a technical analysis for 2 to 3 days (maybe more) using the Feer and Greed Index and the help of other indicators. Show how you made the decision to enter the cryptocurrency market and explain the results of your trade (Screenshot Required)
For this exercise, the Indicators that i used in conjunction with the Fear and Greed Index Indicator are Moving Averages and Accumulation/Distribution A/D.
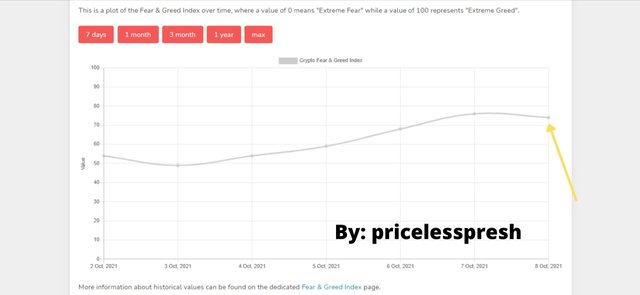
I checked on the Fear and Greed Index and found out the Index Number. The Index number is 74 which shows that the market is in the Greedy phase. This means that the market participants are buying and holding at the moment. The effect of this is that the price of Bitcoin is going to increase. I used the 7 Day period so to get a good view of the daily Fear and Greed Index.
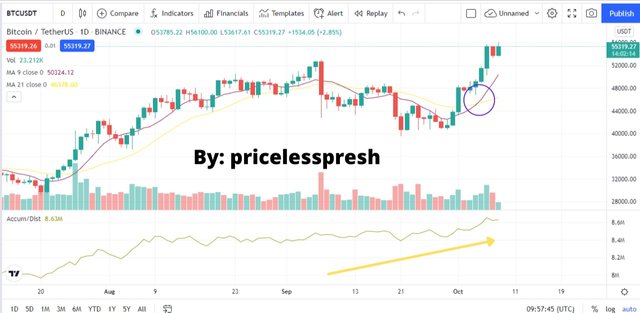
The inputs for the Moving Averages were 9 & 21. The 9 MA is the dark purple line and the 21 MA is the yellow line. The Accumulation/Distribution makes use of the figures at the panel scale at the right side of the indicator. The figures indicate the number of people who are currently buying and selling the crypto asset, which in this case is Bitcoin. In order words, it indicates the volume of the market. It shows when the market is buying and holding a crypto asset (Accumulation) or when the market is selling a crypto asset (Distribution).
Combining the Fear and Greed Index with the Moving Averages and the Accumulation/Distribution A/D indicators gave a buying outlook. There was a cross-over between the 9 & 21 Moving Average lines. The 9 which is the shorter Moving Average crossed over the 21 Moving Average which is the longer Moving Average from bottom to top thus indicating an uptrend. Then I confirmed it with the Accumulation/Distribution Indicator, the A/D indicator line was pointing upwards. The blue circle is the cross-over between the 9 MA and the 21 MA, and the yellow arrow shows the phase in which the market currently is.
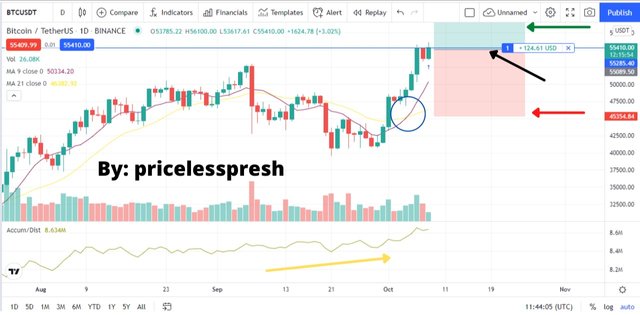
So with the cross-over of the Moving Averages, the phase of the Accumulation/Distribution Indicator through the direction, and the Fear and Greed Index number of 74, everything gave me a buy signal. So I placed a Buy Market Order after that I placed my Stop-loss at the point where the cross-over of the Moving Averages occurred, then I placed my Take Profit above. The Market Entry is indicated by the black arrow, the red arrow shows the Stop-loss level and the Green arrow shows the Take Profit level. The Take Profit level should be higher than what is on the screen.
As at the time of doing this exercise, I had made gains of +$124.81. The timeframe is daily.
5). Conclusion
The Fear and Greed Index is a very effective tool in the arsenal of trading indicators that traders need to have for their trading operations. It uses parameters such as Volume, Volatility, Social Media, Coin Dominance, and Trends.
It shows when the market is in a fearful and greedy phase at a certain period in time. When the market is fearful (Fear), then is identified on the charts as a downtrend, likewise, when the market is greedy (Greed), it is shown on the charts as an uptrend. It has Index Numbers that are used to determine when the market is in the greedy phase or in a fearful phase.
The Fear and Greed Index can also be used to determine when a trend is about to reverse, that is, Trend reversals. If the Index number shows that the emotions of the market are in an extreme phase such as extremely greedy, then it is an indication that the trend is about to change. So traders can prepare themselves so that whenever the Index gives this state, traders can ponce on the imminent reversal in trend.
Lastly, like every technical indicator, it is advisable that the Fear and Greed Index should be used in conjunction with other technical indicators to help them make better trading decisions. Using the Index alone is good, but combining it with other indicators is better.
Note:All Images are from Fear and Greed index and Tradingview, execpt cover image.
CC:@wahyunahrul