Introduction to the Principles of Crypto Analysis - Crypto Academy S4W7 - Homework Post for @imagen


1.) What are the differences between Fundamental Analysis and Technical Analysis? Which one is used most often?
| S/N | Fundamental Analysis | Technical Analysis |
|---|---|---|
| 1. | Fundamental analysis is the practice of analyzing the price of an asset to determine its intrinsic value and then comparing it to the market value to check if the asset is undervalued or overvalued. | Technical analysis is the practice of analyzing the price movement of an asset to know if it's a good time to place a market entry or not. |
| 2. | Fundamental analysis often makes use of metrics that are different from technical analysis. They include the economic reports, news, on-chain analysis, project analysis, etc. | Technical analysis makes use of a charting mechanism. The chart shows the prices actions on an asset and also has indicators that can be installed in them. |
| 3. | It is usually an activity done by Investors | It is an activity that is done by traders. |
| 4. | In fundamental analysis decisions are taken based on the information that is available and evaluated. | In technical analysis, decisions made are based on the information gotten from the chart. They can be market trends and patterns of price. |
| 5. | The type of individuals involved are usually long-term traders or investors. | The type of individuals involved in technical analysis are usually short-term traders and swing traders. |
| 6. | The data that a fundamental analyst focuses on is both the past and current price data. | The data that the technical analysts focus on is the past price data of an asset. |
| 7. | In fundamental analysis, making a prediction on the future value of prices is based on the past and current performance of an asset. | In technical analysis, making a prediction is based on the signals given on the charts and indicators in the chart. |
Technical analysis is often used the most because it is an activity that is done by millions of traders around the world. Even right now it is accessible to anyone that has an electronic device. Most of the traders participating in technical analysis are regarded as retail traders mainly because they partake in trading activities from their respective homes. While Fundamental analysis is an activity done by businesses and corporations. They provide investment services to a lot of clients who trusts them with their money. They are often regarded as Institutional investors.
2.) Choose one of the following crypto assets and perform a Fundamental Analysis indicating the objective of the Project, Financial Metrics, and On-Chain Metrics: Cardano (ADA), Solana (SOL), Terra (MOON), Chiliz (CHZ), Polkadot (DOT)
In this exercise, I would be doing a fundamental analysis of Polkadot.
Polkadot (DOT)
Polkadot has some interesting use cases, it provides governance for the network, it creates parachain by bonding DOT. Polkadot allows users to make use of their platform in a shared connectivity layer. New chains can decide to maintain their own validators or make use of the already existing secured nodes on Polkadot to verify transactions via the relay chain. It allows for the data to be transferred from one blockchain to another. It is a platform the allows multichain applications such as cross-chain registries and cross-chain computation.
Polkadot is in the Smart Contracts sector. Smart contracts are agreements between users that are self-executing. They make use of computer codes that are written for this purpose and perform specific actions that can be done manually. Smart contracts are very important because they provide a level of trustlessness that is badly needed in blockchain technology. It also powers decentralized finance applications.
In the smart contract arena, there are heavyweights such as Ethereum and Solana. Ethereum is the most popular smart contract platform mainly because of its reputation of being the first cryptocurrency to enter the smart contract niche and its ability to create smart contract through it Turing -complete system. There are other smart contract chains to have come out with most being dubbed "The Ethereum Killers". But so far only two have stepped up in the race to become the Ethereum killer. One of such is Solana, while the next is Polkadot. Polkadot is currently the third-best smart contract project in the blockchain universe. Polkadot uses parachains and relay chains to help scale the network. This is a novel idea as it helps scale the network faster and also reduces the cost of transactions

The White Paper is an essential document that is used to promote the features of a project or the solution that the project offers. It is used to influence the decision-making processes of current and prospective customers. Polkadot whitepaper talks about the aspect of blockchain architecture that poses problems namely Canonicality and Validity. Then it describes how its network intends to solve these problems.

The team behind Polkadot is Dr. Gavin Wood who is the founder of Polkadot. He was the former CTO of Ethereum and the co-founder of Ethereum. Mr. Rober Habermeier who is the co-founder of Polkadot is a Thiel Fellow. Then there is Peter Czaban who is also a co-founder of Polkadot and the current Technology Director of the Web3 Foundation.
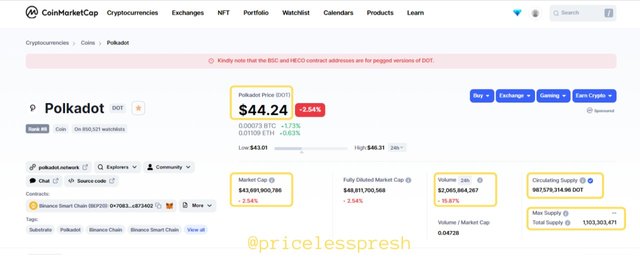
The current price of DOT, the native coin of Polkadot is $44.24. Market Capitalization stands at $43,691,900,786. The 24 Hour volume (Liquidity) currently is at $2,045,864,267. The Circulating Supply stands at 987,579,314.96 DOT. The Total Supply currently stands at 1,103,303,471 DOT. The Maximum Supply is NIL. This is because the supply of DOT is released in perpetuity and at a rate of inflation that is determined by the network.
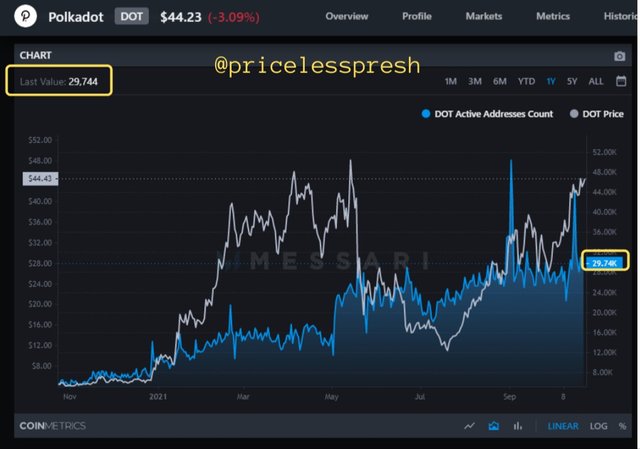
The total active address stands at 29744. This is an indication of the number of people doing transactions with their Polkadot addresses. Though when we relate it with the current price, we can see that as the price increased the volume of transactions reduced. But it is still a good indication that there's a lot of activity going on in the network.
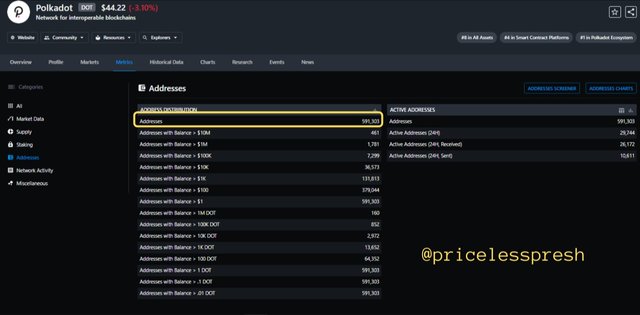
The total number of wallets created currently stands at 591,303. These addresses are further distributed into different weights. For instance, addresses with a balance of $10M and above are 461, the addresses with 1M and above are at 1,781. There are more on the list. The two sets of addresses above show that there is a lot of liquidity and that the owners of the addresses truly believe in the project.
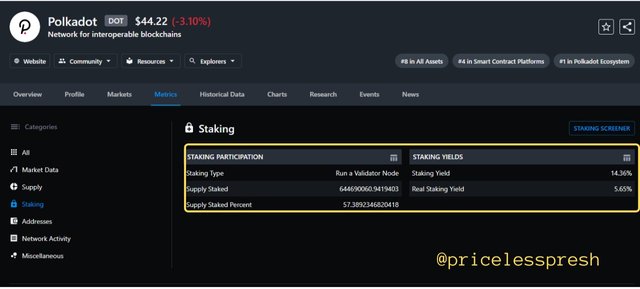
So far the volume of DOT locked in stake is 644690060.9419403 with the percentage being 57.3892346820418%. The yield that is obtained from staking is 14.36% APY. This is an indication that a lot of activity is going on in the network.
3.) Make a purchase from your verified account of at least 10 USD of the currency selected in the previous point. Describe the process. (Show Screenshots)
First of all, you need to have a verified account in any of the exchanges that support DOT coins. In my case I used Binance.
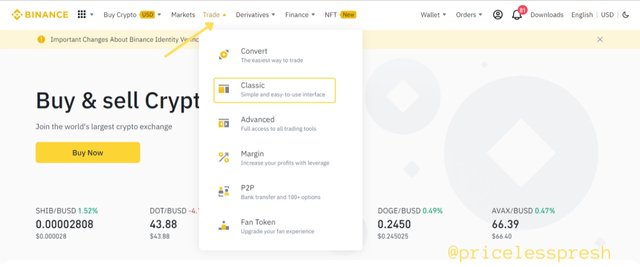
I logged on to the platform and on the home page, I went to Trade. I click on it and a dropdown list with different options popped out. I clicked on the classic option.
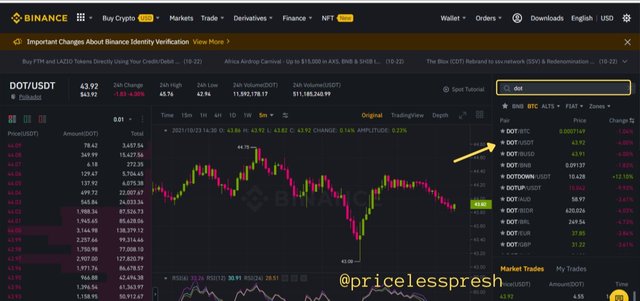
It directed me to the trading portal, at the right side of the screen, is a section where you can choose the coins pairs that you want to trade on. In the search icon, I typed 'dot', which brought out the different pairs of DOT coins. So I clicked on DOTUSDT.
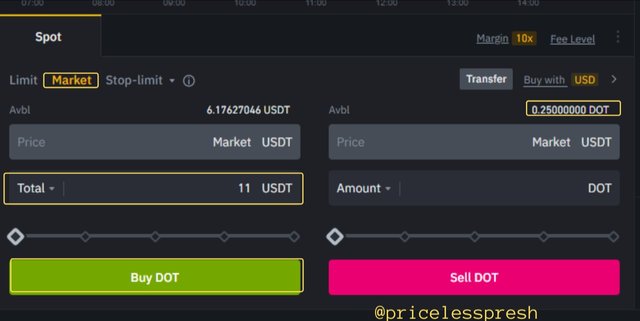
Then I scrolled down to the order interface. I set the order to Market order from Limit, by clicking on Market. Then I input the amount of USDT I want to use to buy DOT coins. I put 11 USDT. Then I clicked on Buy DOT below. After the transaction occurred, my DOT coins automatically showed. I now had 0.25 DOT.
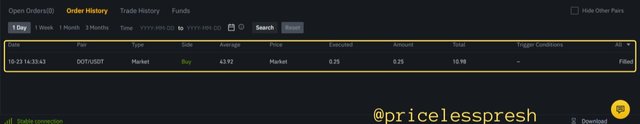
Finally, the transaction was shown in the trading history. The details concerning the trade are found there.
4.) Apply Fibonacci retracements to the previously selected asset with a 4-hour time frame on the platform of your choice. Observe the evolution of the price at 24 and 48 hours, did it go up or down in value? Look to identify resistance and support levels. (Show Screenshots at 0, 24, and 48 hours of purchase where the date and time are observed)
For this exercise, I did the requested question in reverse order. I purchase the DOT token today 23th October 2021. Therefore there was no way to check the movement of the price due to the deadline given. So the period used is 22/10/2021 to 23/10/2021 & 21/10/2021 to 23/10/2021. I hope this is taken into consideration.
Fibonacci Retracements levels are price levels that traders usually anticipate during trading operations. Traders use it to get reversal signals or a continuation of a trend. We can also check if a trend occurred by looking at two extreme points in the signal. The first point is 1 or 100% margin and the second point is 0 or 0% margin. When checking for an uptrend or a downtrend these extreme points are used interchangeably. There is also a midpoint which is at 0.5 or 50% margin which can be used as a support or resistance level.
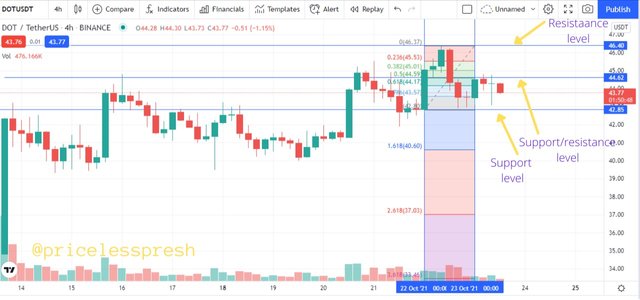
For the period between the 22nd and 23rd of October, the price of DOT moved from the Fibonacci point of 42.85 USDT. This point then became the support level. It is also the first extreme point at 1 or 100%. Then it moved to the price of 46.40 USDT which became the resistance level. This new point is the next extreme point at a 0 or 0% margin. There is also a midpoint between these extremes at 44.62 USDT where it can be used as either a support or resistance level. This shows that the price experienced an uptrend.
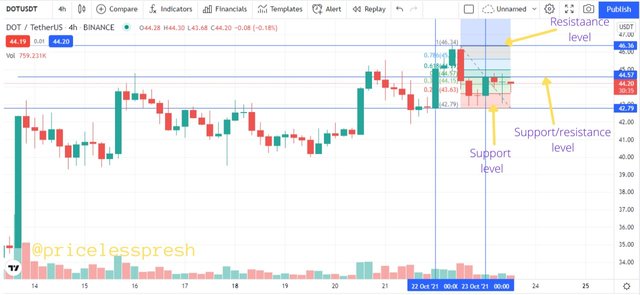
However, the price also experienced a downward trend because it touched the resistance level and went back down. As it did so, it went from the extreme point of 1 or 100% to 0 or 0%. The price from where it started its downtrend is at 46.36 USDT, the mid point was at 44.57 USDT, and the second point was at 42.79 USDT.
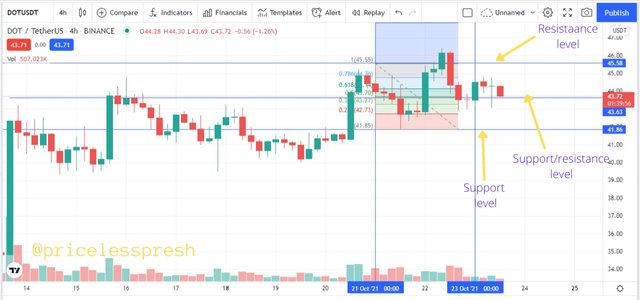
The next period is between the 21st and 23rd of October. The price experienced a downtrend. As seen on the chart the upper wick on the candlestick is longer than the lower wick, meaning that a lot of sellers came in and started selling the DOT coin. The pressure from the sales made the price of DOT go down. This is then represented on the Fibonacci retracement levels from the first extreme point 1 or 100% to the second extreme point 0 or 0%. Both points at the time acted as support and resistance levels. The first point was at 45.58 USDT and the second point was at 41.86 USDT. Then there is also the midpoint at 43.63 which can act as a support or resistance line.
5.) What are Bollinger Bands? How do they apply to Crypto Technical Analysis? With which other tool or indicator do you combine Bollinger Bands to analyze a Crypto? Justify your answer.
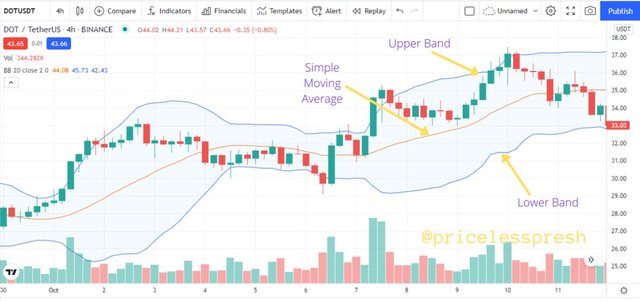
Bollinger Band (BB) is a technical analysis tool that has a simple moving average line and two trendlines plotted on top and below it. The simple moving average line is in the middle and the trendlines are 2 standard deviations above it and 2 standard deviations below it. The two trendlines are known as the upper band and the lower band. It makes use of standard deviations because Bollinger Bands predominantly measure the volatility of an asset.
The indicator was developed and made copyright by John Bollinger who wanted to help traders to make good trading decisions when they use the indicator. It helps give traders an insight into the movement and the volatility of the price of an asset.
To calculate the Bollinger Band, this is the formula to use:
UB = SMA(P,n) + m x σ [P,n]
LB = SMA(P,n) + m x σ [P,n]
Where:
UB - Upper Band
LB - Lower Band
SMA - Simple Moving Average
P - Price = (High + Low + Close) / 3
n - Number of days in smoothing period
m - Number of standard deviations
σ[P,n] - Standard deviation over the last n period of P.
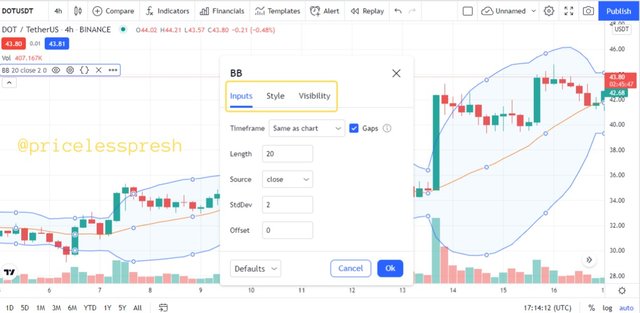
The Bollinger band use a default of 20 simple moving average and 2 standard deviations for either band. But it can be manipulated by inputting the value of the moving average and standard deviation that suits the trader.
There are various ways to use the Bollinger bands. Some of them include using it to get an overbought or oversold condition. Also due to the effect of volatility, it shows when the market has become highly volatile by the upper and lower bands expanding, and also shows when the market is less volatile by the bands contracting. Traders can also use the upper bands and lower bands as resistance and support levels.
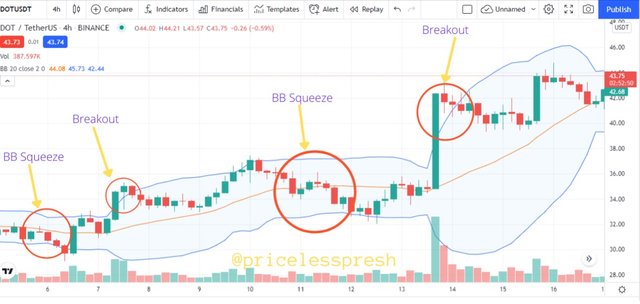
There are also two concepts to follow during the periods of expansion and contractions. They are the Squeeze and Breakouts.
The Squeeze is a concept that describes the period of less volatility. During this period, the upper and lower bands contract and make the BB indicator thinner. Traders become very aware of this period as it is considered a sign of a potential sign of increased volatility in the future.
Breakout sparks an interest in the minds of traders because the movements of assets are within the bands most of the time.
However, both are not signals by themselves, they are occurrences that traders should be aware of while using the Bollinger Band Indicator.
Pros
Can be used to determine overbought and oversold conditions.
Can be used to follow the trend of an asset.
Can be used to show a support or resistance level.
Can be used to monitor breakout from a certain resistance or support level.
Cons
Cannot be used as a standalone trading indicator because it focuses on the volatility of an asset.
Since they use the value of a simple moving average, the data input weighs older price the same as the most recent price. This makes new data to be diluted.
One of the best trading indicators to use alongside Bollinger Bands is the Relative Strength Index. First off, RSI is an indicator that oscillates between two conditions, overbought and oversold. It is a momentum indicator, while BB is a volatility indicator.
Now RSI is used to check for when an asset has reached its overbought or oversold condition. That is what it is created for, BB can also be used to check when an asset is in an overbought or oversold condition too. When the value of an asset breaks out from the bands, it is an indication that the prices have reached an extreme point and are set to reverse.
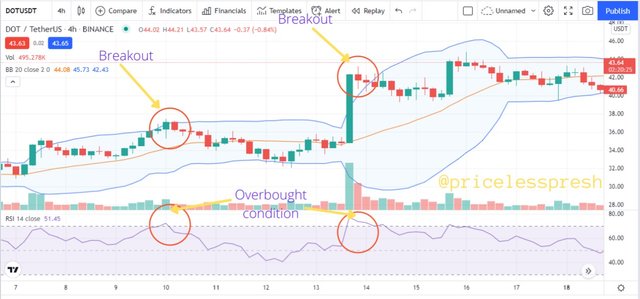
The image above gives a clear illustration of this. When the RSI indicator was at an overbought point, the price had broken out of the BB, meaning that it had reached an overbought condition. This then followed a reversal in the direction of the price.
Conclusion
The two common ways by which an investor and a trader check for the behavior of the market are through fundamental analysis and technical analysis. Both methodologies have their pros and cons. Fundamental analysts are usually institutional investors or businesses. They have large amounts of money to invest in an asset, and the procedure followed is different and longer than technical analysts. Fundamental analysis involves the checking of key points in an asset. For instance, in a crypto asset, a fundamental analyst checks for metrics such as market cap, the number of wallets, the team behind the project, etc.
A technical analyst on the other hand makes use of a charting technique to determine the behavior of the market. They do this by checking for the patterns or trends found in the chart in which the price has been displayed. To accompany the chart techniques, indicators such as Bollinger Bands and Relative Strength Index have been created to assist technical analysts.
Polkadot has good fundamentals. It is a cryptocurrency project in the smart contracts sector, this is essential because the new generation of blockchain technology employs the use of smart contracts in their chains. Also, the market for the smart contract has expanded since the first smart contract that was executed by Ethereum. Their blockchain technology is rightly placed to be the top smart contracts blockchain.
Gracias por participar en la Cuarta Temporada de la Steemit Crypto Academy.
Continua esforzandote, espero seguir corrigiendo tus asignaciones.
Good day sir @imagen.
Thank you for grading my home work post I have started the club5050 programs I just powered up 50 steem.💃🏽💃🏽💃🏽
CC : @steemcurator02