Trading with Accumulation / Distribution (A/D) Indicator - Crypto Academy / S4W5 - Homework Post for professor @allbert.


1- Explain in your own words what the A/D Indicator is and how and why it relates to volume. (Screenshots needed).
The market move in cycles which is shown by the order of the cycle in which the market moves. It starts with the Accumulation phase, followed by an Uptrend, then a Distribution phase, followed by a Downtrend.
The two phases that are of utmost importance here are the Accumulation phase and the Distribution phase. The Accumulation phase is the time period in the life of an asset when traders and investors purchase the asset and hold on to it. While the Distribution phase is the time period when traders and investors begin to sell off their positions on the asset that was previously held.
The A/D Indicator is a technical indicator that lets a trader or an investor have an idea of when the market is currently in the Accumulation phase or when the market is in the Distribution phase. This is achieved through the signals given from the A/D indicator. The 'A/D' means Accumulation/Distribution.
It is also used to identify divergences between a crypto asset and the volume flow. That is when the price of a crypto asset is moving in one direction while the number of traders or investors is placing a market entry in an opposite direction. This helps to give a view of how strong a trend is. It also shows that a current trend is at a time of exhaustion, which means the traders or investors are exhausted.
On the crypto asset chart, it is shown when the price of an asset is moving in one direction and the A/D indicator is moving in another direction. For instance, the price of a crypto asset is falling and the A/D indicator is rising, this means that selling or distribution volume may not be enough to support the price fall and a price increase is imminent.
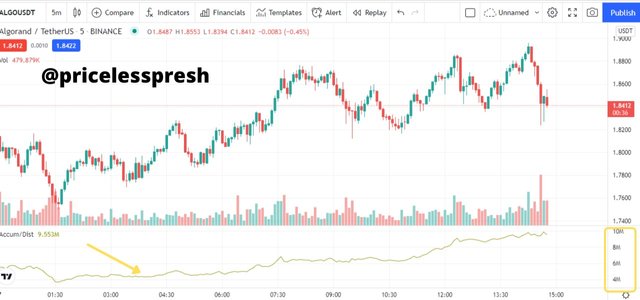
It is composed of a line. This line is known as the A/D Line, this is the line that gives a signal when using the A/D indicator. This line moves up and down the scale that is found at the right side of the indicator like an oscillator. The line represents supply & demand and the accompanying volume and how it affects the price of a crypto asset. This is shown when the A/D line moves in the same direction as price or when it moves in an opposite direction.
The A/D line helps traders or investors to assess the price trend of a crypto asset and any potential price reversal. So if the price of a crypto asset is in a downtrend and the A/D line is moving upwards, this line tells that there is enough buying pressure and the price of the asset would soon be on an increase. Conversely, if the price of a crypto asset is in an uptrend and the A/D line is moving downwards, this line tells us that there may be selling pressures and that means that a decline in price would soon occur.
How and Why it relates to Volume
Volume is the number of traders or investors trading a crypto asset during a given period of time. It is very important because it measures the relative significance of a move in a crypto asset. The higher the volume during a price move, the more significant the move, and the lower the volume during a price move, the less significant the move.
It lets a trader know how much is being traded at a given period of time. At the start of Accumulation or Distribution, volume is higher at those times because more people are buying or selling at those times. This is then shown on the Accumulation/Distribution indicator and then reflected on the crypto asset chart when the price begins to move up or down.
The volume through the Accumulation/Distribution indicator is shown when the price trend of an asset and the indicator are in Confluence with each other. Also, the volume can also be shown through Convergence or Divergence. That is when the price trend is going in one direction and the Accumulation/Distribution indicator is going in another direction. This usually indicates exhaustion in the current trend and a start of a new trend.

2- Through some platforms, show the process of how to place the A/D Indicator (Screenshots needed)
The accumulation/Distribution (A/D) indicator is a very popular indicator that can be accessed on any trading platform.
For this exercise, I would be using Tradingview to show the processes involved in placing the A/D indicator on a trading chart.
Step 1
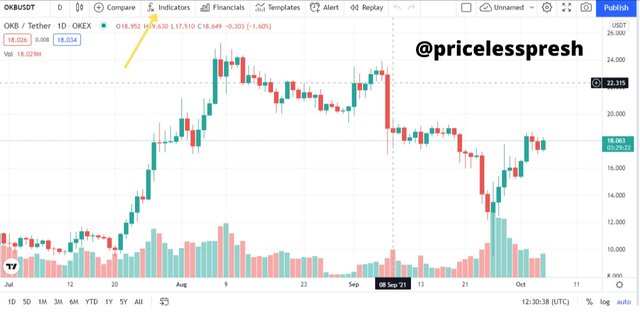
On the trading platform, click on Indicators. It is found at the top of the trading interface.
Step 2
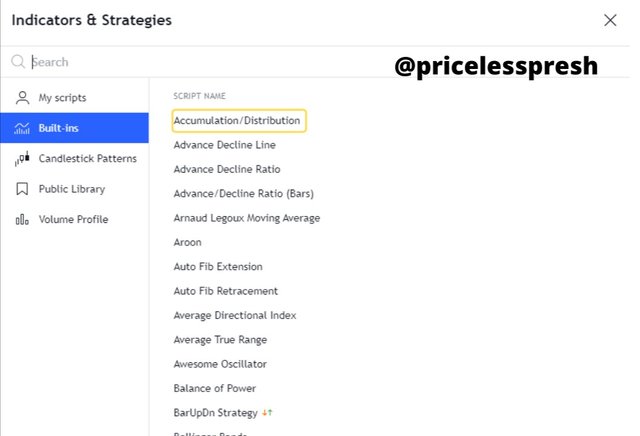
After clicking on indicators, a panel showing a list of indicators would display. Choose the indicator to be used, in this case, Accumulation/Distribution. It is the first on the list.
Step 3
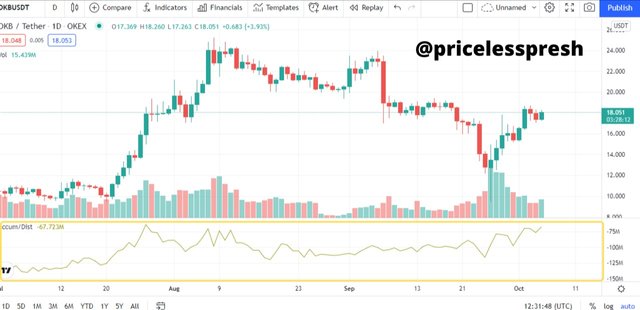
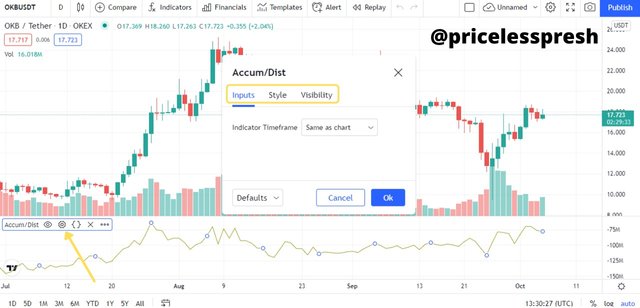
When you click on the indicator, it automatically displays on the chart. It is located at the bottom of the trading interface, just below the chart.
Step 4
You can go ahead and change the settings for the indicator. Scroll to the left on the indicator, the option for settings would appear. Click on it and different options such as Inputs, Style, and Visibility. Choose anyone to change the settings of the indicator.

3- Explain through an example the formula of the A/D Indicator. (Originality will be taken into account).
To Calculate the Accumulation/Distribution Indicator, the formula used is:
Accumulation/Distribution = Previous Accumulation/Distribution + Current Period's Money Flow Volume
Money Flow Volume = Money Flow Multiplier X Volume for the Period
Money Flow Multiplier= ((Close-Low)-(High-Close))/((High-Low))
Where,
Close - Closing Price of the Candlestick
Low - Lowest Price of the Candlestick
High - Highest Price of the Candlestick
To get the Accumulation/Distribution, the Money Flow Volume is needed, and to get the Money Flow Volume, the Money Flow Multiplier is needed.
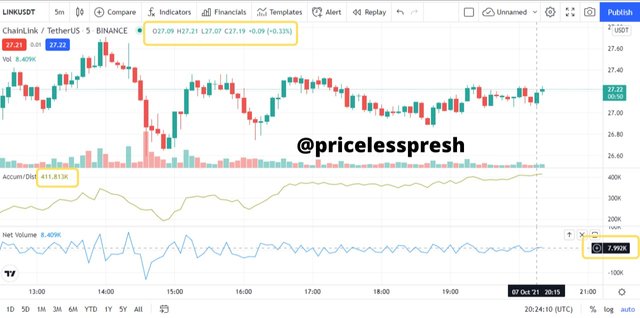
At the top of the chart, we can see the Open, High, Low, and Close prices of the Candlestick in focus. The figures are Open = 27.09, High = 27.21, Low = 27.07, and Close = 27.19.
So we input the figures in the Money Flow Multiplier
= ((27.19-27.07)-(27.21-27.19))/((27.21-27.07)) = -0.88. Thus, Money Flow Multiplier = 0.88
Then we get the Money Flow Volume. The Volume for the period is 7.992K
= Money Flow Multiplier X Volume for the Period = 0.88 x 7992 = 7032.96. Thus, Money Flow Volume = 7.03276K
Finally, Accumulation/Distribution is derived by inputting the values into its equation. The previous Accumulation/Distribution s given as 399.197K. So Accumulation/Distribution is
= 403187 + 7032.96 = 410,219.96. Thus Accumulation/Distribution = 410.219K. This is a rough estimate as the value for the current Accumulation/Distribution is 411.813K

4- How is it possible to detect and confirm a trend through the A/D indicator? (Screenshots needed)
I will be giving an illustration on how to detect and confirm trends when using the Accumulation/Distribution (A/D) indicator to trade.
Bullish Trend
A Bullish trend is detected when the movement in the price of the crypto asset and the movement of the A/D line is in confluence with each other. The direction of the movement was up.
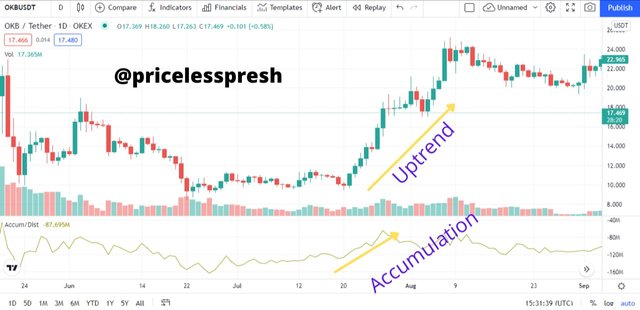
From the image above we can see that the price of the crypto asset was increasing and the A/D indicator line was also increasing. This shows that there were a lot of buying pressures as traders were accumulating the crypto asset. This led to the price increasing.
Bearish Trend
A Bearish trend is detected when there is a downward movement in the price of the crypto asset and at the same time a downward movement of the A/D line.
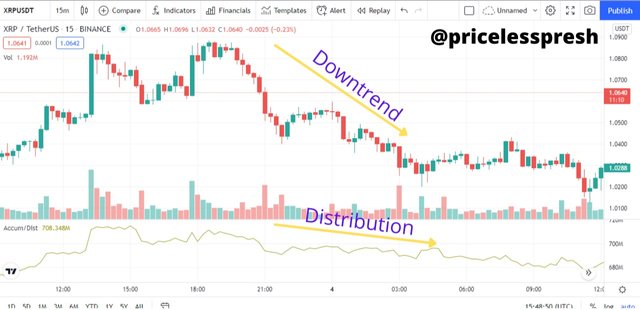
From the image above we can see that the price of the crypto asset was decreasing and the A/D indicator line was also decreasing too. This shows that there were a lot of selling pressures as traders were distributing the crypto asset. This led to a downtrend of the price.

5- Through a DEMO account, perform one trading operation (BUY or SELL) using the A/D Indicator only. (Screenshots needed).
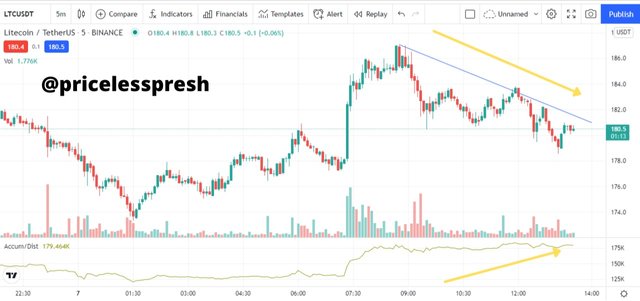
I found a Divergence (Convergence) where the price of the asset was moving in one direction and the indicator was moving in another direction. The yellow arrows show the direction of the movement of price and the A/D indicator.
The price was moving in a downtrend, this is shown with 3 lower highs. So I connected them together with the Blue thin line. And the A/D line was moving upwards. The Blue thin line acts as a trend line.
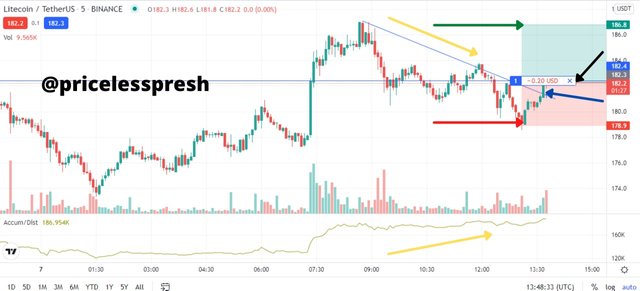
I waited for the price to break the trend line. After that, I waited for it to move up then I place a Market Buy order. Then I placed my stop-loss and take-profit points. The Price Breakout from the trend line is indicated by the blue arrow, the Market Entry is indicated with the black arrow, and the Stop-loss and Take profit points are indicated with the Red and Green arrows respectively. I placed my Stop-loss at the peak point of the downtrend, while my take profit is at the point where the downtrend started from.
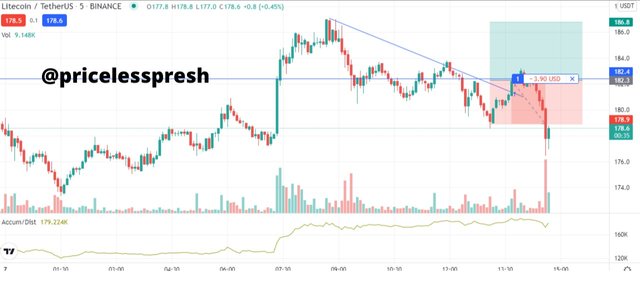
I let the market price move and unfortunately, the price didn't go up as expected. Rather it came down and touched my Stop-loss point.

6- What other indicator can be used in conjunction with the A/D Indicator. Justify, explain and test. (Screenshots needed).
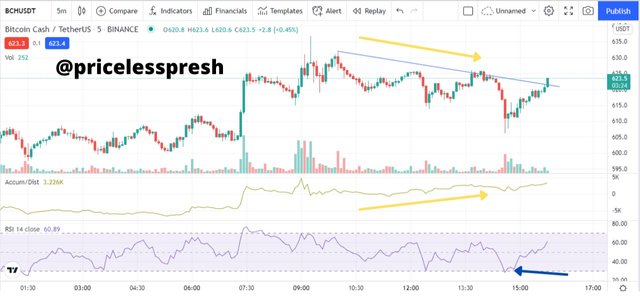
I made use of Relative Strength Index (RSI) because it is an indicator that shows the condition of the market. It shows when the market is in an overbought region and when the market is in an oversold region.
The method used here was the Divergence (Convergence) method of the A/D indicator. The price of the asset was on a downtrend, while the A/D line was going up. On the RSI indicator, the market had reached its oversold state and had started moving up.
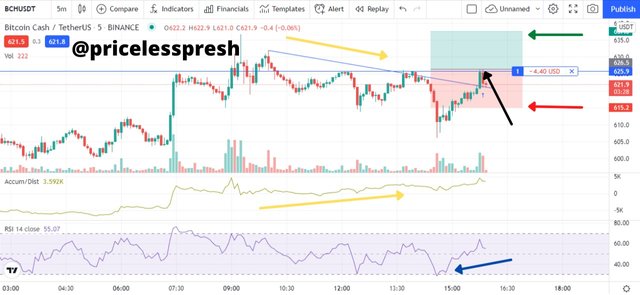
So I waited for the price to move up to where it would cross over the trend line before I placed a Market Entry. The price finally broke through the trend line. So I opened a position there. The blue thin line is the trend line, the yellow arrows show the direction of the price of the crypto asset, and the A/D indicator line. The black arrow is my Entry Point, then the Red and Green arrows are the Stop-Loss and Take Profit points respectively and the Blue arrow shows the oversold condition of the RSI indicator.
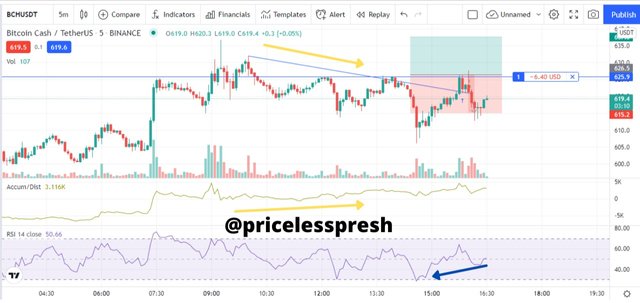
Checking the performance of the Market Entry after using a combination of the A/D indicator and RSI indicator after some time, the price didn't go up as expected. I believe that because the RSI follows the market principles it reached a point that was in a higher state or oversold condition. The distance between the oversold state on the RSI and the peak to trend line breakout on the chart is a full trade. So even though the A/D line and the RSI started to move in confluence with each other, the market retracted as it touched high levels on the RSI, which is the area where the price broke away from the trend line. So I think the price would still experience an upward movement later on.

Conclusion
The A/D indicator is a very effective indicator. It shows the direction of the market at a given period in time. It shows when the market is in an Accumulation Phase or when the Market is in a Distribution Phase. This is identified on the crypto asset when the price is moving upwards or downwards. It also shows when a current trend is about to be exhausted and a start of a new trend is about to begin. This is shown when there is a divergence in the movement of the price of a crypto asset and the A/D line.
It makes use of Volume. That is the number of traders that are currently buying or selling in the market. The figure of the volume is shown in the scale panel at the right side of the A/D indicator.
Though the A/D indicator is effective as a standalone technical indicator, it is still necessary to use it in conjunction with another technical indicator to give the trader the best possible outcome of their trading operations.
NOTE:All images are from Tradingview, except the cover image.
CC: @allbert