Crypto Academy Season 5 [ Advanced course ] Week 6 : Highly Profitable Trading Strategy with VuManChu Cipher B

Cover Image Created by Adobe PS
Hello Steemians!
I have taken another interesting lesson for the 6th week of Season 5. During the past 2 weeks, we were able to create new Crypto Tokens and list them in a public exchange. Now I think almost everyone has great knowledge about creating Crypto Tokens. So, same as previously, today I will discuss a slightly different topic than in previous weeks.
Today our topic is "Highly Profitable Trading Strategy with VuManChu Cipher B." This is not just an indicator but can be used as a very successful trading strategy. In today's lesson, we will learn how to do that. So let's go straight to the lesson.


Screenshot was taken from https://www.tradingview.com/symbols/BTCUSDT/
Basically, VuManChu Cipher B is a highly profitable colourful trading indicator that we can use for both bullish and bearish market predictions. In fact, this indicator is a combined indicator of main different indicators including RSI, Money Flow, Market Momentum and Market Volume. We all know we have some limitations when we use some trading platforms without purchasing their premium packages. In such cases, we are unable to add more than 3 indicators to our charts. So, here we can use this indicator for analyzing our charts beyond current limitations.
This indicator is very similar to the Market Cipher indicator. In fact, we can't use the Market Cipher indicator without purchasing. But we are totally free to use this VuManChu Cipher B indicator from the Public Library of Trading View platform. And also, that has only a few differences as compared to the Market Cipher indicator. Especially, We need to keep in mind that both of these indicators are based on the Wavetrend indicator.
We can use this VuManChu Cipher B indicator for analyzing any Crypto Charts following our desired trading strategy. Actually, this indicator is a bit advanced and complex indicator as it contains a lot of other indicators. However, we can easily use it according to our requirements. In the next subtopics, we will see how to customize this indicator according to our trading strategy.


First of all, we have to add this indicator to our TradingView Chart. Therefore, here I will go to the https://www.tradingview.com platform as the first step. After that, we can open any desired Cryptocurrency related chart such as BTC, BNB, ADA or any other Crypto Chart.
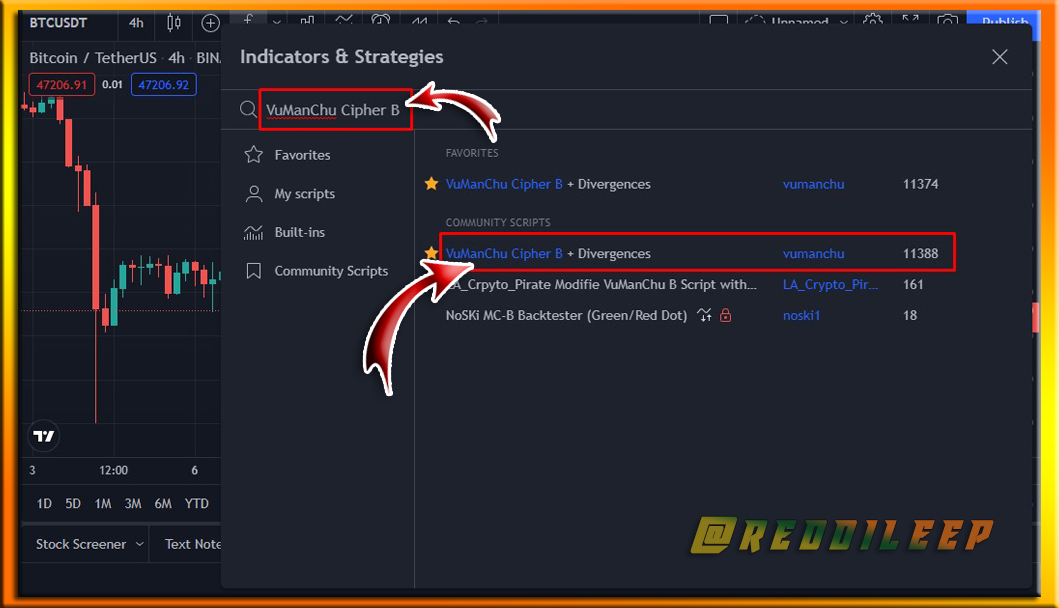
Then we need to open "Indicators & Strategies" and search for "VuManChu Cipher B" in the given search bar. Actually, this is very simple as we have already added a lot of indicators to our Trading charts in our previous lessons. Therefore, here I will not include very basic steps. However, let's look at the search result in our "Indicators & Strategies" window.
Screenshot was taken from https://www.tradingview.com/symbols/BTCUSDT/

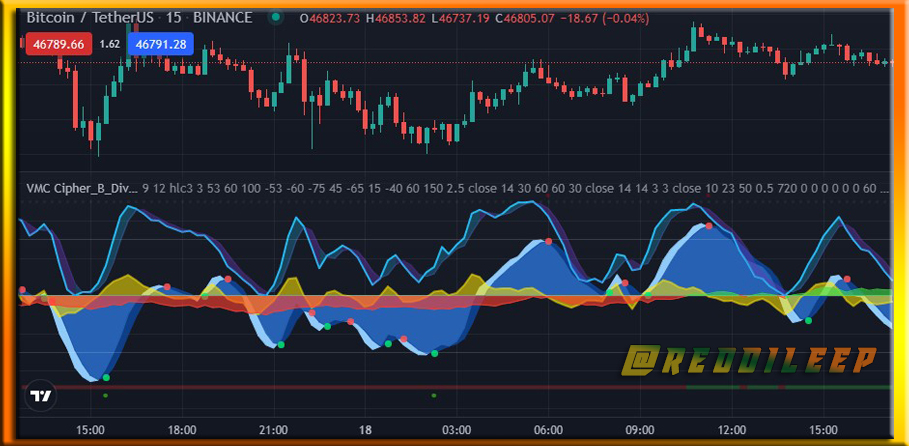
After adding the VuManChu Cipher B Indicator to our chart, we will be able to see a bit complex and colourful indicator in our chart. However, as I said earlier, we will not use all the functions of this indicator. Therefore, we have to customize this indicator according to our requirements. Let's do it.
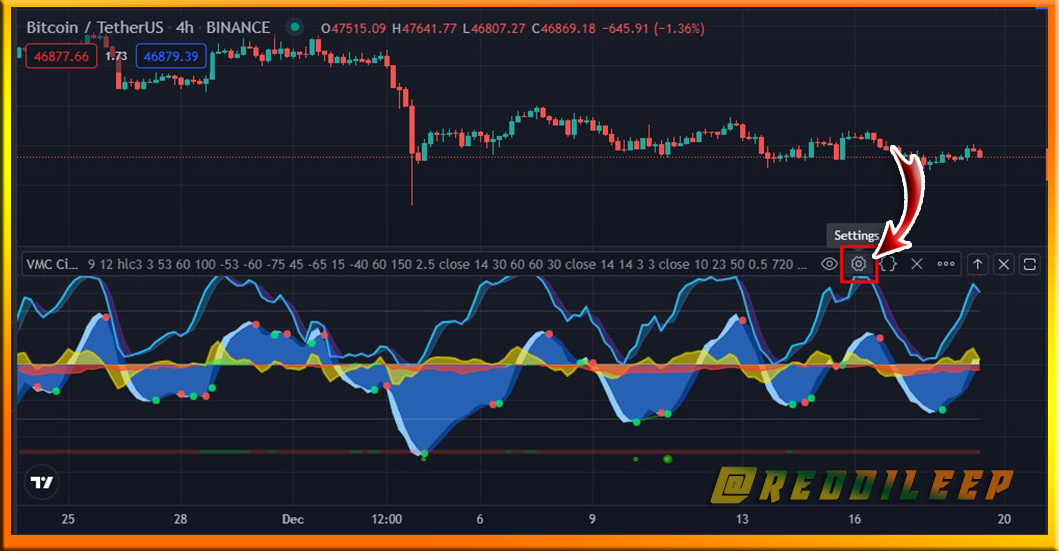
Now I will open the settings window of this VuManChu Cipher B Indicator by clicking on the "settings" icon.
Screenshot was taken from https://www.tradingview.com/symbols/BTCUSDT/

As I described earlier, there are different indicators included in this VuManChu Cipher B Indicator. If we want, we can use all of these indicators together. In fact, there are a lot of different methods to use this indicator. So, as I need to demonstrate my Trading Strategy, here I will skip unnecessary indicators from the settings menu.
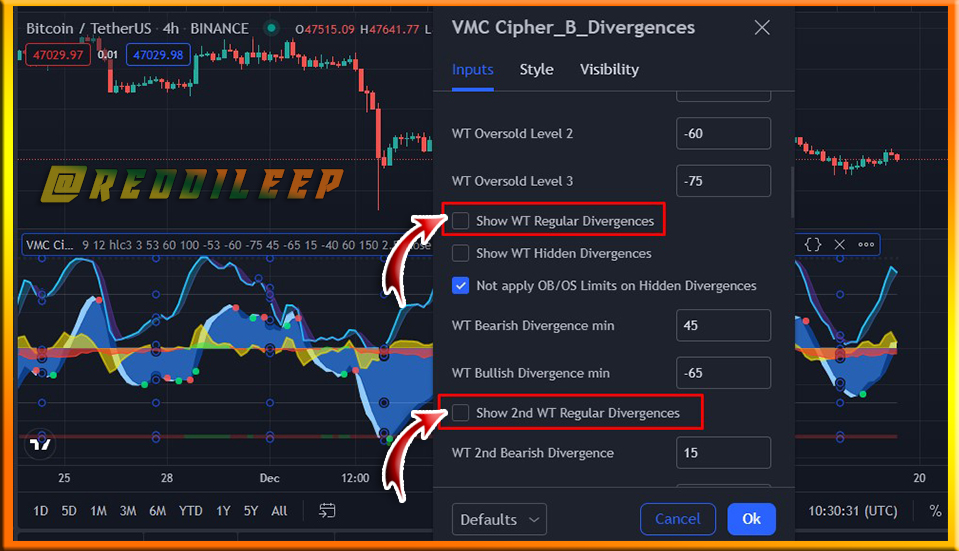
Here we will not use Divergences regularly. Therefore, I can remove the "Tick Button" from "Show WT Regular Divergences" and "Show 2nd WT Regular Divergences". However, we must keep in mind that, there is another trading method with these regular Divergences too.
Screenshot was taken from https://www.tradingview.com/symbols/BTCUSDT/
In addition to that, we will not use Stochastic RSI too. Therefore, again we can remove the "Tick Button" from "Show Stochastic RSI". After that, the appearance of our indicator will look simple than before.
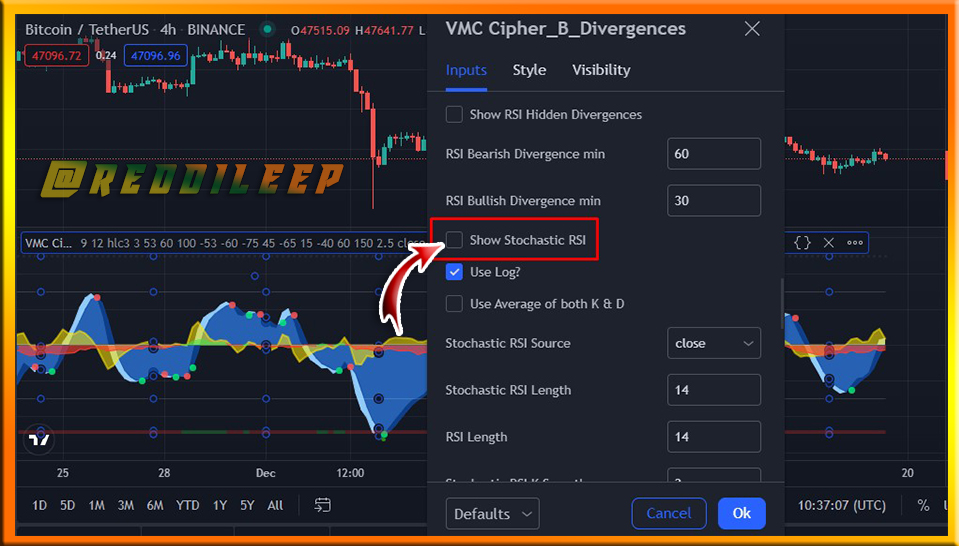
Screenshot was taken from https://www.tradingview.com/symbols/BTCUSDT/

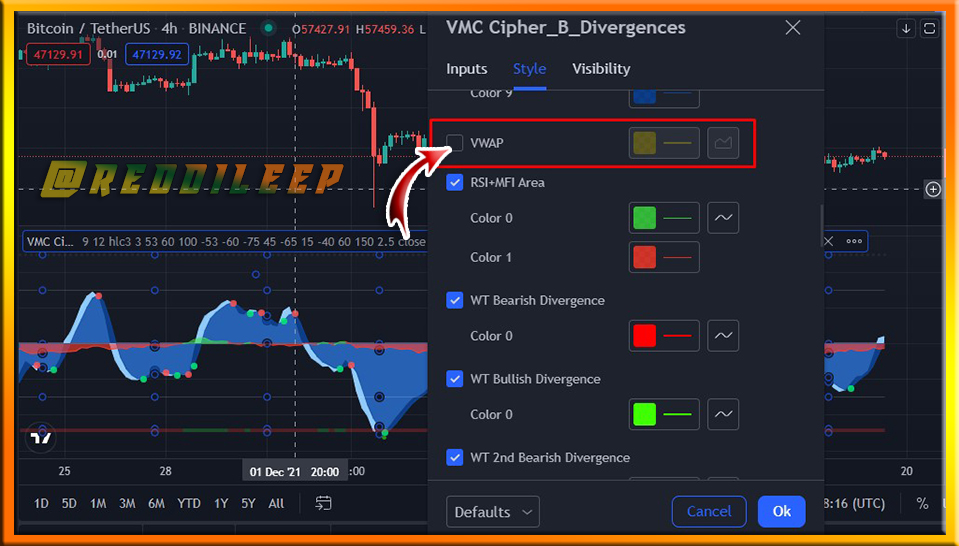
Now we need to change some more settings from the "Style" menu. Therefore, I can easily click on the "Style" icon in the same settings menu.
After that, we need to remove the "VWAP" indicator as the first step in the Style menu. Actually, VWAP is the Volume-Weighted Average Price indicator which represents in yellow colour in our default VuManChu Cipher B Indicator.
Finally, we need to remove the "MFI Bar Colors" indicator. This is a Money Flow Index Colors bar which represents a different colours bar at the bottom. Then, click on the "OK" icon.
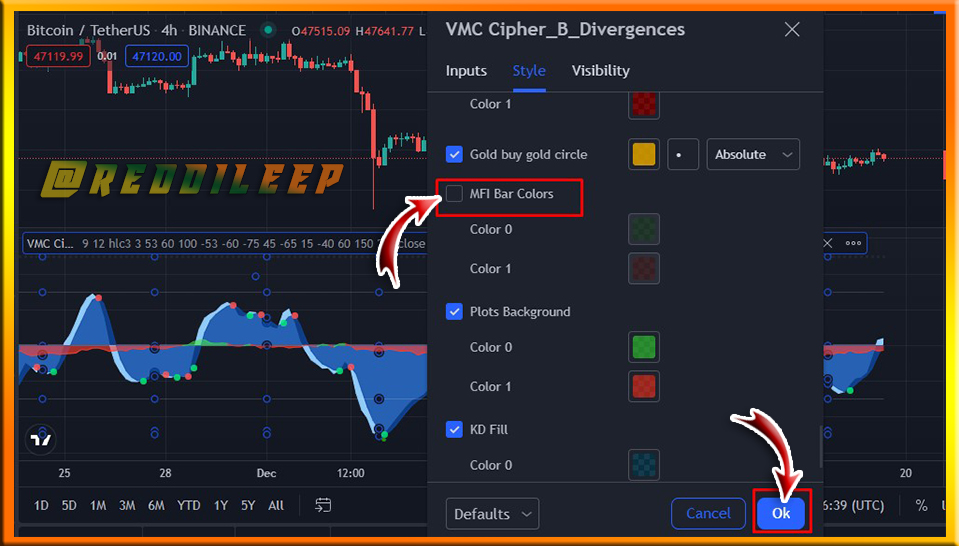
Screenshot was taken from https://www.tradingview.com/symbols/BTCUSDT/
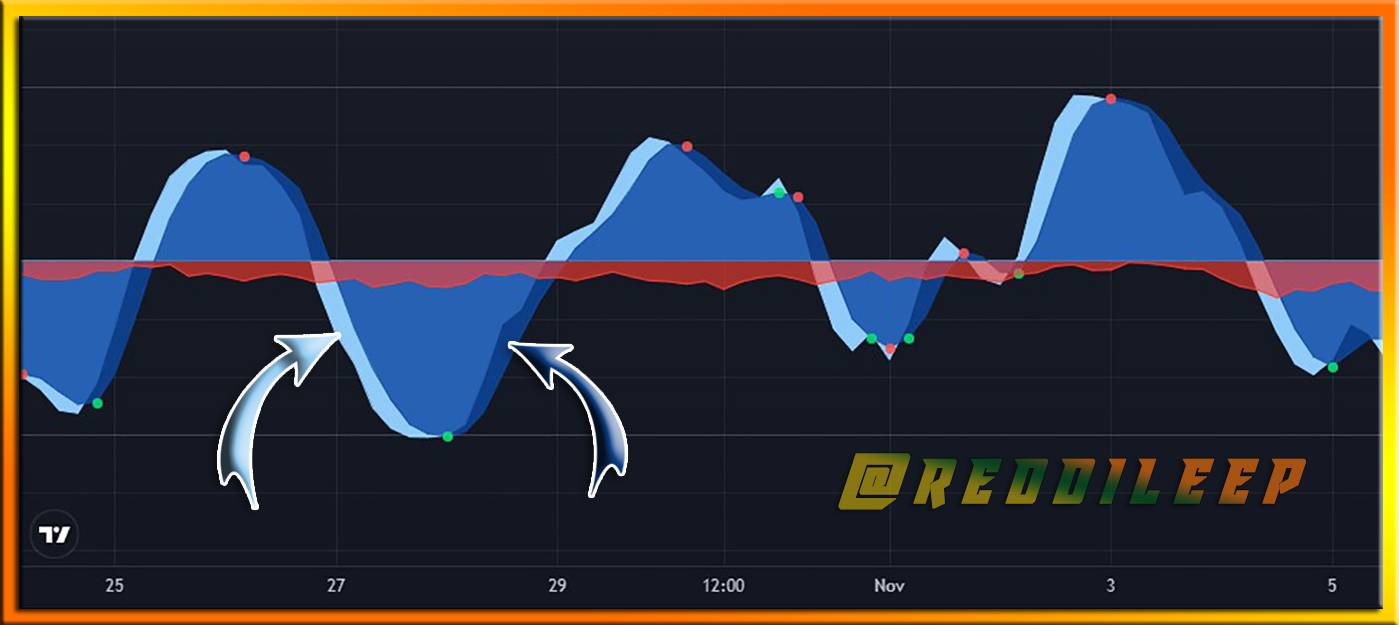
After, removing above mentioned additional indicators, we will receive a clean indicator that is suitable for a Trading Strategy. Then, we need to identify the appearance of our present indicator. We will further understand it in the next subtopic.

Basically, The Wave Trend indicator occupies the most space in this VuManChu Cipher B Indicator. We can see this Wave Trend indicator in Blue Colour. Here we can see mainly two Wave Trends. One will represent from Light Blue Colour and the other Wave Trend indicator shows from Dark Blue Colour.
Screenshot was taken from https://www.tradingview.com/symbols/BTCUSDT/
When the above-mentioned Wave Trends cross each other, we can see small dots from Red colour and Blue Colour.
Screenshot was taken from https://www.tradingview.com/symbols/BTCUSDT/
Then what looks like a cloud of Red and Green is called the Money Flow Index. So when that cloud is Green, it means that money is flowing into an asset. In the same way, when the cloud is Red, it means that money is flowing out of any asset. Check the below-attached screenshot to get an idea about it.
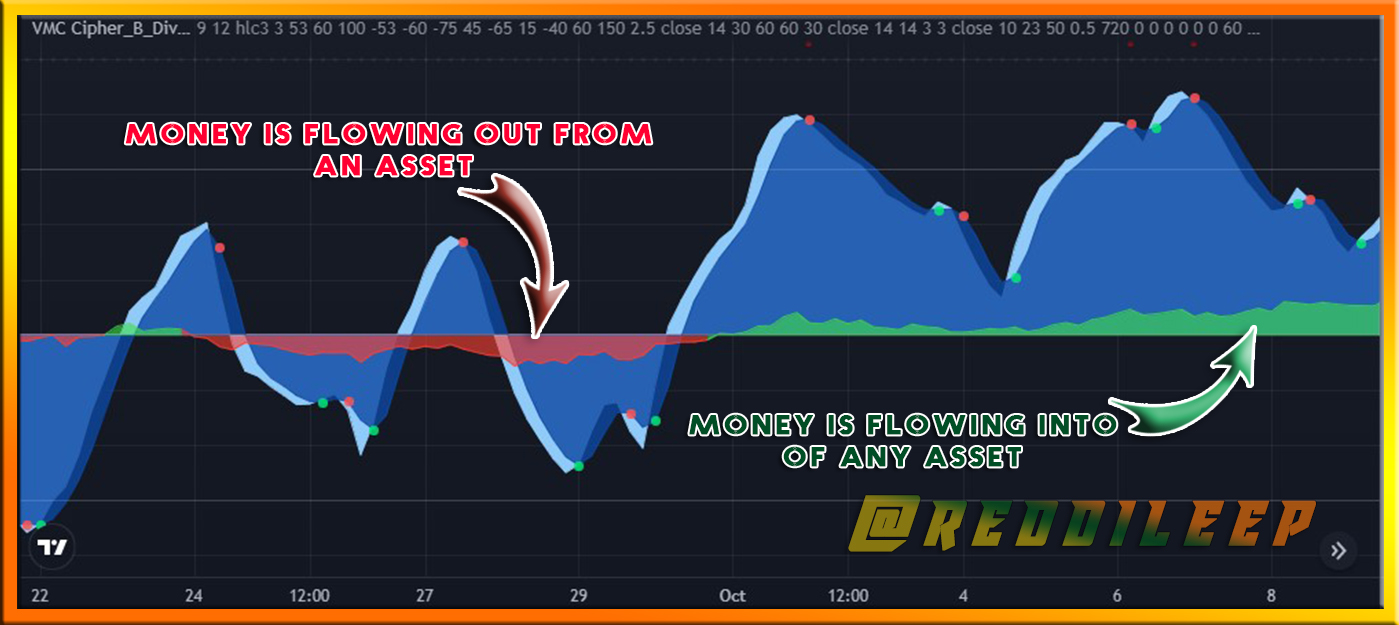
Screenshot was taken from https://www.tradingview.com/symbols/BTCUSDT/
Those are the basic concept that we keep in mind about the appearance of this indicator. However, I will explain it further in the next subtopics.

As mentioned in the topic, we have to combine our main indicator with some other major indicators.
The second indicator that we use for this Strategy is the Exponential Moving Average Indicator (EMA). Here we have to use two EMAs. One is the 200 Period Moving Average and the other one is the 55 Period Moving Average. So, now I will add them to my trading chart window.
Here I need to click on "Indicators & Strategies" again and search for "EMA". Especially, I have to click on "EMA" two times for adding two EMAs to my chart.
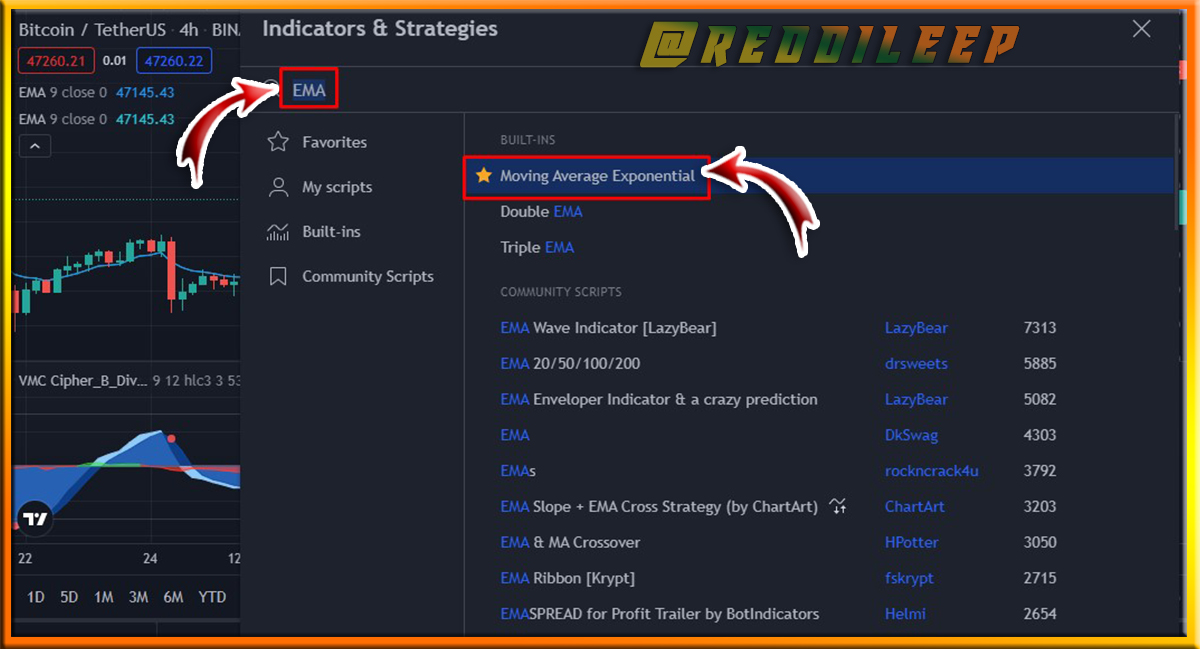
Screenshot was taken from https://www.tradingview.com/symbols/BTCUSDT/
Now I have two EMAs in my trading chart. So, I have to customize them according to the required time periods. (200 Period Moving Average and 55 Period Moving Average). Below I have simply explored it in a screenshot. However, I will not explain these things deeply as we have learned them many times in our previous lessons.
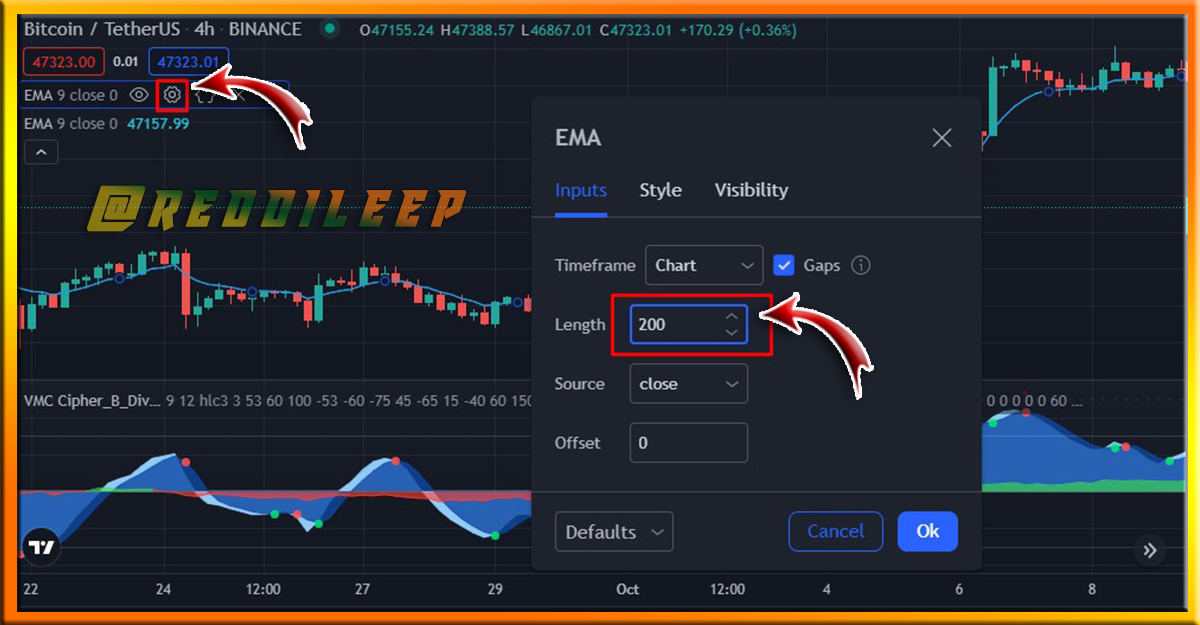
Screenshot was taken from https://www.tradingview.com/symbols/BTCUSDT/
Specially, we have to change the colour of at least one EMA. Because we should identify these two EMAs separately. I can do it by clicking on the "Style" icon. So, here I will change my 200 EMA colour to Yellow colour. You can customize this according to your willingness.
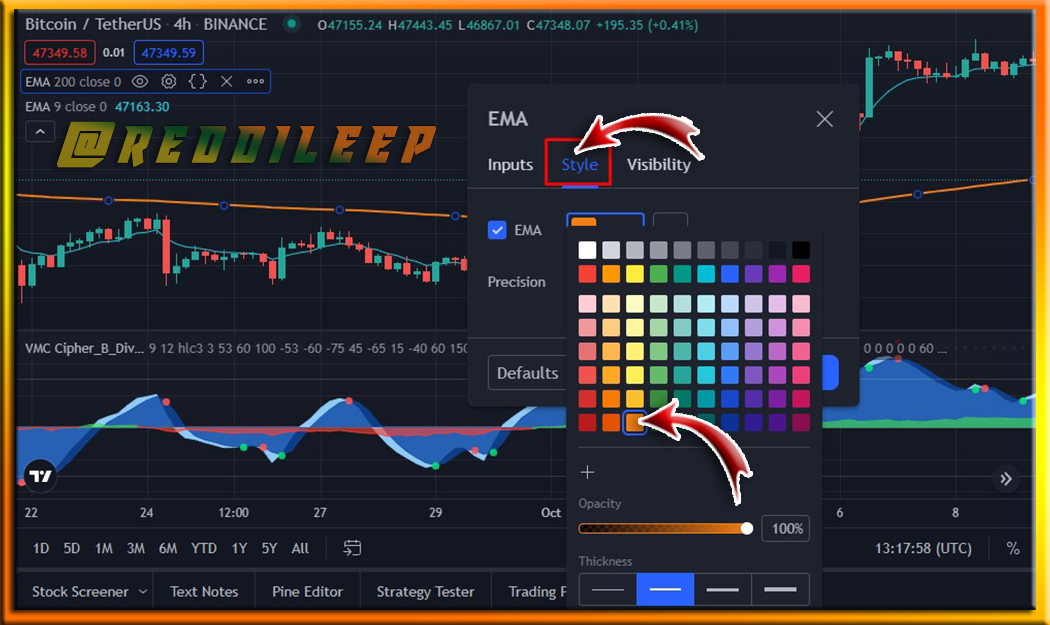
Screenshot was taken from https://www.tradingview.com/symbols/BTCUSDT/
Following the above step, we can also customize our 55 Period Moving Average indicator too. Actually, we can use this Strategy for any time frame. But here I will select 5 min chart as I need to show this Strategy looks like Scalping Type Trading Strategy.
Finally, we are totally ready for our trading Strategy with VuManChu Cipher B. Below I have attached a screenshot of our full trading setup.
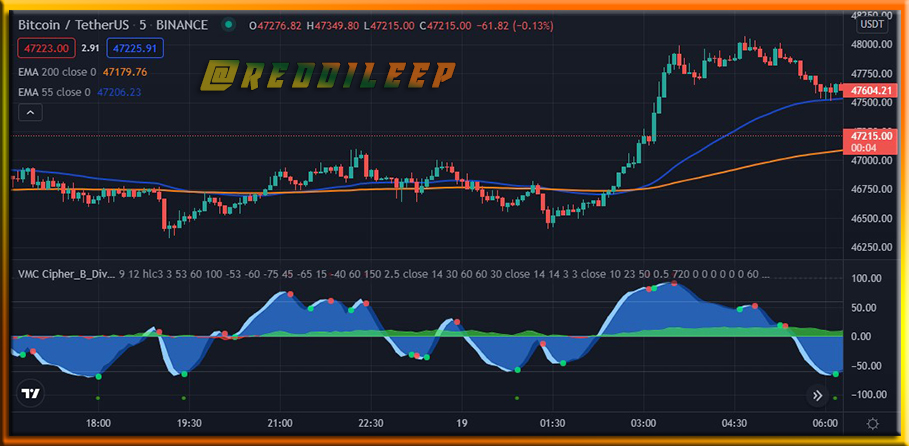
Screenshot was taken from https://www.tradingview.com/symbols/BTCUSDT/

Actually, this is a very simple Strategy. However, I will explain it step by step.
We have already added 200 EMA and 55EMA to our chart. So, we need to wait until these EMAs cross each other. What we do with it is basically to filter out the market trend. So if 55 EMA crosses below 200 EMA, we know that there is a bearish trend in the market. In such cases, we will only take entry for sell short orders. Similarly, in cases where there is 55 EMA above 200 EMA, we will only take entry for buy long orders.
So the first step here is what we really do, we should wait a while for this cross to form. This is because, after the emergence of this cross, the trade that takes place in the immediate vicinity is the most successful. However, we should wait for the confirmation of the VuManChu Cipher B indicator.
- So, let's focus on a Buy Long Entry.
First of all, we should wait until 55 EMA cross above 200 EMA. Furthermore, we do not take the entry just because this crossing has taken place. Still, we have to wait until VuManChu Cipher B confirm the rest of the trading setup.
Then we should focus on the Money Flow Index indicator through our VuManChu Cipher B indicator. As we are looking for a Buy long entry, the Money Flow Index indicator should be green in colour. Because here we should confirm the money is flowing into this asset.
Finally, we should get confirmation from the Wave Trend Indicator through our VuManChu Cipher B indicator. For that, we should wait until Wave Trends crosses each other. We can clearly identify that exact cross with a Green Dot. After the formation of this Green Dot, we can take our buy long entry. I will clearly demonstrate this in a chart.
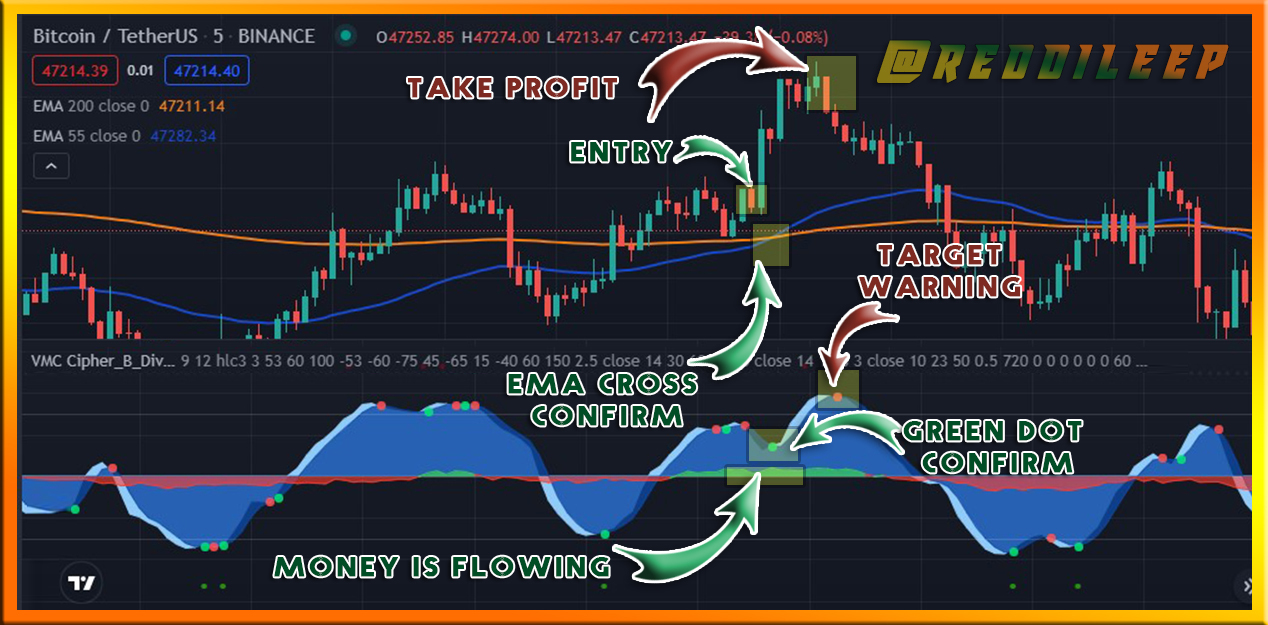
Screenshot was taken from https://www.tradingview.com/symbols/BTCUSDT/
Above I have simply demonstrated the Trading Strategy without including other trading requirements such as support zones, resistance zones and Stop loss. But, when you work with this Strategy, try to mention all the relevant requirements including support zones, resistance zones and Stop loss. Actually, here you can use the recent support zone for your stop loss level. As the target point, you can wait for the next red dot is begin to appear. If not, here you can follow the 1:1 - 1:1.5 risk-reward ratio.
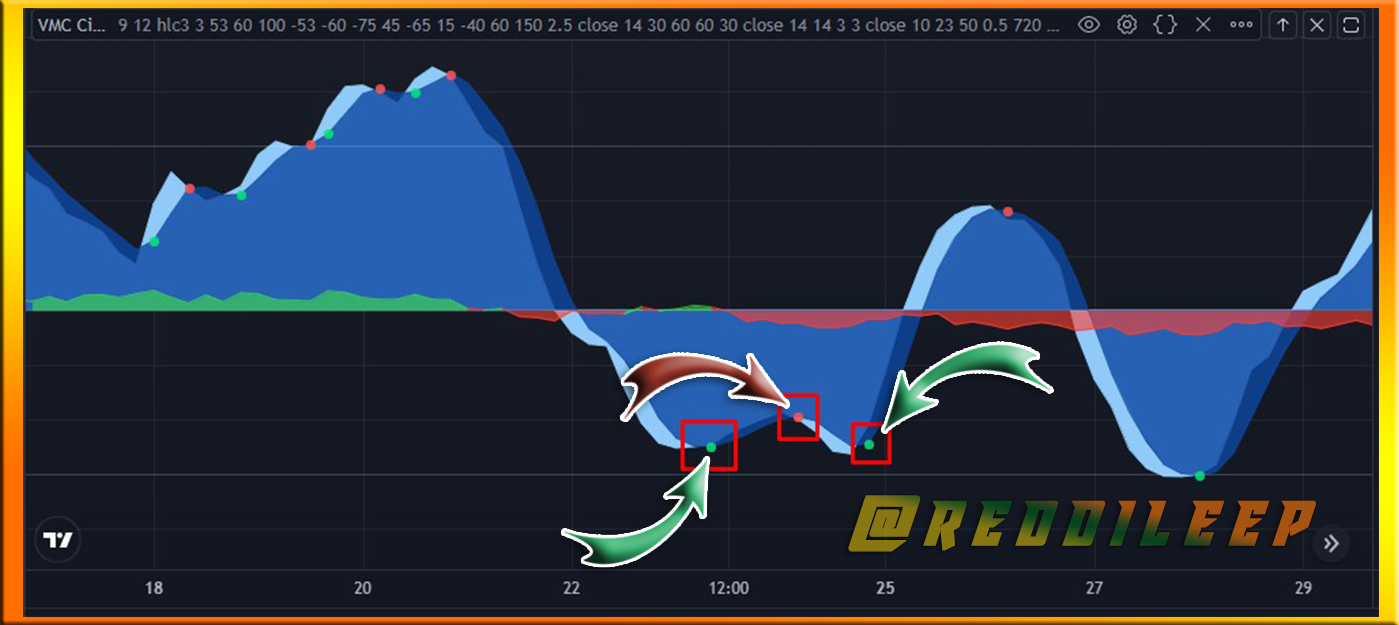
Here we should keep in mind that the Green Dot has appeared below the 0 line of our VuManChu Cipher B indicator will give higher results than it above the 0 line. Let me show such an example.
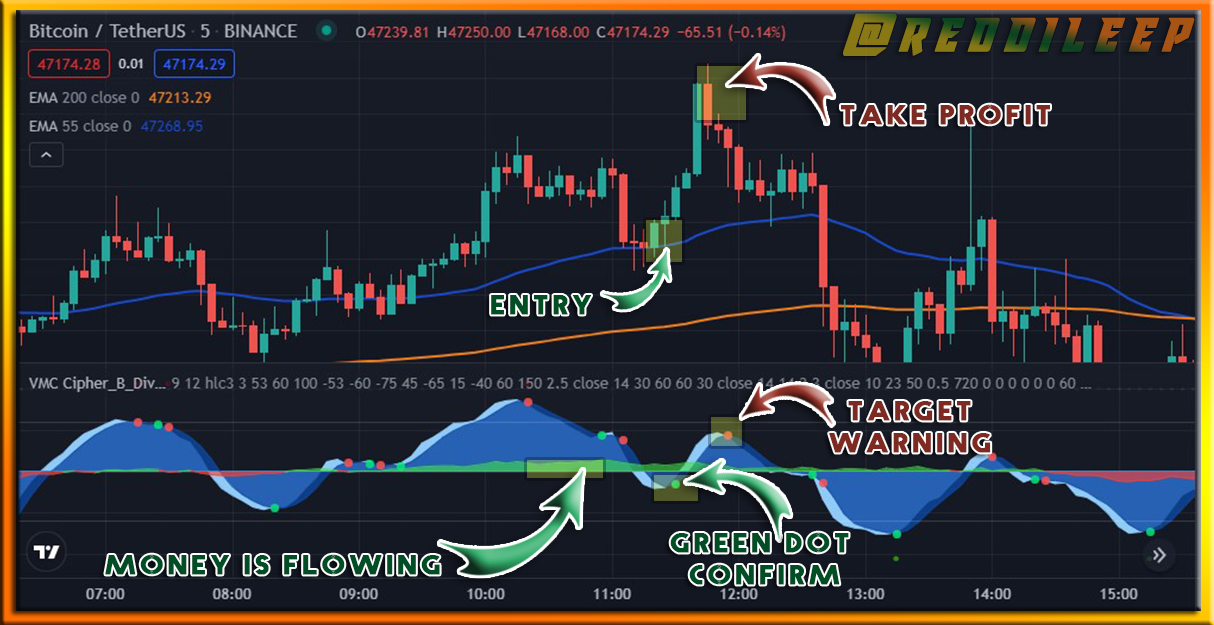
Screenshot was taken from https://www.tradingview.com/symbols/BTCUSDT/
This is the basic method for a long entry. In the same way, we can get a sell short entry using its reverse method. Here I will not repeat it as I have already discussed too many facts regarding VuManChu Cipher B.
In fact, this indicator is a good indicator that has a good winning rate. We can use it in different ways other than this basic method. There are many other advanced methods that we can use with this indicator. So today we are just going to practice this method. In the future, we will discuss another advanced strategy that can be combined with VuManChu Cipher B.

In my lesson, I have described only a summary of these topics and you should do better research and answer all the following questions in your own words. You are totally free to use any language. But when you mention something in the screenshots, you must use only English.
1- Define VuManChu Cipher B Indicator in your own words.
2- How to customize the VuManChu Cipher B Indicator according to our requirements? (Screenshots required)
3- Explain the appearance of the VuManChu Cipher B Indicator through screenshots. (You should Highlight each important part of this indicator by explaining their purpose)
4- Demonstrate your preparation for the Trading Strategy combining other indicators. (Instead of showing the addition of indicators to the chart, you should explain the purpose of each indicator for this trading strategy.)
5- Graphically explain how to use VuManChu Cipher B Indicator for Successful Trading. (Screenshots required)
6- Using the knowledge gained from previous lessons, do a better Technical Analysis combining this trading Strategy and make a real buy or sell order in a verified exchange. (You should demonstrate all the relevant details including entry point, exit point, resistance lines, support lines or any other trading pattern)

You must submit your Homework Posts in the Steemit Crypto Academy community.
You have to include all the details in your own words without including someone's words in your content. The concept can be the same but your content should be unique.
You must include at least 850 words in your homework posts.
Plagiarism is strictly prohibited in the whole Steemit platform and you will not receive any privileges.
All the screenshots and images should be fully referenced and the referenced images should be copyright-free. And also, include your user name as a watermark in every screenshot.
You should use tags #reddileep-s5week6 #cryptoacademy and your country tag among the first five tags. Furthermore, you can include relevant tags such as #crypto-trading, #vumanchu.
According to new rules changes, only people actively, and successfully, participating in #club5050 will be eligible to get rewards for the Steemit Crypto Academy homework tasks.
Your homework Title should be
[ Highly Profitable Trading Strategy with VuManChu Cipher B ]-Steemit Crypto Academy | S5W6 | Homework Post for @reddileepHomework task will run from Sunday 00:00 December 19th to Saturday 11:59 pm December 25th UTC Time.
If you have a reputation of 65 or above, and a minimum SP of 900, then you are eligible to partake in this Task. (You should not have any power-down history during the past 30 days and your effective SP should not be delegated-in SP). And also, if you have used any buying vote services to build your reputation, you will not be eligible to partake in this Task.
If you didn't receive the score for your homework post within 48 hours, you can put the link in the comment section. Otherwise, don't leave your post link here.
If you have any queries related to my lesson, you are totally free to ask anything in the comment section.
Cc:
Hello Professor. In question 4 we can use MA's or we have to use another new indicator?
Here you have to use EMAs. That's why I demonstrated the strategy using EMAs.
PLEASE HELP ME UPVOTE FOR A CAUSE
https://steemit.com/steemit/@jejes/steemit-help-typhoon-odette-survivors
ok... thanks for the clarification
Hi, @reddileep,
Thank you for your contribution to the Steem ecosystem.
Please consider voting for our witness, setting us as a proxy,
or delegate to @ecosynthesizer to earn 100% of the curation rewards!
3000SP | 4000SP | 5000SP | 10000SP | 100000SP
Professor @reddileep, for task no 6:
Exactly 👍