Crypto Academy Season 5 [ Advanced course ] Week 8 : Advanced Technical Analysis Using Fractals

Cover Image Created by Adobe PS
Hello Steemians!
First of all I would like to wish everyone a Happy New Year. In the Steemit Crypto Academy, we always try to present various and interesting lessons about the field of crypto. So, as I have taught very useful lessons in previous weeks, this week I have brought another very useful lesson. During the past week, we were able to discuss a lot of facts about a profitable indicator. So, today we will talk about one of the most useful tactics used in technical analysis.
Today our topic is "Advanced Technical Analysis Using Fractals" This is not just a Technique but can be used as a very successful trading strategy. In today's lesson, we will learn how to do that. So let's go straight to the lesson.


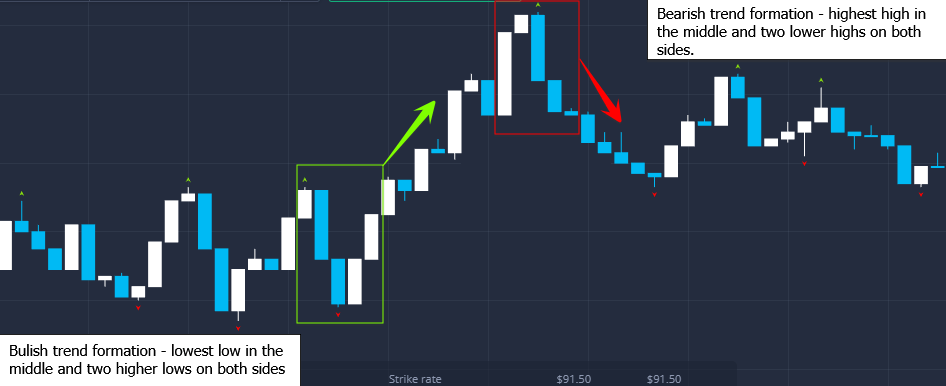
Image Source
Simply put, Fractals can be defined as repetitive patterns on a chart whether bullish or bearish. We really know that the crypto market is constantly changing unexpectedly. However, there are some special groups of people who compare these present obvious price movements with past data and speculate that the obvious patterns of the past will happen again. So a large number of traders believe that using these past data and clear past chart patterns to predict future price movements in the present is a somewhat successful method.
Furthermore, there are various indicators that can be used to easily identify such fractals. One of the most commonly used indicators is the Williams Fractal indicator. So the concept of a fractal is the basis for making this indicator. That is, the chart patterns that are repeated over and over in a chart are based there. But in this lesson, we will go beyond just one indicator and explain how to observe the chart with our own observation. We will discuss them further in the next subtopics.

Basically, there must be at least five bars or candles to accurately identify a fractal. This can be more than five and if the number of candles is less than five then its accuracy is very low or it cannot be considered a fractal.
There are basically two main categories of fractals that can be defined as bullish fractal or bearish fractal. So after comparing the relevant fractal with the existing trend, it should be ensured that such an event is going to happen again.
In order for a Bullish Fractal to occur, the candle in the middle of the fractal has the lowest low and the candles on either side have the higher lows. Let me explain it further using a simple illustration.
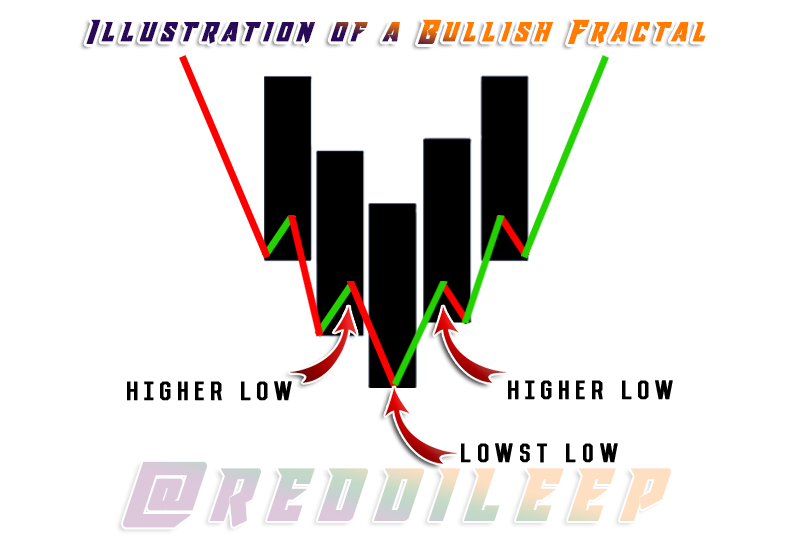
Illustration Created by Adobe PS
- In order for a Bearish Fractal to occur, the candle in the middle of the fractal has the highest high and the candles on either side have the lower highs. Let me explain it further too using a simple illustration.
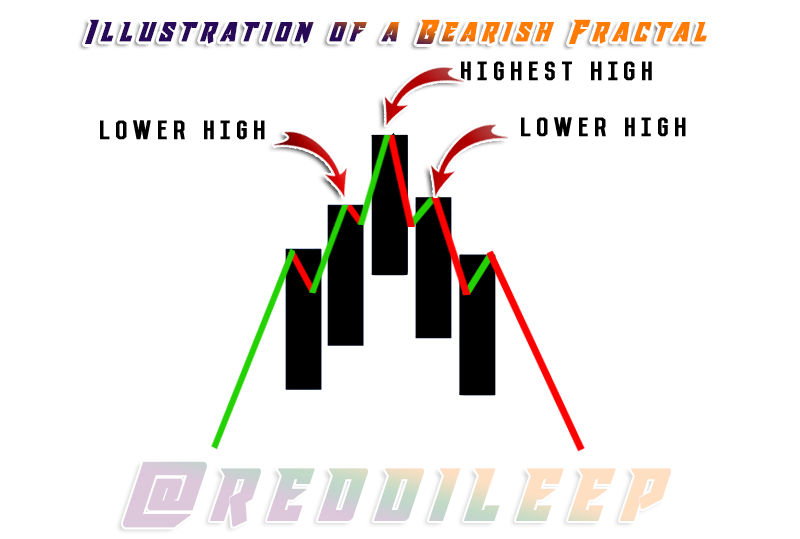
Illustration Created by Adobe PS

As I described earlier, Williams Fractal trading indicator is a famous indicator that we can use for identifying Fractals. However, in addition to that, there are some other Fractal related indicators such as The Fractal Indicator, Fractal Support Resistance, Fractor Breakout and many other customized versions.
So, here I will discuss a few things about Williams Fractals Indicator. In fact, we can get this indicator on the chart from any trading platform including TradingView. First of all, I will add this indicator to a crypto chart.
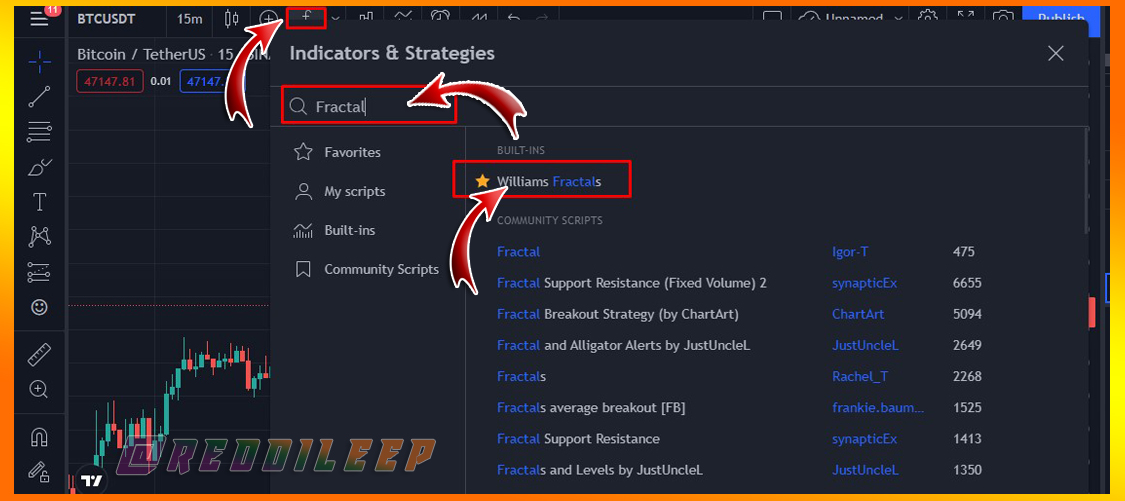
Screenshot was taken from https://www.tradingview.com/symbols/BTCUSDT/
We can easily add this indicator to any Crypto Chart by clicking on "Indicators & Strategies". However, I will not demonstrate basic steps as we have already discussed them in our previous lessons. So, after adding this indicator to our trading chart, it will appear like the below screenshot.
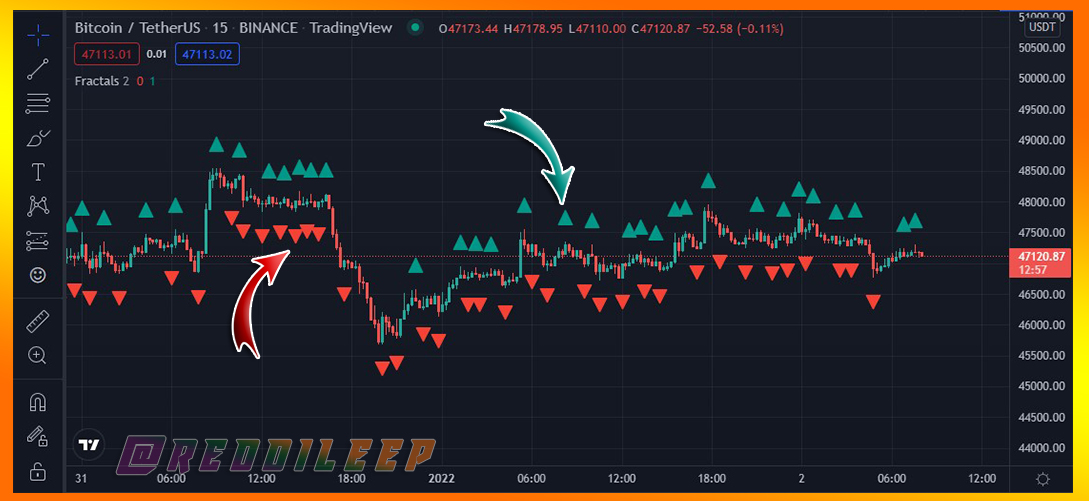
Screenshot was taken from https://www.tradingview.com/symbols/BTCUSDT/
If we look at the appearance of this indicator, we can see a lot of Green arrows and Red arrows in our trading chart. In fact, this indicator shows extreme points in the relevant Crypto Chart. It means this indicator helps us to identify reversal points in our chart by showing Up and Down arrows. Here the Green Up arrows can be defined as the Buy Fractal and the Red Down arrows can be defined as the sell arrow. In addition to this, there is a lot more information to discuss this indicator and we will talk about that later.

Here we can easily identify the fractals through the indicators mentioned above. However, as I said earlier, here I wanted to explore fractals from beyond just one indicator and explain how to observe the chart with our own observation. Let's do it.
Here we need to compare the chart with the past data as explained earlier. Here we have to check whether the chart pattern of the previous Bull Run or Bearish Run is similar to the present price chart. For example, the pattern on a long-term bitcoin uptrend price chart in the past can be used to find the trend reversal point in the current bitcoin uptrend movement. Let's explore it in the charts.
Here I will use the https://www.tradingview.com platform to demonstrate my steps with BTC/USDT currency pair.
When we look at the tool panel of the Tradingview platform, we can see a special tool to easily copy past these chart patterns. It can be defined as the "Bar Patterns" Tool.
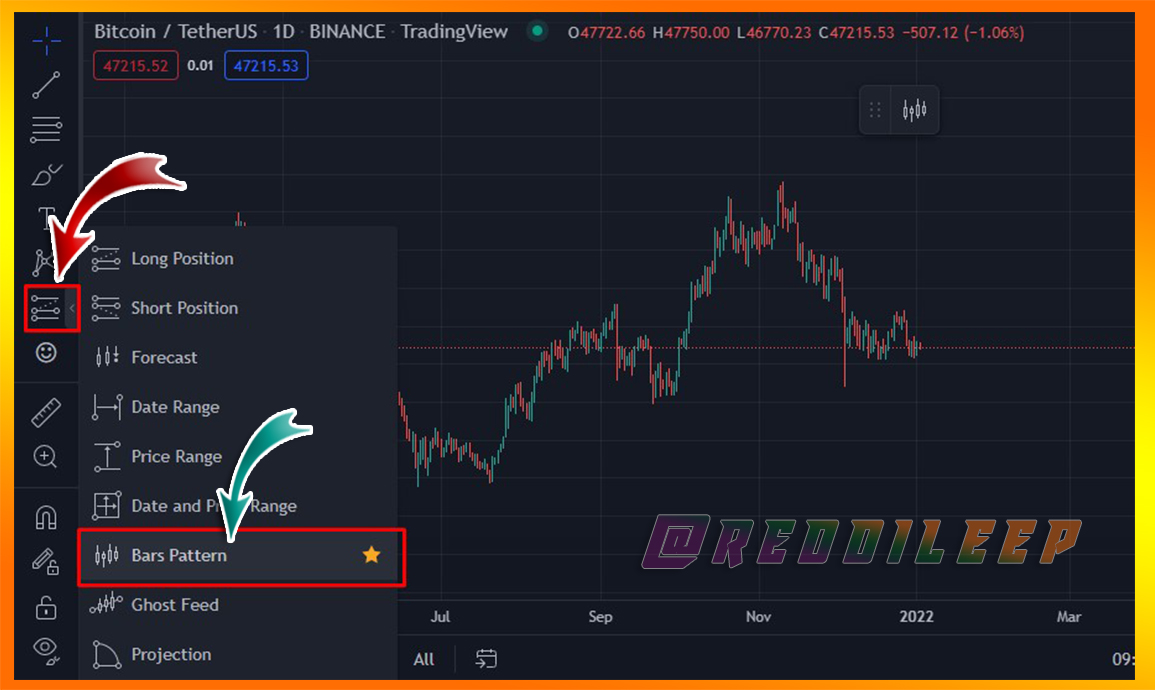
Screenshot was taken from https://www.tradingview.com/symbols/BTCUSDT/
First of all, we can select this Bar Patterns tool and draw a line from left to right at a desired past chart pattern.
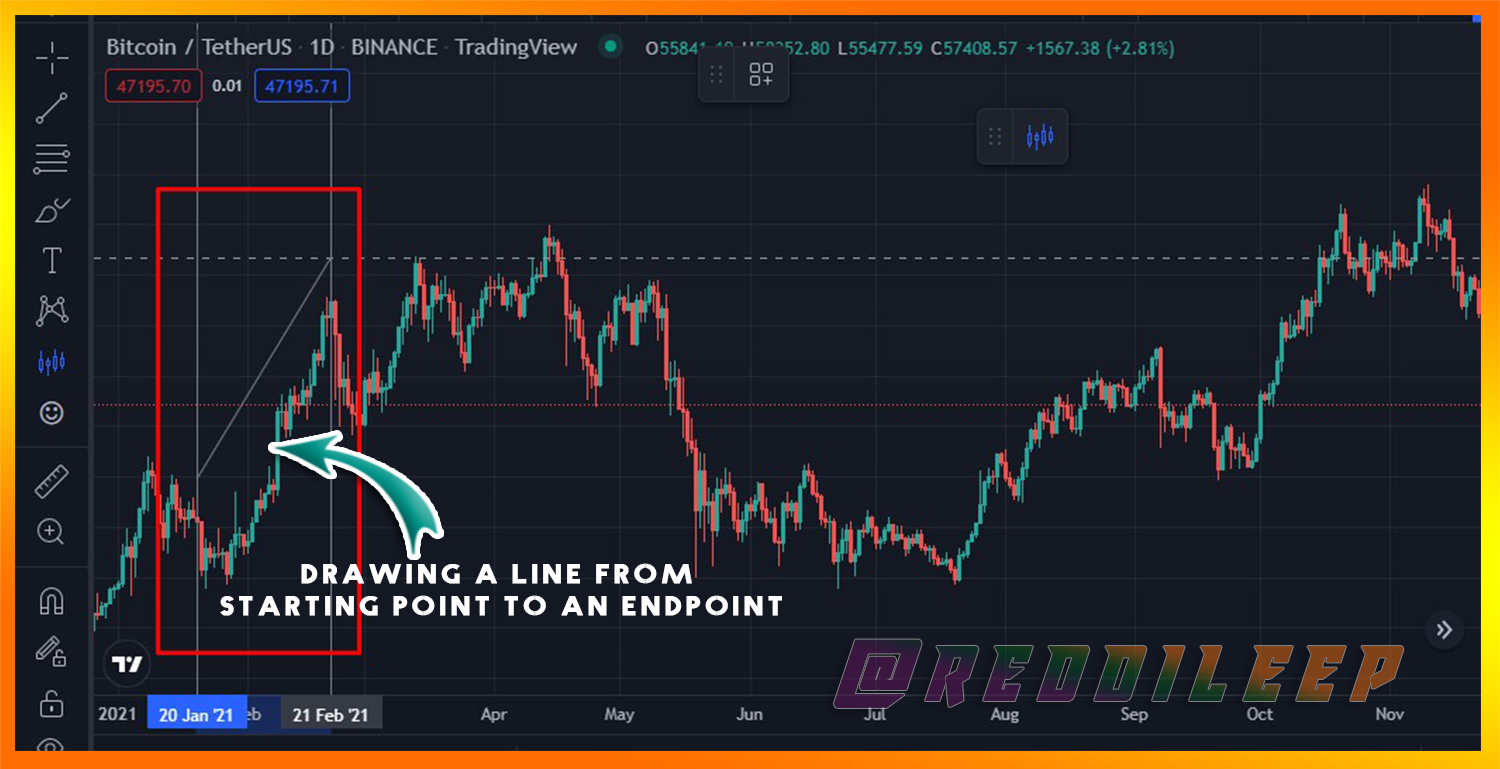
Screenshot was taken from https://www.tradingview.com/symbols/BTCUSDT/
Then the relevant chart pattern will be copy-pasted into a moveable chart pattern.
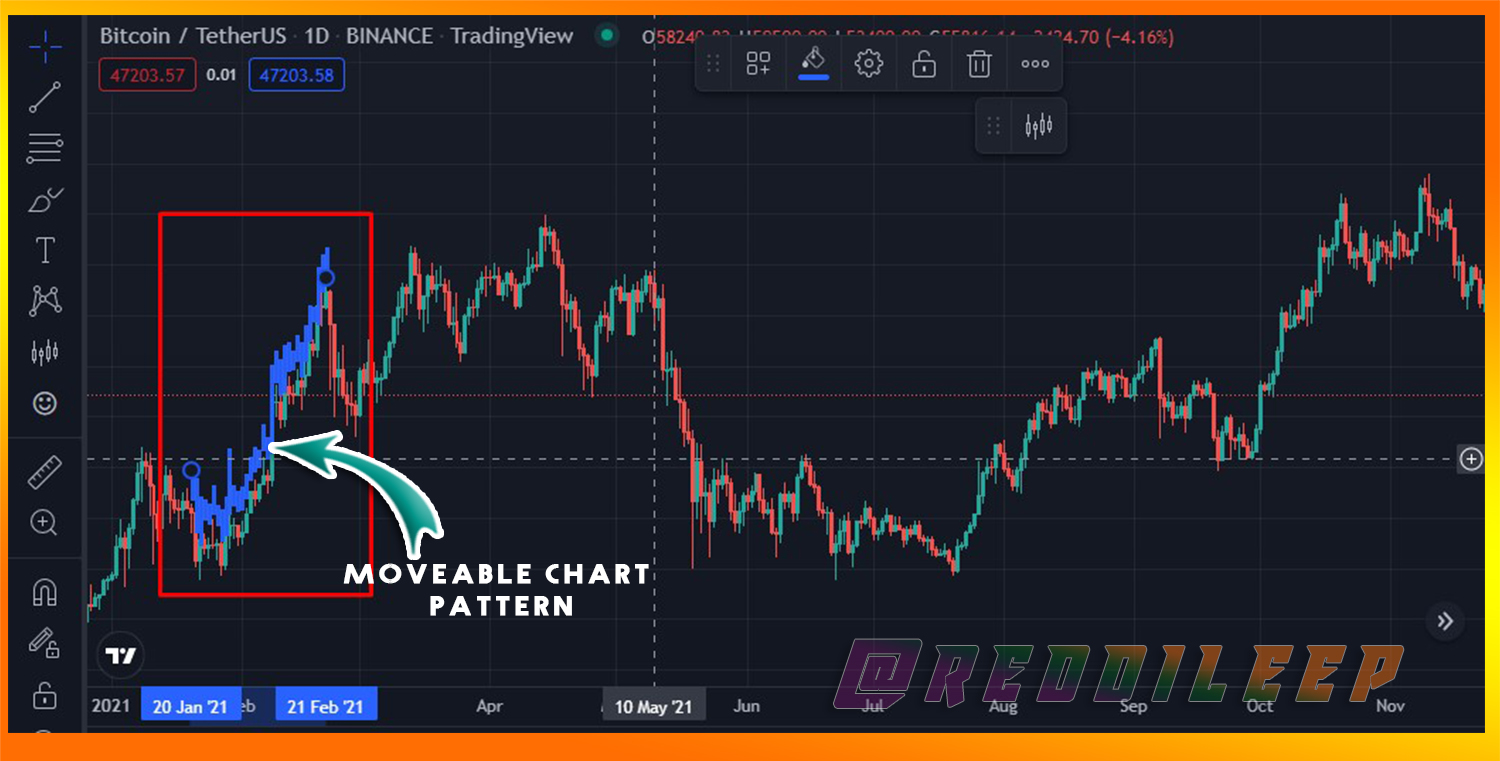
Screenshot was taken from https://www.tradingview.com/symbols/BTCUSDT/
After that, we can easily move that copy-pasted chart pattern into a present suitable point.
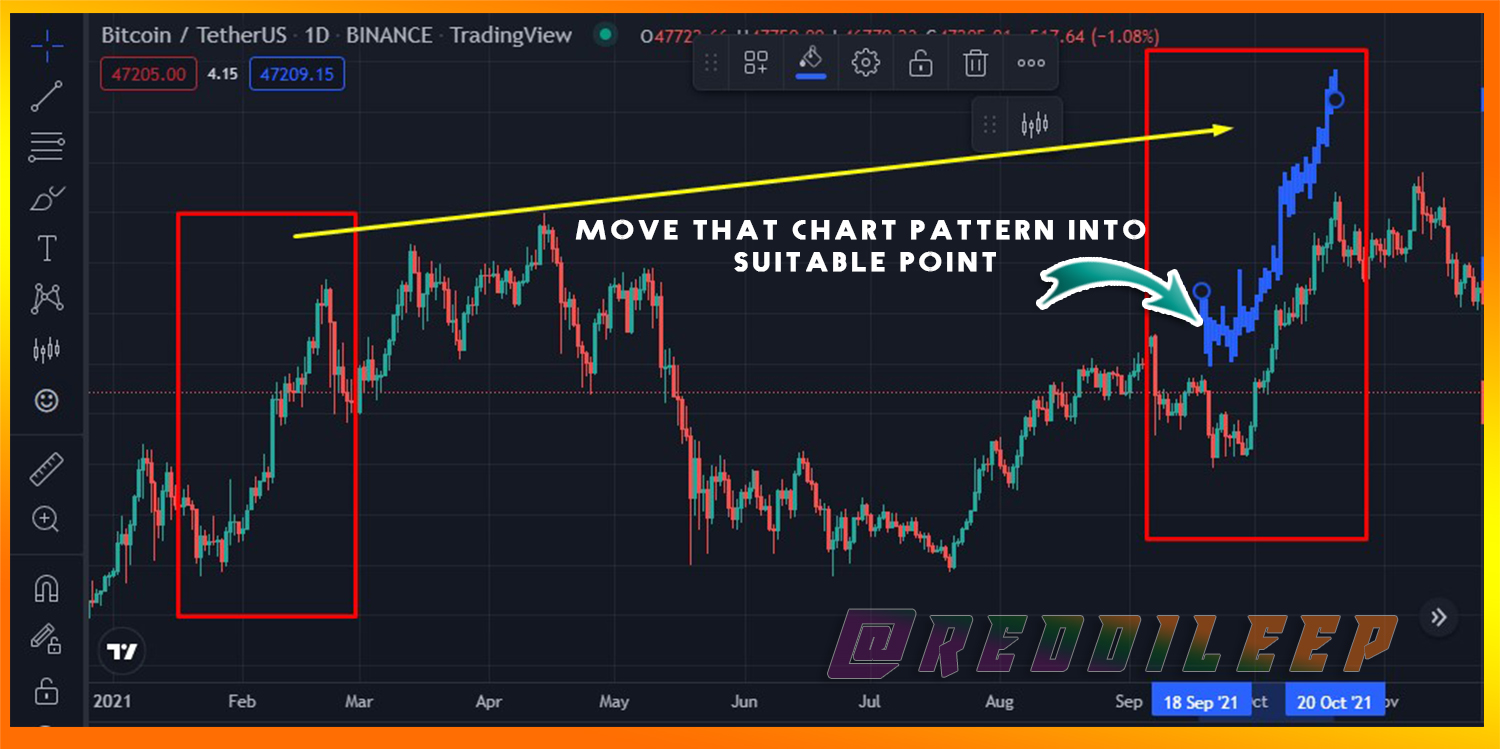
Screenshot was taken from https://www.tradingview.com/symbols/BTCUSDT/
Below we can see that the past price pattern is more than v. So, with the help of this, we can identify the reversal of the current trend without much effort.
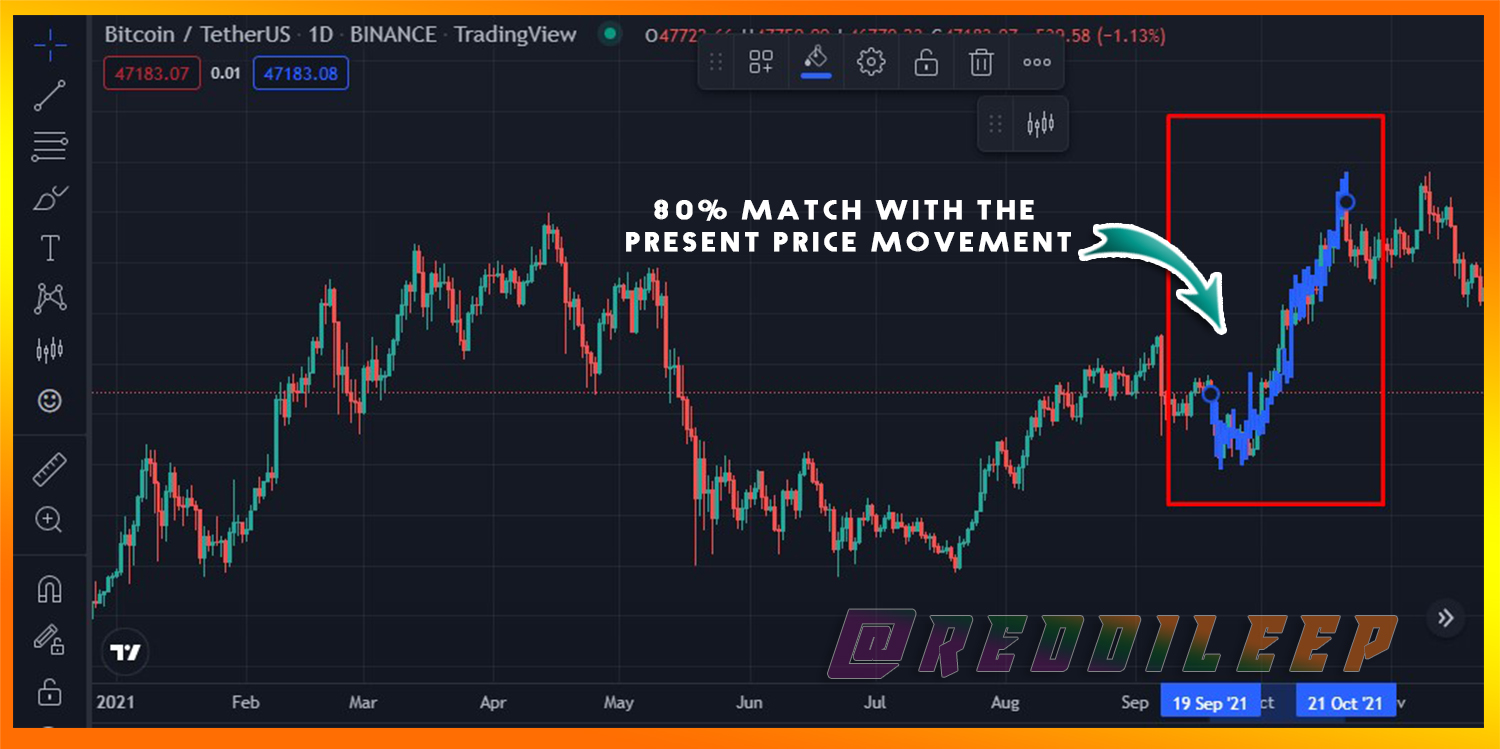
Screenshot was taken from https://www.tradingview.com/symbols/BTCUSDT/
Furthermore, in addition to this chart pattern, we can use any other indicators to confirm the relevant price movement or trend reversal such as Fibonacci Retracement Levels. At the same time, we must remember that this past data does not always match the current data and sometimes market markers are trying to make a huge profit with the help of these special zones. It means if the past price pattern is 100% matches with the current price movement then the next thing to happen is a price increase and market makers tends to change our predicted price chart. Because they can sell their assets at a great price as there is good buying liquidity in the market.

Here I decided to use 2 indicators in the price chart. That is the William Fractal Indicator and the Exponential Moving Average Indicator. However, we have to use 2 EMAs (20 Period and 50 Period) You can use any other suitable desired indicator with this William Fractal Indicator.
Below we can see the complete trading setup of my chart. Here I have changed the colour of each EMA.
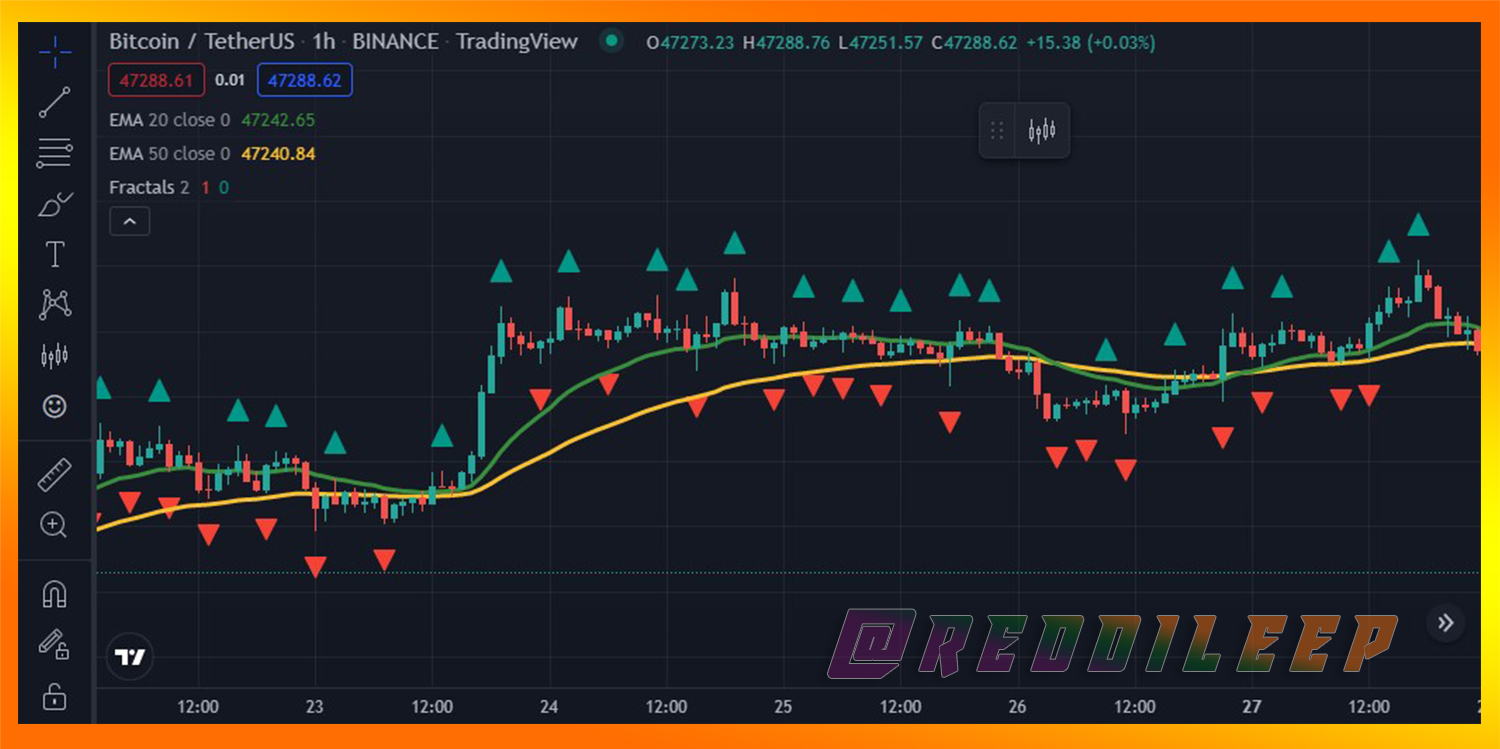
Screenshot was taken from https://www.tradingview.com/symbols/BTCUSDT/
Here, the red colour arrows of the William Fractal Indicator indicates the best time to buy assets, while the green colour indicates the best time to sell our assets. However, if it is confusing with the green and red arrows, we can easily change it through the indicator settings.
Furthermore, we should confirm that signal through the EMAs. That is, if we tend to place buy positions, the 20 period EMA should be higher than the 50 periods EMA. At the same time, if we tend to place sell positions, the 20 period EMA should be lower than the 50 periods EMA.
Finally, we can wait for a suitable entry point like the below screenshot. Here I have taken my entry point where the price movement got supported by 50 EMA and received signals to buy from Fractal Indicator.
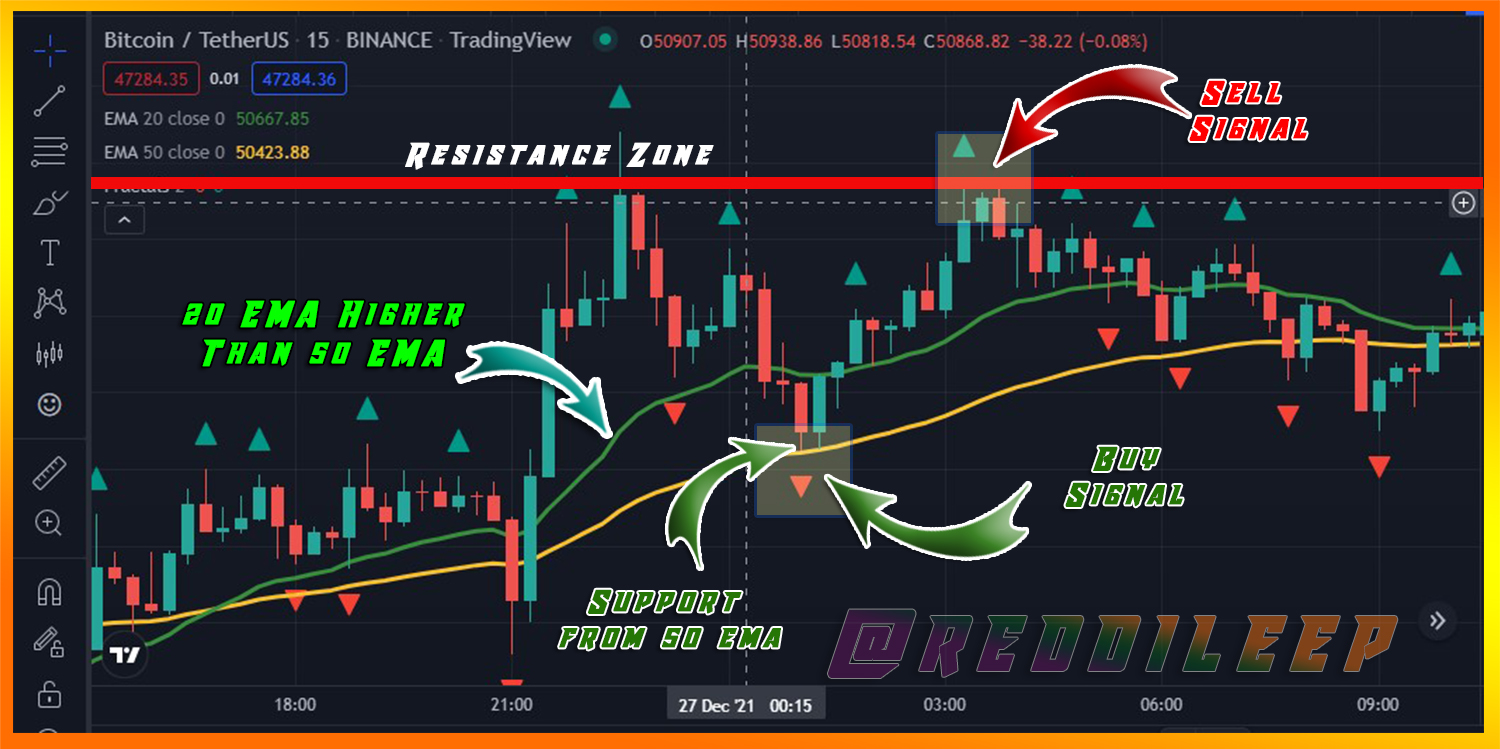
Screenshot was taken from https://www.tradingview.com/symbols/BTCUSDT/
Finally, I have sold my assets before the next suitable resistance zone and received signals to sell from Fractal Indicator. So, if we are able to analyze the above-mentioned facts properly, we have a higher possibility to win our trades.

In my lesson, I have described only a summary of these topics and you should do better research and answer all the following questions in your own words. You are totally free to use any language. But when you mention something in the screenshots, you must use only English.
1- Define Fractals in your own words.
2- Explain major rules for identifying fractals. (Screenshots required)
3- What are the different Indicators that we can use for identifying Fractals easily? (Screenshots required)
4- Graphically explore Fractals through charts. (Screenshots required)
5- Do a better Technical Analysis identifying Fractals and make a real purchase of a coin at a suitable entry point. Then sell that purchased coin before the next resistance line. Here you can use any other suitable indicator to find the correct entry point in addition to the fractal. (Usually, You should demonstrate all the relevant details including entry point, exit point, resistance lines, support lines or any other trading pattern)

You must submit your Homework Posts in the Steemit Crypto Academy community.
You have to include all the details in your own words without including someone's words in your content. The concept can be the same but your content should be unique.
You must include at least 800 words in your homework posts.
Plagiarism is strictly prohibited in the whole Steemit platform and you will not receive any privileges.
All the screenshots and images should be fully referenced and the referenced images should be copyright-free. And also, include your user name as a watermark in every screenshot.
You should use tags #reddileep-s5week8 #cryptoacademy and your country tag among the first five tags. Furthermore, you can include relevant tags such as #fractals-trading, #williams-fractals.
According to new rules changes, only people actively, and successfully, participating in #club5050 will be eligible to get rewards for the Steemit Crypto Academy homework tasks.
Your homework Title should be
[ Advanced Technical Analysis Using Fractals ]-Steemit Crypto Academy | S5W8 | Homework Post for @reddileepHomework task will run from Sunday 00:00 December 2nd to Saturday 11:59 pm January 8th UTC Time.
If you have a reputation of 65 or above, and a minimum SP of 900, then you are eligible to partake in this Task. (You should not have any power-down history during the past 30 days and your effective SP should not be delegated-in SP). And also, if you have used any buying vote services to build your reputation, you will not be eligible to partake in this Task.
If you didn't receive the score for your homework post within 48 hours, you can put the link in the comment section. Otherwise, don't leave your post link here.
If you have any queries related to my lesson, you are totally free to ask anything in the comment section.
Cc:
Congratulations @reddileep
This is the most positive post amongst

top 100hot posts on steemit at this moment.@reddileep please your support 😊🙏🏻🙏🏻
First of all, follow all the Achievement Tasks in the Newcomers community.
Happy new year prof.
Wish you the same mate
This is a very good strategy to apply. I wish i have reach this stage.
I hope you reach this stage soon. Wish you all the best mate.
Ok thanks