Crypto Academy Season 6 Week 4 - Psychology of Trends Cycle.

Firstly, I want to sincerely apologize to my students who joined my team in the last trading competition and were disqualified due to some reasons. I value your time and effort in performing those tasks and I'm sorry for any inconvenience that might have caused.
The topic for today is Psychology of Trend Cycles. As a trader, the first thing you try to understand is the state of the market. Is the market trending or ranging? Once you have figured that out, only then can you look for a trading setup in the direction of the trend. You can't be looking for a bearish setup during an uptrend. Not understanding if price is bullish or bearish can be catastrophic as this leads a trader to open a position against the direction of the market.
The market trends are due to forces of demand and supply on an asset. When both demand and supply are in equilibrium, we tend to see the market in no direction. Also, when demand exceeds supply, we tend to see price breakout to the upside for an uptrend. Furthermore, when supply is greater than demand, price is seen declining.
This study will explain the psychology behind trend cycles. This will help you to understand the current state of the market and also not fall for price manipulation by the big players. Understanding trend cycles will also give you an idea to understand when a trend is weak for you to take profits off your position.

Dows Theory of Trends
The Dow theory of trends was developed by Charles H. Dow in the year 1897. Dow observed that the market is either in an uptrend or in a downtrend. The Dow theory is one of the early forms of technical analysis that is still useful in the market today. Dow believed that every market activity ranging from economic news, supply and demand, etc are discounted price. Analyzing the price will help to predict and understand the direction of the market.
We will be looking at the three states of price and also the psychology behind these states of the market (Accumulation and Distribution). We will also be explaining the relationship between volume and price.
Accumulation and Distribution Phase of the Market
Market trends in cycles can either be a downtrend or an uptrend. This is similar to the bull and bear season we have in the crypto market. Price continues in an uptrend for a while and after some time, price reverses to the opposite direction and we assume that we have entered the bear season. The goal of every trader is to make a profit as the market cycles. A buy position is opened at the beginning of an uptrend. Once this asset is seen to be overpriced in the market, traders start taking profits off the market to open a sell position. This cycle keeps repeating in the market. In this section, we will be discussing the accumulation phase for a potential uptrend and also the distribution phase in the market.
Accumulation Phase
The big players are responsible for manipulating price. The retail traders are just following the market whichever way it is pushed to. During a downtrend when there's high selling in the price of an asset, we tend to see more selling pressures in the market as retail traders FOMO in to open a sell position. At this point, the big players start taking profits off the market by closing their positions. Due to the volume of their positions, price slows down as they start grabbing liquidity to open bullish positions.
A bullish advancement is seen in the market. Retail traders panic to close their sell position at a loss to take advantage of the buying opportunity. More volume is injected into the market as more buyers are attracted to the asset. This leads to a reversal and breakout of the uptrend.
An example is shown below.
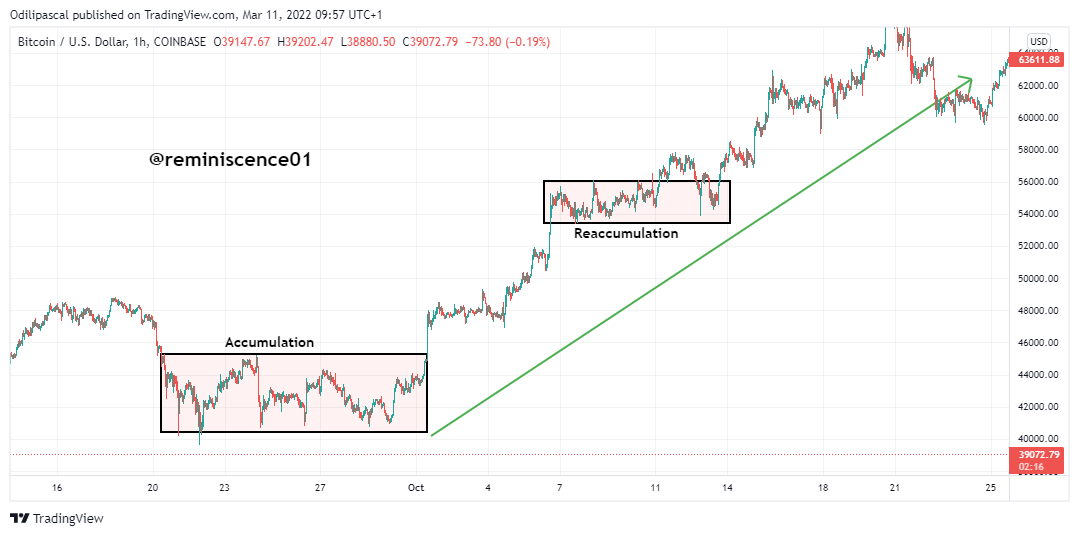
After price has broken out of the accumulation zone, price trends for a while as more buying interest enters the market. At some points, the big investors who entered the market at an early take some profit off the market and this slows price down. We tend to see a minor retracement as price creates a low point. This is known as the reaccumulation phase which allows traders to buy at a lower price. Most traders might confuse the reaccumulation phase as a trend reversal or the distribution phase.
Image Source: Tradingview.com
The bullish trend is invalidated only when price breaks below the low point of the reaccumulation phase. A break above the reaccumulation phase is seen as a trend continuation as shown above.
Distribution Phase
This distribution phase is encountered when the big players who bought the assets at the accumulation phase start taking profits by closing their buy positions. Price is seen to slow down due to the volume of their positions. Retail traders panic about this sluggish movement and start closing their positions at a loss. This creates a sideways movement before more sellers enter the market push price down.
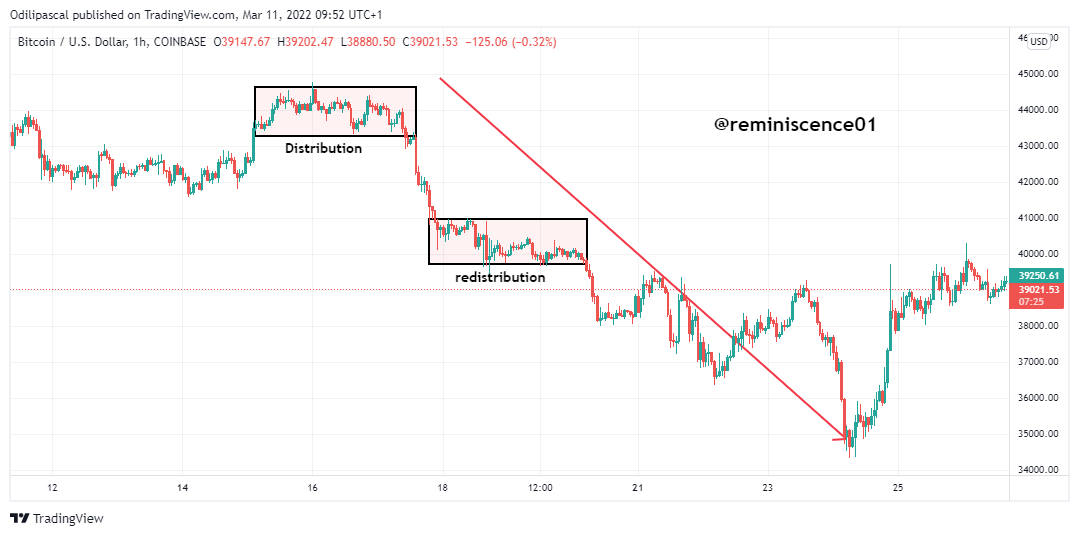
Image Source: Tradingview.com
During the downtrend, price slows down and retraces to create a high point. This is known as a redistribution phase caused by partial profit-taking. At this point, traders are allowed to open more selling positions for price continuation.
The redistribution must not be confused with a trend reversal or accumulation phase. This is another pattern retail traders are manipulated to think that the bearish trend is weak. A trend reversal can only be confirmed when price breaks above the high of the redistribution phase.
It is important to understand these phases of the market and know when to enter and exit your positions. So many retail traders counter-trend the market because they failed to understand how the big players are moving money in the market. The truth is that you can't know exactly what the big players are doing or when they are opening their positions. But having a basic understanding of the trend cycle will help you avoid fakeouts and price manipulations.
Identifying Bullish, Bearish and Sideways Market
In the previous section, we have discussed the accumulation phase for an uptrend and also the distribution phase for a downtrend. It is important to understand the trend and also when a trend is losing momentum. Though there are several techniques to identify trends in the market. This can be with the use of market structure, trend lines, and indicators. Indicators are not recommended as they lag behind price. The market moved before an indicator will signal the movement.
Market structure is best for identifying the current phase of the market while the indicators can serve as confirmation tools. We have discussed market structure extensively in the previous lesson.
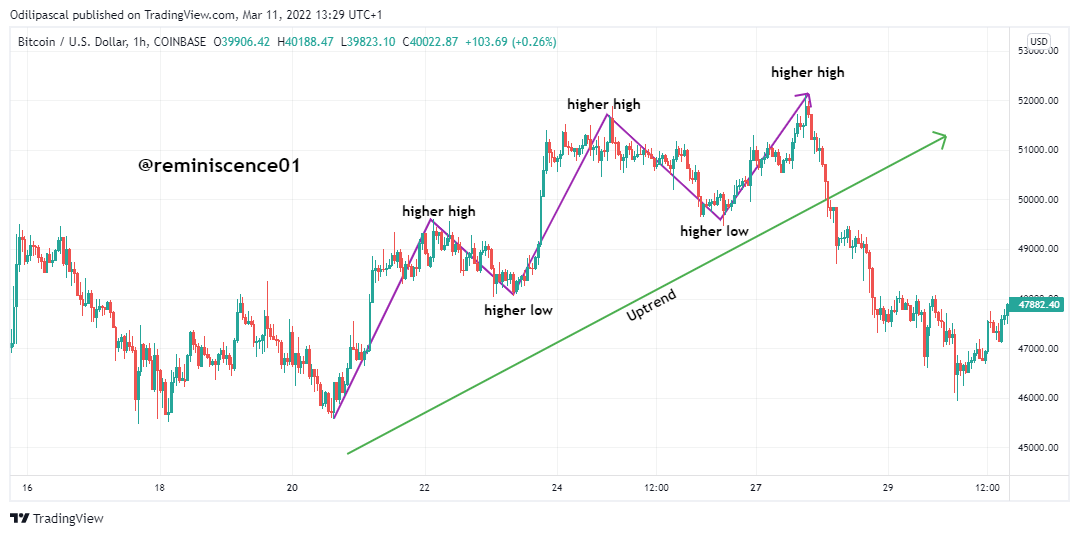
For an uptrend, the market is seen making higher highs and higher lows. When the market is in an uptrend, it shows high demand in the market and also control of the market by the buyers. An example of an uptrend is shown below.
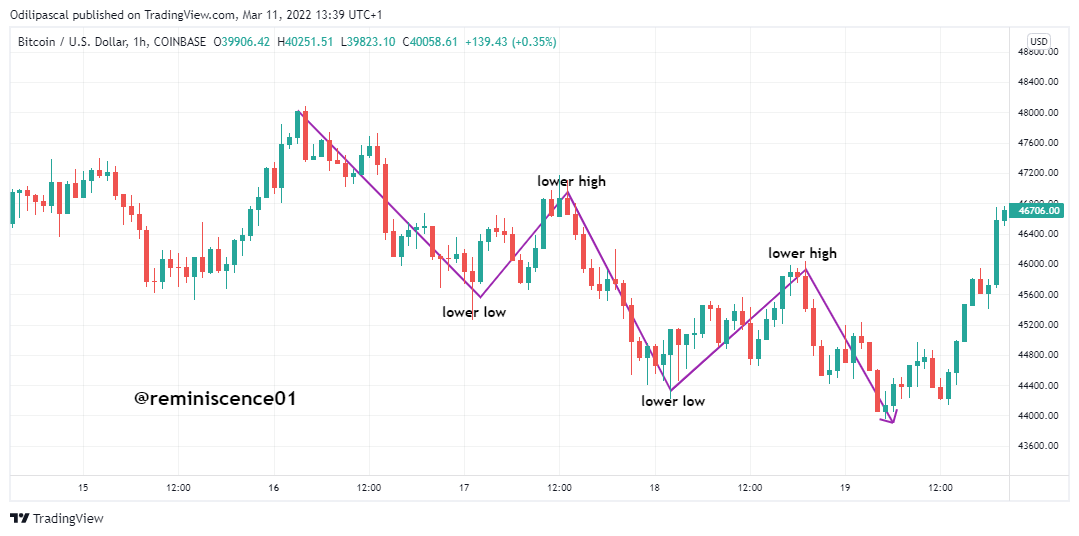
For a downtrend, the market is seen declining with a formation of lower highs and lower lows. The downtrend shows high supply and control of price by the sellers. An example is seen in the chart below.
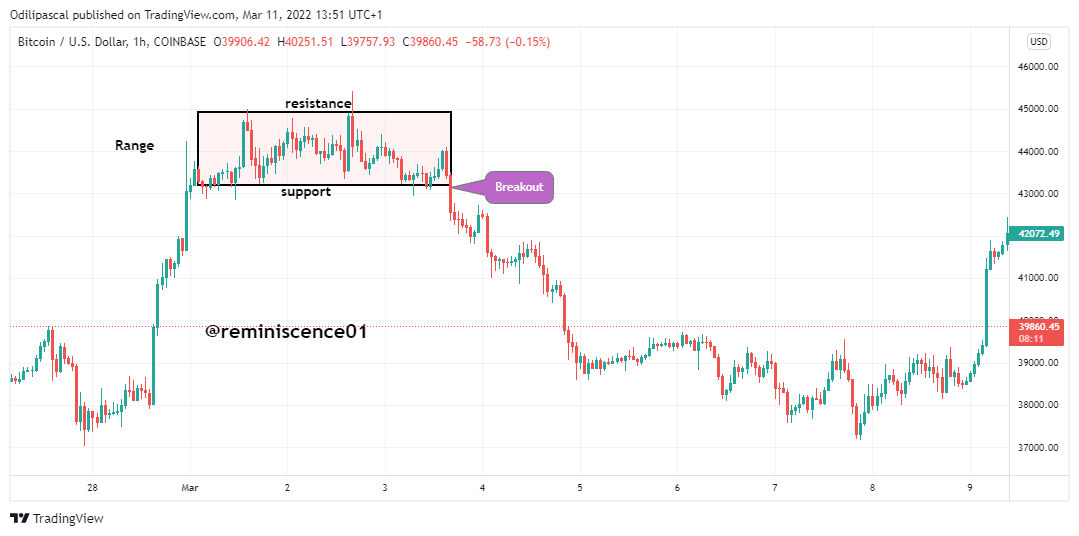
During the accumulation and distribution phase, the market is said to be in a range bouncing off support and resistance levels. This shows equilibrium between supply and demand as the market gather momentum for a new trend. The sideways market cab occurs at the end of a trend or in the middle of a trend. The direction of breakout determines if price is reversing or in continuation of the original trend. An example of the sideways market is shown below.
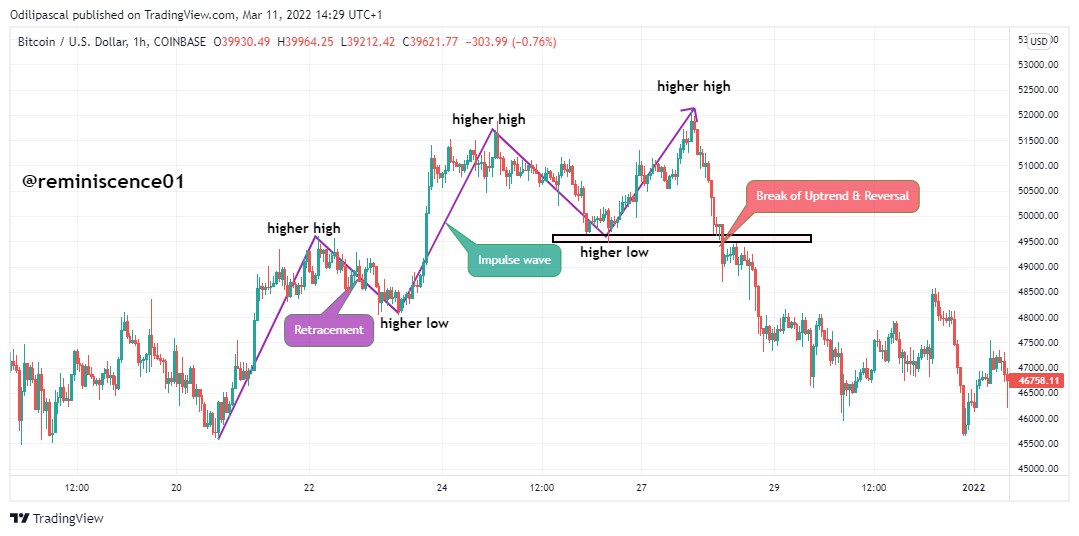
We have two types of trends as the market is trending. We have the impulse trend which is in the direction of the main trend. Also, we have the retracement trend which is in the opposite direction of the main trend. The corrective wave shouldn't be mistaken for a trend reversal. It is as a result of profit taken and an opportunity to enter the market again. Trend reversal can only be confirmed when the correction trend breaks the previous low as shown on the chart below. This is only known as a break of market structure which is a trend reversal signal.
Relationship between Volume and Trend
Every factor that affects an asset is discounted on price. The forces of demand and supply are seen on the chart. Volume has a direct relation with the market phase. When the market is in the distribution and accumulation phase, there is low volatility as the market is ranging. This low volatility can be seen on the volume indicator. We tend to see the volume flat which supports the current state of the market.
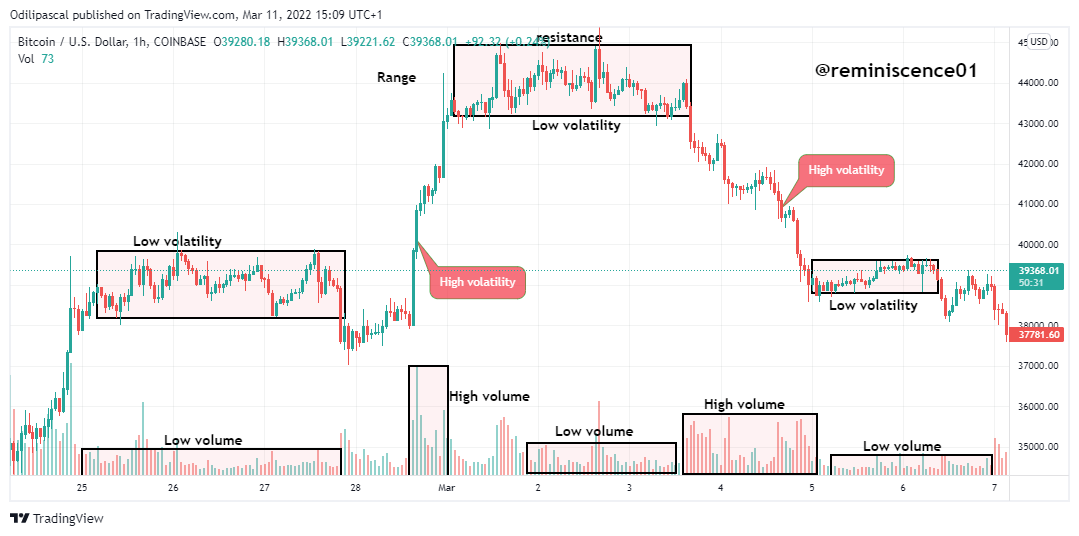
During an uptrend, when there's high volatility in the market, there's an increasing volume that supports the breakout of a new uptrend. Also, during a downtrend when there's high volatility and buying pressure, there is an increasing volume shoeing that more selling interest is in the market.
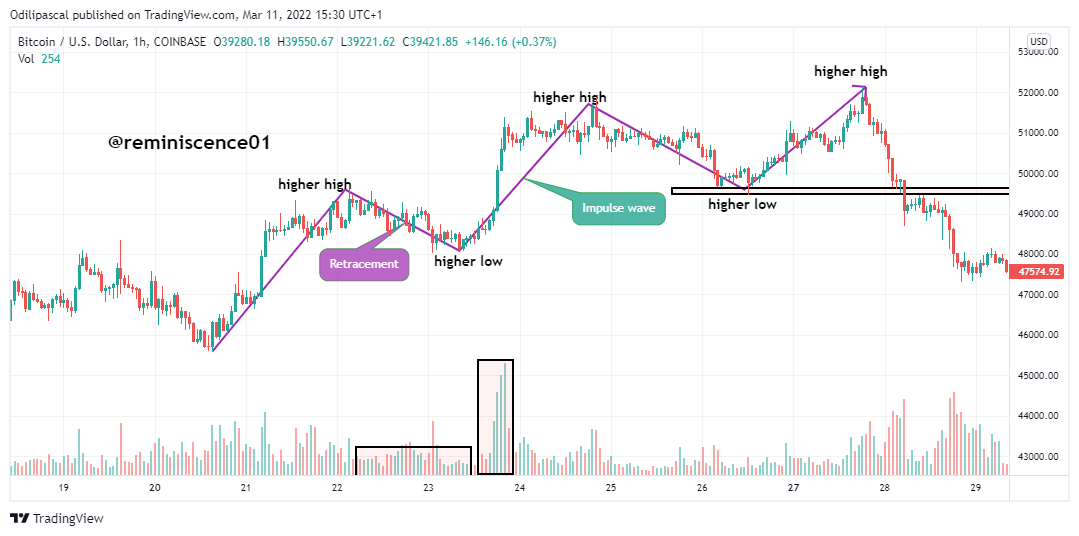
From the chart above, we can see that during the retracement trend, the volume is seen to be flat which shows that there's no bearish momentum to support the retracement trend. We can also notice that after the retracement trend, the impulse trend is supported with an increasing volume for price to continue its original trend. The volume is an important indicator that can be utilized to support the trend signals.
Trade Criteria and Risk management for the Three Phases of the market
In this section, we will be looking at some trade criteria for the Bullish, Bearish and Sideways market. Here, we will understand strategic positions to place our entries and exits.
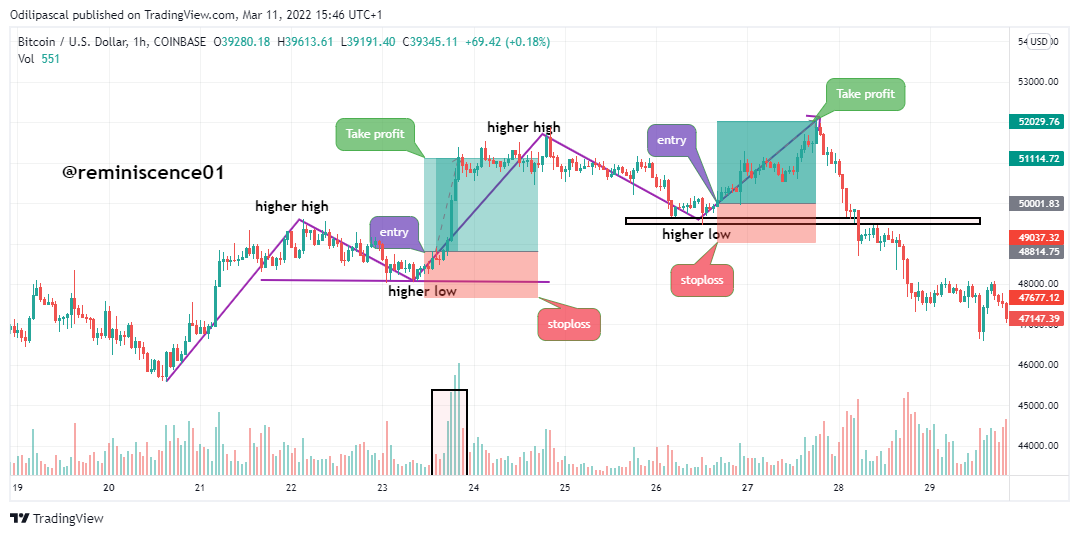
Bullish Trend
We have already explained the movement and how to identify it on the chart using market structure. The following should be noted before placing an entry.
- Ensure that price is in an uptrend creating higher highs and higher lows. This bullish formation must be supported with an increasing volume.
- Wait for price to make the retracement trend forming a low point. Upon reversal to the original trend, execute a buy position on the formation of a bullish candlestick pattern. This can be a bullish engulfing pattern or any other pattern.
- Stoploss for this position is placed below the recent low point of the retracement trend with a 1:1 or 1:2 risk-reward ratio.
This can be further illustrated on the chart below.
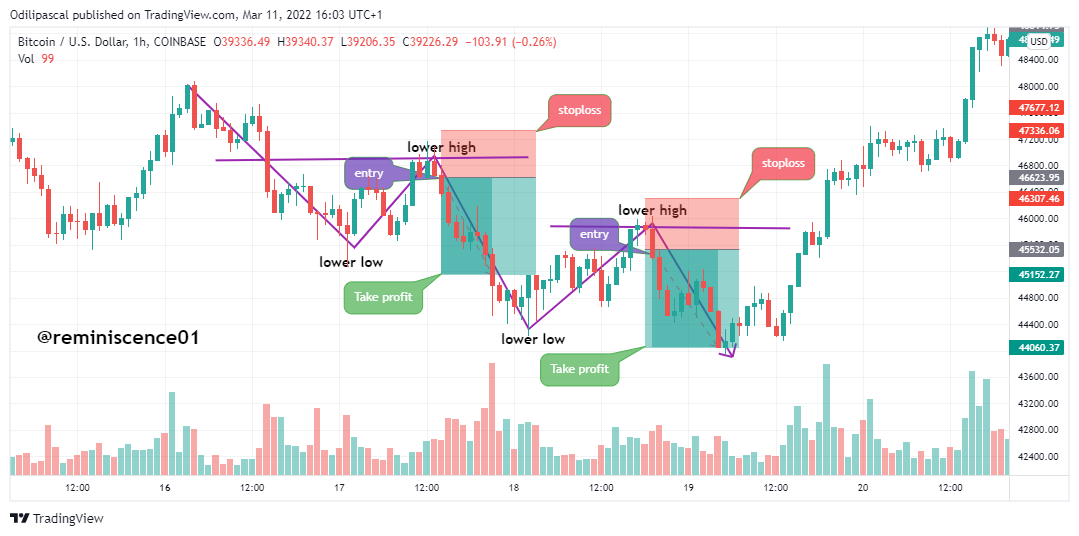
Bearish Trend
- For a bearish trend, ensure that price is creating lower highs and lower lows which is supported by an increasing volume.
- Wait for price to create the retracement trend forming a high point. Upon reversal to the original bearish trend, execute a sell position on the formation of a bearish candlestick pattern. This can be a bearish engulfing pattern or another pattern.
This can be illustrated on the chart below.
Sideways Market
Trading the sideways market is very risky. I often advise traders to stay off the sideways market. Price manipulation often occurs during the sideways market and breakout can occur in any direction. If you will be trading the sideways market, ensure you trade with proper risk management.
Trading the sideways is pretty simple. Open a sell position at the resistance with stoploss placed above the resistance. Profit target will be at the support of the range. Similarly, open a buy position at the support level with stoploss placed below the support of the range. Take profit for this position is placed at the resistance level.
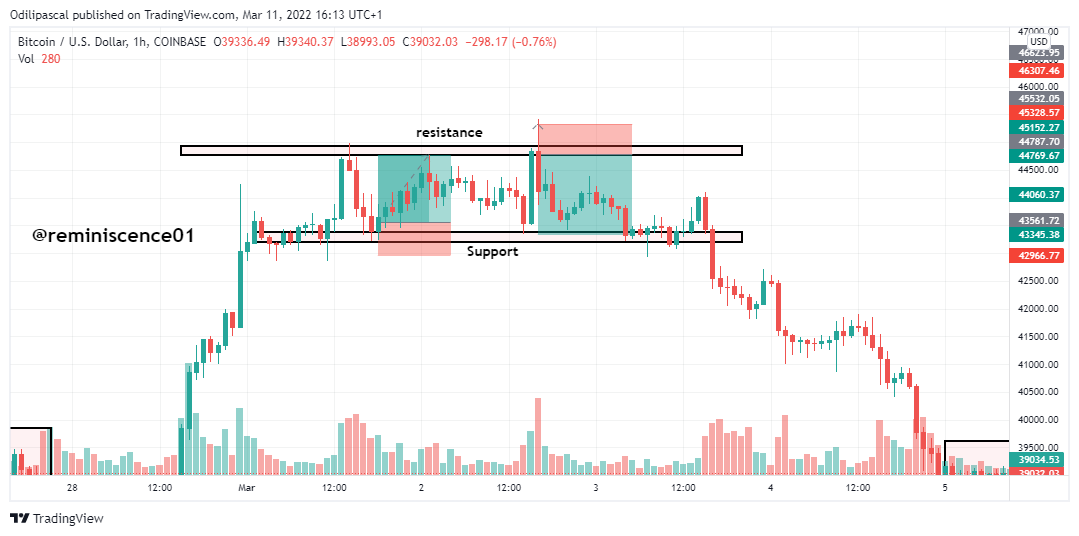
Do not just open a position or place a pending order at the levels. Ensure that bullish and bearish reversal patterns are formed at these levels before taking an entry. You can take advantage of the sideways market until price breaks out of the range.
Conclusion
Understanding trends and the psychology behind their formation is the first step in making an effective trading decision. Trading is simple when you understand price movements and how also how retail traders are being trapped in fakeouts.
In this study, we have discussed the market cycles, trends, and how to identify them on the chart. We have also discussed the entry criteria in capitalizing on the three phases of the market. Note that this study is a guide to help you develop your trading strategy.
Also, I always recommend confluence trading for the best trading experience. Other technical analysis like the indicators chart patterns, support, and resistance can serve as confirmation tools in trading the trends in the market. Finally, do not open any trading position without the use of stoploss. Trading cryptocurrency is risky due to the highly volatile nature of the market. Always protect your trading capital.
Thank you for taking part in this lesson.
Homework Task
- Explain your Understanding of the Dow Jones Theory. Do you think Dow Jones Theory is Important in technical analysis?
- In your own words, explain the psychology behind the Accumulation and Distribution phases of the market. (Screenshots required).
- Explain the 3 phases of the market and how they can be identified on the chart.
- Explain the importance of the Volume indicator. How does volume confirm a trend? Do this for the 3 phases of the market (Screenshots required).
- Explain the trade criteria for the three phases of the market. (show screenshots)
- With the Trade criteria discussed in the previous question, open a demo trade for both Buy/ Sell positions.
- Conclusion.
(Do not manually close your Positions. Hold your positions to either hit the Take profit or Stoploss and shows screenshots of trade result. This exercise is strictly on a demo account.)
Homework Guidelines
- Homework must be posted in the Steemit Crypto Academy community. Your homework title format should be "[Your Title] - Crypto Academy / S6W4- Homework Post for @reminiscence01".
- Plagiarism is a great offense in Steemit Crypto Academy and it won’t be tolerated. Ensure you refrain from any form of plagiarism.
- Your post should not contain less than 400 words.
- All images, graphs, and screenshots from external sources should be fully referenced, and ensure to use watermark with your username on your screenshots.
- Use the tag #reminiscence01-s6week4, #cryptoacademy, #club5050, #club75, #club100 if eligible and your country tag among the first five tags. Also include other relevant tags like #trends, #trading #cryptocurrency.
- Only users who meet the requirements for #club5050 are eligible to participate in this homework task.
- Homework task run from Sunday 00:00 March 13th, 2022 to Saturday 11:59 pm March 19th, 2022 UTC Time.
- Only users with a minimum of 450 SP and having a minimum reputation of 60 are eligible to perform this homework. Also, note that you must not be powered down.
- Users who have used upvote tools to gain SP or build their reputation are not eligible for this homework.
Note: You can only drop your homework link in the comment section if not reviewed after 48 hours.
The comment section is freely opened for suggestions and feedback on the lesson and homework.
Cc: @steemitblog
Thank you this #education so much to learn about Crypto and trading. Upvote and resteemed.
🙏🏽👍🏽
Impressive explanation dear professor. I will surely make my assignment soon.
What a wonderful lecture but so sad I am not eligible 😢 as though my rep is not up to 60.
but just like you advised, I am still working hard without relenting to get to rep 60
You are almost there brother.
Hello @reminiscence01, thanks for the lecture.
I'd like to ask, how many demo trades are we required to do in total?
From the questions, you said three market phases and to open buy and sell positions. Are we opening buy and sell positions for each of the market phases?
Two demo trades. For buy and sell positions.
Ok. Thanks.
Hello professor @reminiscence01…🙏🏾…please rate my work.
https://steemit.com/hive-108451/@ngongha/psychology-of-trends-cycle-crypto-academy-s6w4-homework-post-for-professor-reminiscence01
What happened? Why am I seeing this now?
🥺🙏🏾
I don’t understand prof but the error should be from my end!
Alright. It will be reviewed.
Thank you professor.
Professor thanks for this wonderful lecture. I will be presenting my solution soon.
Hello @reminiscence01 , your post have been supported using @steemcurator07 account.
Thank you for this wonderful lecture sir... You will soon see my home work report sir
Hello Professor @reminiscence01
Over 48 hours 🌝
https://steemit.com/hive-108451/@santosbass2/center-sup-screenshot-from-binance-binance-com-sup-center
What is the problem?
It’s okay. Thank you...