Rate of Change Indicator - Crypto Academy S4/W8 -Homework Post for Professor @kouba01


Hello Steemians, I welcome you all to another great week in the Steemit Crypto Academy. Cryptocurrency trading is a highly volatile market any trader might avoid messing with. Proper technical analysis and fundamental analysis is required to make the best trading decision in the crypto market. There are a lot of technical analysis tools available to help traders take advantage and make the right trading decision.
In the lesson given by professor @kouba01, we have studied ROC technical indicator as a promising indicator to help traders identify potential market trends, breakouts, trend continuations, and reversals, etc. Professor @kouba01 has done great in giving a detailed explanation on the ROC indicator and it is my interest to participate in the homework task.
Explaining ROC Indicator and How to Calculate its Value
Every indicator has a major role it plays and understanding this role helps a trader to get good information about the market. ROC indicator is a momentum-based indicator that is used to identify overbought and oversold regions of price, change in current trends, and also a continuation of a trend by taking into account the percentage change of a crypto asset over time.
The ROC indicator is plotted on the graph with an oscillator traveling above and below the zero line as the ROC changes. This movement of the oscillator above and below the zero line is a trading signal that can be used to interpret and predict the future prices of an asset.
ROC Calculation
Every indicator is derived from a mathematical model and presented graphically for easy interpretation. However, knowing the parameters employed in the mathematical model of a certain indicator is necessary to easily understand the signal the indicator is giving out.
ROC indicator is calculated mathematically as a percentage price change. This can be calculated using the formula:
ROC = (Current price - Closing price of N period back) / (The closing price of N period back ) × 100
Current Price: This represents the current closing price of an asset.
The closing price of N period back: This represents the closing price of an asset dated N period back.
For example, the current closing price of an asset is $100. 24 periods back it was worth $85. The ROC of the asset can be determined below:
ROC = ($100-65) / (65) × 100
ROC = 53.8%
From the calculation, we can observe the percentage price change on the asset which shows a positive result indicating an upward movement or buying pressure on the asset.
An important parameter for the ROC calculation is the "N" period. This helps to determine the sensitivity and how quickly the indicator reacts to price changes. Selecting the "N" period depends on your trading style. A swing trader might consider using a 24 - 50 period for the smooth signal from the indicator. Meanwhile, a scalper or day trader can consider 7-9 periods to get the most recent price changes on an asset.
Adding ROC indicator on Liteforex Trading platform
In this section, I will be explaining how to add the ROC indicator on liteforex trading platform. The following steps can be followed:
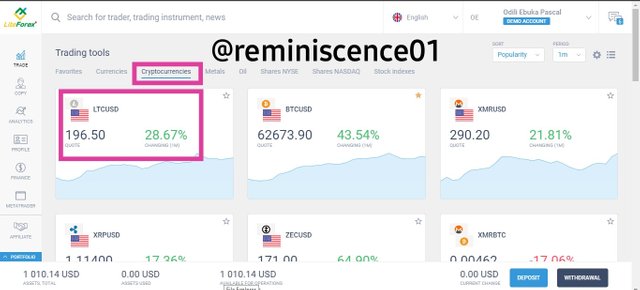
Login to liteforex website and click on any crypto asset to be directed to the chatting platform. In this case, I will click on LTC/USD.
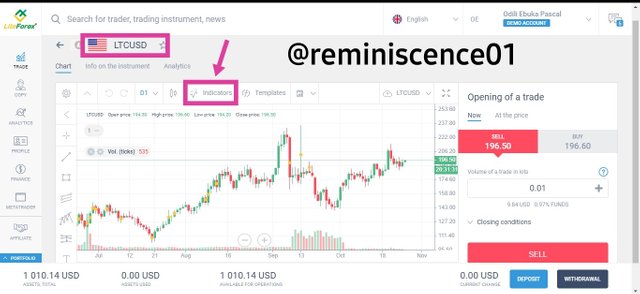
On the chart interface, click on indicators located at the top menu bar to be redirected to the indicator library.
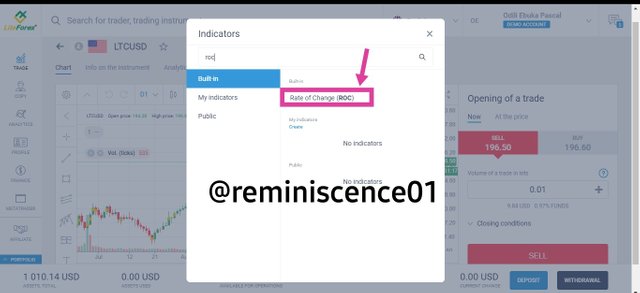
There are built-in and personal indicators options. But to easily locate the indicator you want, you can use the search bar and type in the name of the indicator. After that, click on the indicator to be added to the chart. This can be seen in the screenshots below.
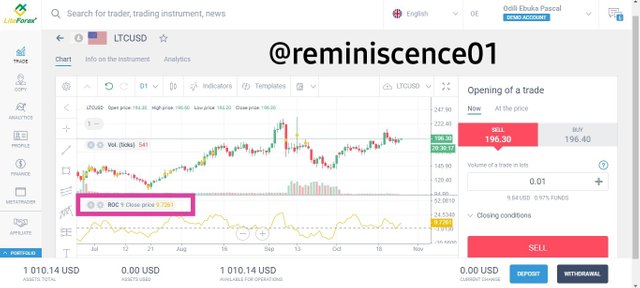
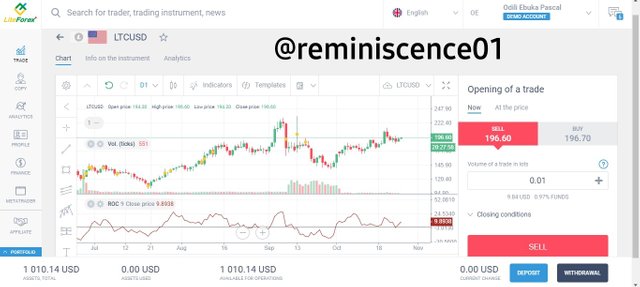
From the screenshots above, we can see that I have successfully added the ROC indicator to my chart.
Modifying ROC Indicator
Now we have added ROC to our chart, I will explain how to modify this indicator to suit my trading style. An indicator works best when it suits a trader's trading style. The following steps can be followed:
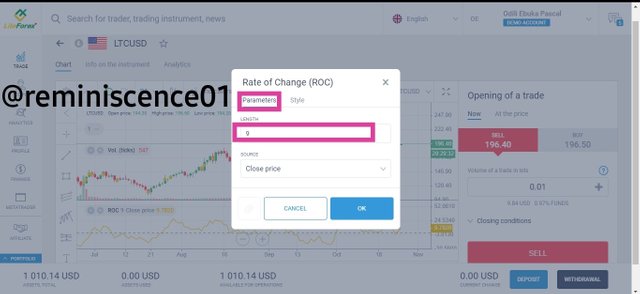
On the indicator window, click on the settings icon to be redirected to the configuration page.
After that, we can change the key parameter of this indicator which is the length (period). The default length is 9 which I find convenient for my trading style because I'm a day trader. Using period 9 smoothens the oscillator and also makes the indicator react faster to the current price changes.
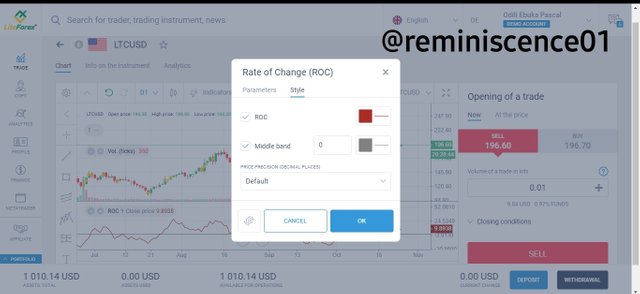
On the other hand, the style of the indicator can also be configured. Here I have changed the ROC line color and have also changed the zero line from the dash to a plain line. This can be seen in the screenshots below.

ROC Trend Confirmation Strategy and signals to detect a Trend reversal
ROC is a powerful momentum indicator that helps to identify potential market trends and also reversal points in the market. The zero line of the ROC is a major factor as the signals gotten from the ROC indicator depend on how price movement is above or below the zero line.
When the ROC is positive and above the zero line, it signals a buying pressure and increasing demand in the price of an asset. This buying pressure is stronger with an increasing positive value of the ROC. This shows that buyers are in control of the price. Similarly, when the ROC is negative and below the zero line, it signals a selling pressure and an increasing supply in the price of an asset. This strong selling pressure is stronger with a decreasing value of the ROC.
Uptrend Confirmation Strategy
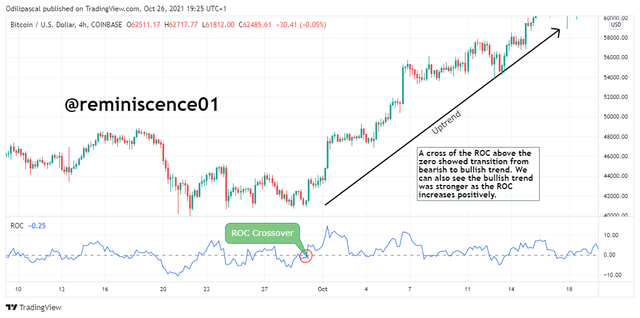
Just like we have discussed previously, a positive ROC above the zero line indicates an uptrend and bullish movement price. When there is a cross of the ROC above the zero line, it signals a change from a bearish to a bullish trend. This bullish trend is seen to be stronger with an increasing value of the ROC. This can be seen in the chart below.
Downtrend Confirmation Strategy
When the ROC breaks below zero with a decreasing value, it indicates a transition from a bullish to a bearish trend. This means that sellers have taken control of the market. We tend to see a stronger downtrend as the ROC keeps decreasing value. This can be seen in the chart below.
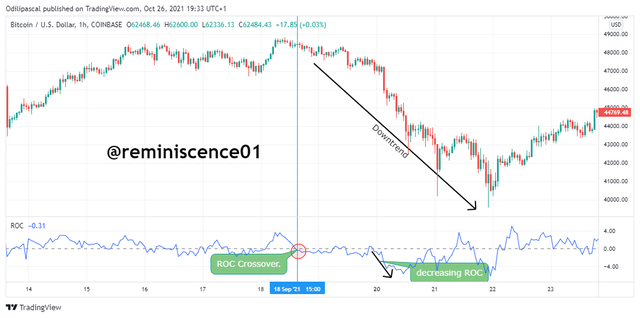
From the chart above, we can how the market switched from bullish to bearish as the ROC crossed below the zero line. Also, we can see a further downtrend as the ROC decreases in value.
ROC Trend Reversal Signal
Apart from identifying trends, the ROC indicator Cal also be used to signal a trend reversal. The following signals can be used to detect trend reversal.
Overbought and Oversold: As the ROC values increase or decrease above and below the zero line, or tend to get to extremes levels where traders' lookout for price reversals. This can be spotted after a strong bullish or bearish trend.
Zero line crossing: The zero line can also be used to signal a trend reversal. When the ROC is below the zero line, it shows a bearish market. When there's a cross above the zero line, this signals a trend reversal from bearish to bullish as explained previously. This is similar to a bullish reversal signal.
Divergences: Divergences are another way to spot trend reversal using the ROC indicator. Divergence occurs when there's opposing price movement between the price action and the indicator. When divergences occur, it shows that a reversal is about to happen. Divergence is another trend reversal using the ROC indicator. We will elaborate more on divergences later in this post.
Determining Buy and Sell decisions Using ROC indicator and also Identifying Signals of Overbought and Oversold
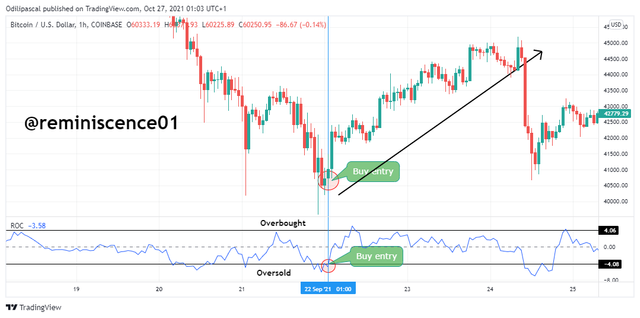
The movement of the ROC around the zero line is a useful signal to buy and sell in the crypto market. Just like we have discussed in the previous section, when the ROC crosses above the zero line, this signals a change from a bearish to a bearish trend. Traders already in a sell position can book profits to look for a buy entry. A sharp crossing of the ROC above zero is a strong buy signal. Though there might be some fakeouts using the ROC crossing as a buy signal, it is advisable to see a confluence between this signal and price action. An example of a buy entry can be seen in the chart below.
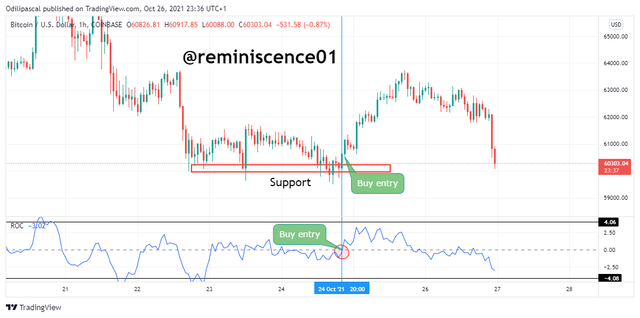
From the chart above, we can see the price was ranging and finding it difficult to break a support level. At this time, the ROC was also ranging within the zero line signal no trend. After some time, the ROC broke above the zero line which shows buying pressure in the market. This break above the zero line is a buy entry as prices have rejected the support level. We can see a bullish movement accompanied by this buy signal.
On the other hand, when the ROC crosses below the zero line, it signals a selling pressure in the market. This selling pressure is stronger with a decreased value of the ROC. We can use the ROC crossing below the zero line as a sell entry opportunity. But it is better to have a confluence with price action to strengthen this signal. This can be a decreasing price movement or a formation of a bearish candlestick pattern. An example can be seen in the chart below.
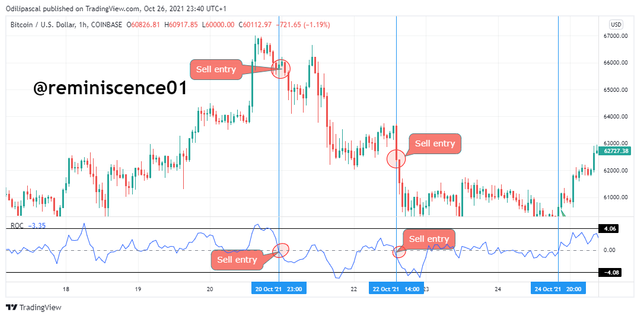
From the chart above, we can see that BTC/USD was in an uptrend as it created a new high. From all indications, the price is seen as overbought and a reversal is expected to happen. After that, we can see a sharp crossing of the ROC below the zero line which signals a shift from an uptrend to a downtrend. This crossing can serve as a sell entry opportunity to traders.
ROC Overbought and Oversold Signal
Overbought and oversold signals are best suited during a sideways market (absence of a trend). We tend to see prices create equal highs and equal lows. Also, the price of an asset can be considered overbought after a strong bullish movement and also oversold after a strong bearish movement. But traders need to be careful trading overbought and oversold signals during a strong trending market as the price of an asset can remain in these regions during a strong trend.
Overbought and oversold regions are strong reversal points traders look out for the price to reverse in the opposite direction.
When using the ROC indicator, the spread difference between -/+3 or -/+4% can be marked as overbought and oversold regions. Traders can expect reversals as prices enter these regions for a buy or sell entry.
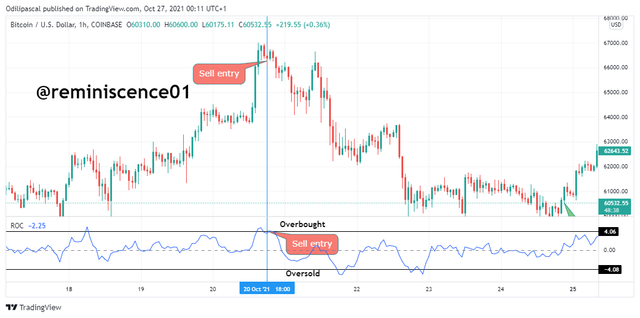
From the chart above, we have an overbought signal from the ROC indicator. BTC created an all-time high at $66.8k. The price of BTC/USD was considered to be overbought at this point and we can see the ROC above +4%. A sell entry opportunity can be placed as price reverse back down below the +4%.
For an oversold signal, the ROC is seen below the -4% below the zero line. This region is considered an oversold region and the price is expected to reverse to the upside. To avoid getting faked out and price manipulation, it is best to wait for the ROC to reverse to the upside breaking above the -4% before taking a buy trade.
Note: The oversold and overbought regions are not exact buy and sell regions as the price can remain in this region during a strong trending market. It is first advisable to confirm a reversal signal using other price reversal patterns or price action.
ROC Divergence with Price line
Divergence occurs when there's an opposing signal between an indicator and price action. When this happens, we tend to see price action showing a different signal from the indicator based on market structure. Price action might be showing a bullish market structure by forming a higher high chart pattern while the indicator is showing a bearish market structure forming a lower low pattern.
The divergence is a strong reversal signal that can be used to filter false signals in the market. Traders look out for divergence during a strong trending market for potential reversals.
Bullish Reversal of the ROC
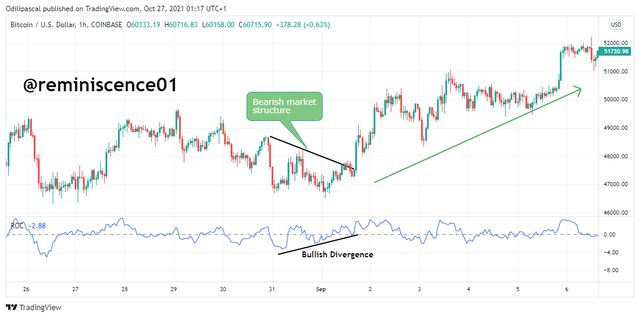
A bullish reversal occurs during a bearish trend of the price action. This occurs when price action is signalling a bearish movement by forming a lower low pattern while the ROC indicator is forming a higher high pattern. This shows exhaustion in the bearish trend and a possible trend reversal to the upside. An example can be seen on the chart below.
Bearish Divergence of the ROC
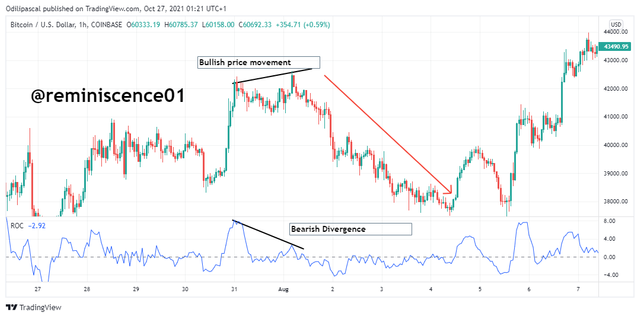
The bearish divergence occurs during a bullish trend. The bearish divergence signals exhaustion in the bullish and a possible trend reversal to the downside. This can be seen on the chart as the price is showing a continuous uptrend by forming higher high patter. On the other hand, the ROC indicator is signal a bearish pattern by forming a lower low pattern. The bearish divergence is accompanied by a bearish trend. An example can be seen on the chart below.
ROC False Signal
Indicators can sometimes give false signals when used wrongly. A scalper using a 25 period ROC calculation tends to miss out on recent price changes as he will be using a lower time frame. Using the wrong configuration of the ROC indicator can generate false signals. Similarly, indicators are not 100% correct as of the deal with historical price data points. They work best as a confirmation tool for the trading signal when used with other technical analysis tools.
Using an indicator as a standalone technical analysis tool is risky. Other forms of technical analysis can be combined with the ROC indicator to filter out false signals.
Identifying and Confirming Breakouts Using ROC Indicator
Breakout is a regular scenario that happens in the market after price consolidation. During low trading hours or trading periods where demand is equal to supply, we tend to see price bouncing within areas of support and resistance as shown in the chart below.
The consolidation period is an accumulation period after a strong bullish/bearish trend. Price fails to either create new highs or new lows until there's higher momentum either on the bull is or bearish side. During the consolidation phase, the ROC indicator is seen to be ranging close to the zero line until price breakout. This can be further illustrated on the chart below.
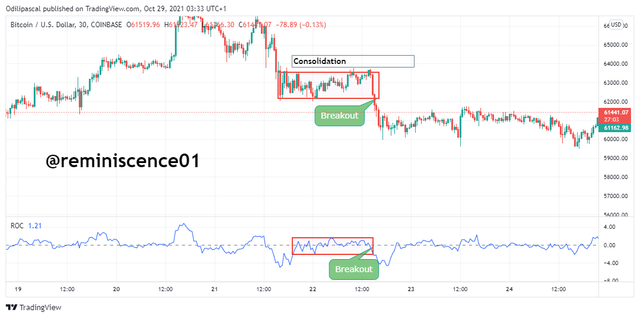
From the chart above, we can see how price was ranging between $63.5k and 62.2k bound. Price failed to record new highs and lows as the support and resistance created were rejected. We also tend to see this consolidation on the ROC indicator as it is plotted close to the zero line during this period until the price broke below the zero line.
The ROC indicator can help breakout traders to take advantage of the market during a consolidation phase. Though trading breakouts can be risky as traders can fall for false breakouts.
Reviewing the Chart of BTC/USD and Spotting various signals from RON indicator
In this section, I will be reviewing the chart of BYC/USD on 30mins timeframe to spot the various signals from the ROC indicator. This analysis will be carried out on Tradingview and I will be using +4/-4 limits for overbought and oversold regions as discussed previously in this post.
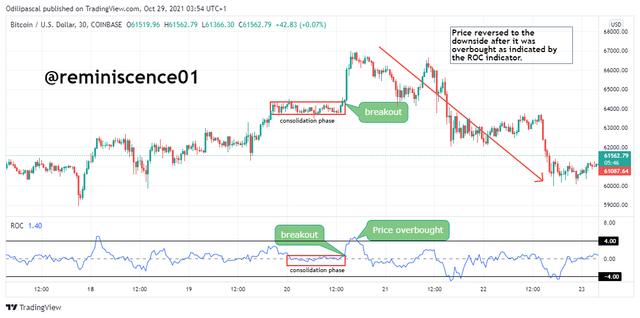
From the chart above, we can see the ROC indicator chart below the price chart. BYC was in an uptrend forming a series of higher highs and higher lows until price created a new high at $64.34k. This area is known as an accumulation phase and profit-taking period for traders after the bullish movement. During this period of consolidation, we tend to see the ROC plotted to the zero line which identifies no trend in the market.
After some time, there was a bullish breakout of BTC as the price created an all-time high at $66.89k. This breakout can also be seen on the ROC indicator as the price sharply broke above the zero line to the overbought region above +4%. Again, a reversal was expected as BTC was spotted in the overbought region.
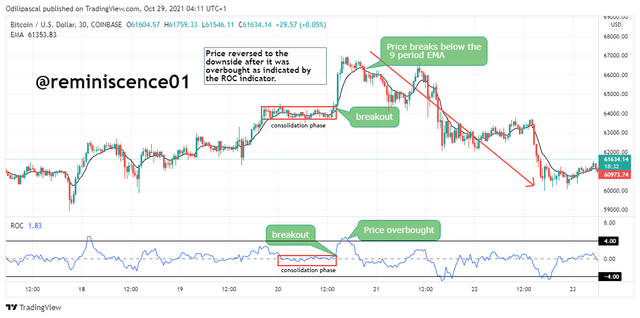
BTC failed to create a new high and this triggered a sell-off of BTC which caused the price to reverse to the downside. Also, a change of trend from bullish to bearish can be confirmed using an EMA of the same period 9. We tend to see price break below the 9 period EMA which shows a change from bullish to a bearish trend. After that, the price reversed in the opposite direction.
Entry and Exit criteria for this Analysis
As a trader, you need a strategy to enter and exit the market. Using the ROC indicator, you don't just take a sell trade because the price is in an overbought region. Remember that price can remain in an overbought region for a long time during a strong bullish trend. A good entry opportunity is to wait for the ROC indicator to reverse back below +4% before looking for an entry position.
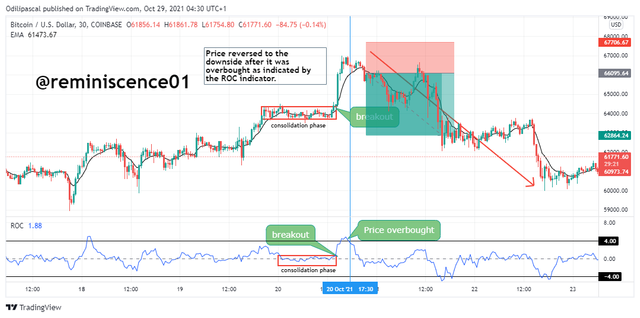
To further confirm the sell trade, it is advisable to also wait for the price to break below the period EMA to confirm the trend reversal. A 1:2 risk-reward ratio is recommended with a stop loss placed above the recent high.
Conclusion
Technical indicators are important essential tools for effective technical analysis. They have many purposes which include trend identification, trend reversal, breakouts, and also trading signals. In this post, we have discussed the ROC indicator and how to trade with it for good trading decisions. The indicator serves the purpose of identifying trends, trend reversals, and also price breakout.
It is necessary to know that the "nth" period of the ROC is a sensitive parameter of the indicator. Using this parameter depends on your trading style to have a smooth signal from the indicator. Though the ROC indicator has shown to be a good technical analysis tool, it is advisable to confirm the trading signal using an alternative indicator.
In the last section of this post, we have used the Exponential moving average (EMA)/of the same period with the ROC to confirm a trend reversal signal. Trading cryptocurrency is risky and it is required for a trader to have a good risk-reward strategy to avoid unnecessary losses in the market. A good entry and exit strategy have also been discussed in the post using the EMA for confirmation.
Thank you @kouba01 for this amazing lesson.
Hi @reminiscence01
Thanks for participating in the Steemit Crypto Academy
Feedback
Total| 9.5/10
This is good work. Thanks for demonstrating such a clear and well detailed understanding of trading using Rate of Change indicator.
Thank you @yohan2on.
#club5050 😀
Buenos días! Yo deseo entrar a SteemitCryptoAcademy. Cómo puedo hacer? Me interesa mucho estás informaciones. Gracias
https://steemit.com/hive-108451/@steemitblog/steemit-crypto-academy-update-september-6th-2021-season-4-beginners-level-introductory-courses