Steemit Crypto Academy Season 4 Week 2 - Beginner's Course | Technical Indicators.
Hello Steemians, I welcome you all to the 2nd week of Season 4 in the Steemit Crypto Academy. I'm your humble teacher for the beginner's course and in this season, we will continue to educate new users on basic information they need to know about cryptocurrency technology.
In season 3, we focused on basic trading tools for carrying out technical analysis on cryptocurrencies. Technical analysis is an essential part of cryptocurrency investment every investor needs to have knowledge about before making any trading decision.
There are many technical analysis tools available out there to help investors make good trading decisions. In this lesson, we will be discussing technical indicators as one of the technical analysis tools. Indicators are very important technical analysis tools that assist a trader to understand the movement of crypto prices in the market.

Technical Indicators
Technical indicators are mathematical calculations of historic price movements presented graphically to help predict future market prices and trends. The idea behind most indicators is the psychology of traders and forces of previous supply and demands. Price is expected to react to previous areas in the future and the technical indicators help to identify these areas for future reference.
Indicators are created using series of price data points. This can be the previous closing and opening prices of an asset over a period of time. This helps to generate an accurate signal for making future analysis.
Most traders use technical indicators as a standalone trading strategy for making cryptocurrency investments. However, technical indicators work best as a support tool and signal confirmation when used with other technical analysis tools.
Categories of Technical Indicators
There are different categories of technical indicators available today for investors. The proper use of these indicators depends on your trading style and the objectives of your investment. We will discuss each of the categories of indicators and also the examples of indicators under each category.
Trend Based Indicators
There's always a saying in the market "the trend is your friend". Trading against the trend is catastrophic because you are going against the market. Trend-based indicators also known as trend-following indicators help traders to understand the current market trend in the market. The trend-based indicators help to ascertain if the price of the crypto-asset is trending or in a range. Similarly, the strength and weakness of a trend can be identified using these indicators to help make good trading decisions.
Some of the trend-based indicators include:-
- Moving Averages ( Simple/Exponential).
- Average Directional Index ( ADX).
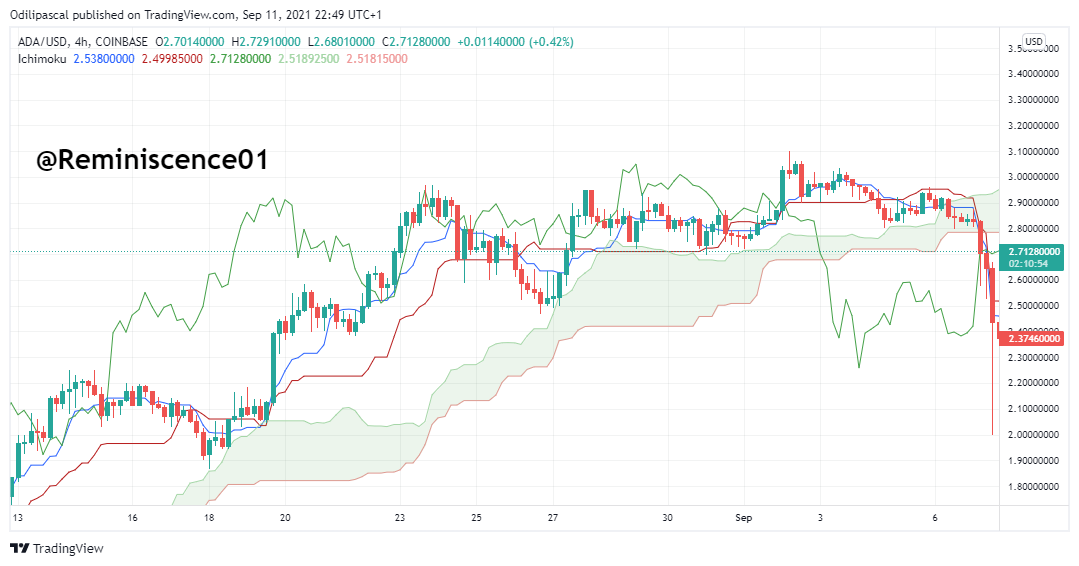
- Ichimoku Kinko Hyo etc.
Example of Ichimoku Kinko Hyo indicator on the chart.
Volatility Based Indicators
The volatility-based indicators are indicators used for measuring market swings (upswings or downswings). Fluctuations in market prices are indicated by seeing highs and swing lows of prices. When this happens, the up and down movements of prices can be analyzed using volatility-based indicators. Traders can use these indicators to buy at a relatively low price (swing low) and sell at a relatively high price (swing high).
Similarly, these indicators can also be used to ascertain whether the volatility is high or low. Some of the volatility-based indicators include:-
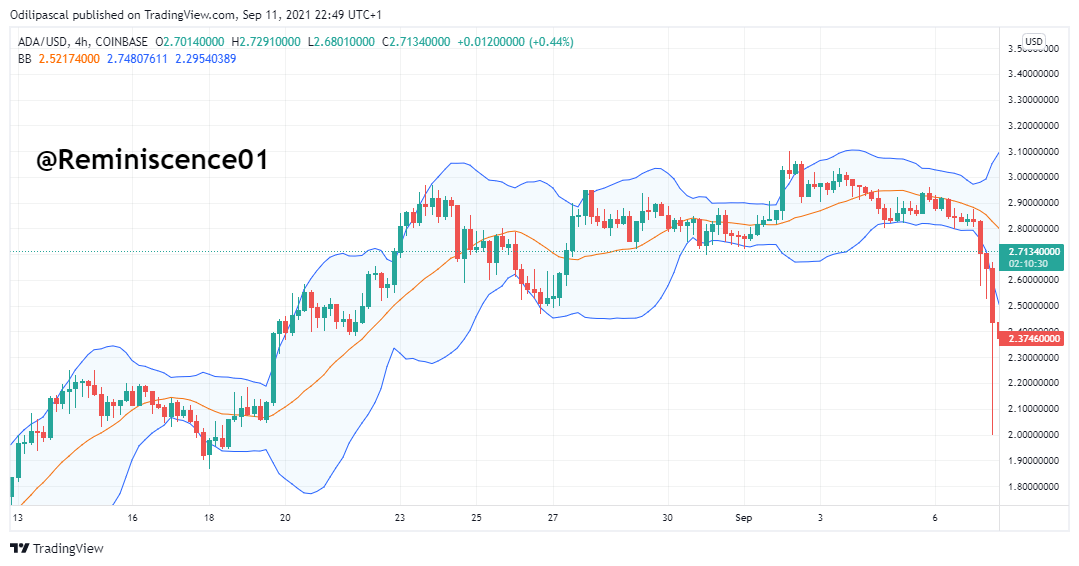
- Bollinger Bands.
- Average True Range (ATR) etc.
Example of Bollinger Bands indicator on the chart.
Momentum-Based Indicators
Momentum-based indicators also known as Oscillators are indicators used to analyze how far the price of an asset has traveled. An asset in a bullish trend will not always remain bullish. Based on forces of supply and demand, this asset will be overpriced and investors will start taking profits which will create selling pressure on this asset. Oscillators help to give an idea of when the price of an asset is overbought or oversold. Investors can capitalize on this indicator to take profit when price is in the overbought region or look for a buy entry when price is in the oversold region.
Some of the examples of momentum-based indicators include:-
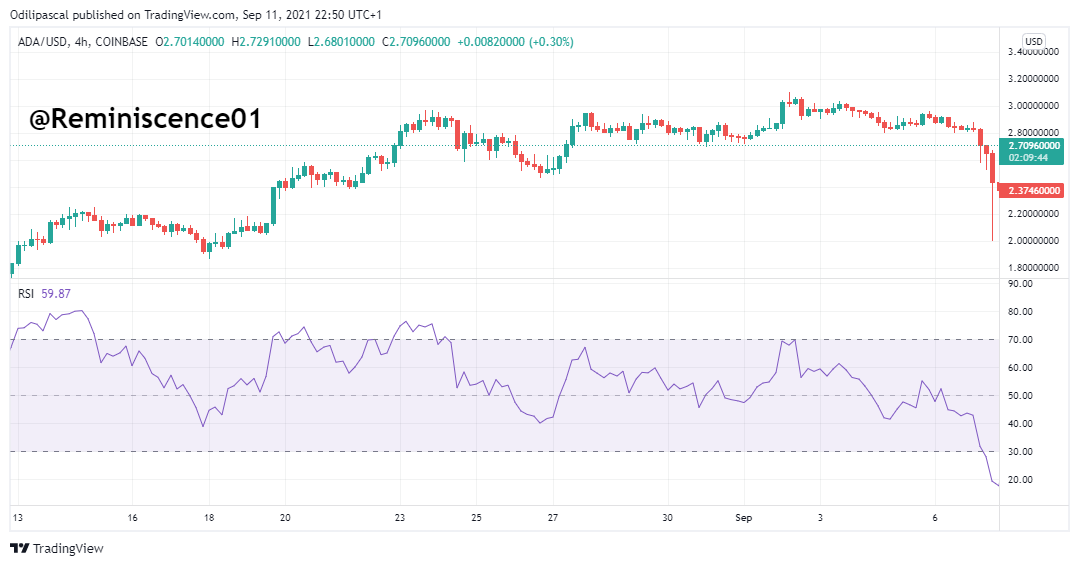
- Relative Strength Index (RSI).
- Moving Average Convergence Divergence (MACD)
- Stochastic etc.
Example of relative strength index on the chart.
Key Functions of Technical Indicators
Technical indicators have several functions which depend on what the investor wants to achieve. But in this lesson, I will discuss 3 main functions of technical indicators.
Prediction
Most investors use technical indicators to predict the future price of an asset or an area of interest (support and resistance) on price. This helps a trader to make timely decisions using the indicator.
Confirmation
Indicators work best as a confirmation tool of other technical analysis tools. This can be the use of indicators to confirm a signal on price action signal. Using indicators as a confirmation tool helps an investor to filter out false signals and avoids fakeouts in the market.
Alert
Indicators serve as an alert tool for traders to either take profits or prepare for an entry position. A trader using the RSI will be expecting a potential reversal when price come into the overbought and oversold region. Also, trend-following traders use technical indicators to stay alert on the beginning of new trends and also when a trend is weak.
Importance of Technical Indicators
Technical indicators are important tools for technical analysis when used properly. Below are some of the importance of technical indicators:-
Helps to understand market condition
Technical indicators play an important role in understanding the current market condition. Technical indicators can ascertain whether the market is trending or ranging. It can also be used to determine the momentum in the price of an asset. This helps the investor to take advantage of the market and make good trading decisions.
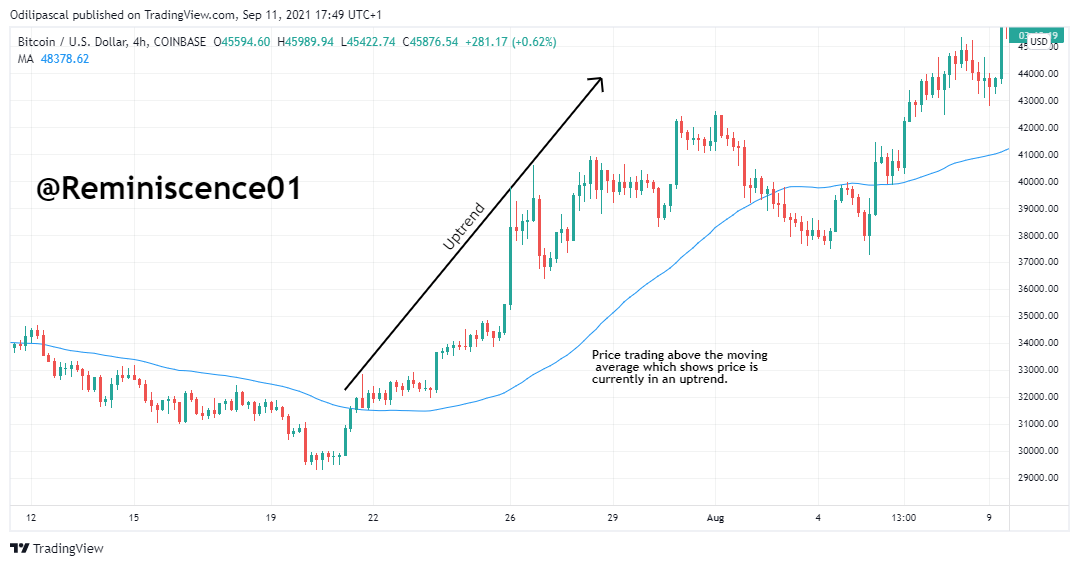
From the chart below, we can see how the moving average (trend-based indicator) can help to understand the current market trends.
Similarly, the RSI also shows the beginning of a new market trend as price breaks above the 50 RSI indicator chart which signals a strong momentum in an uptrend.
Good Trade Management
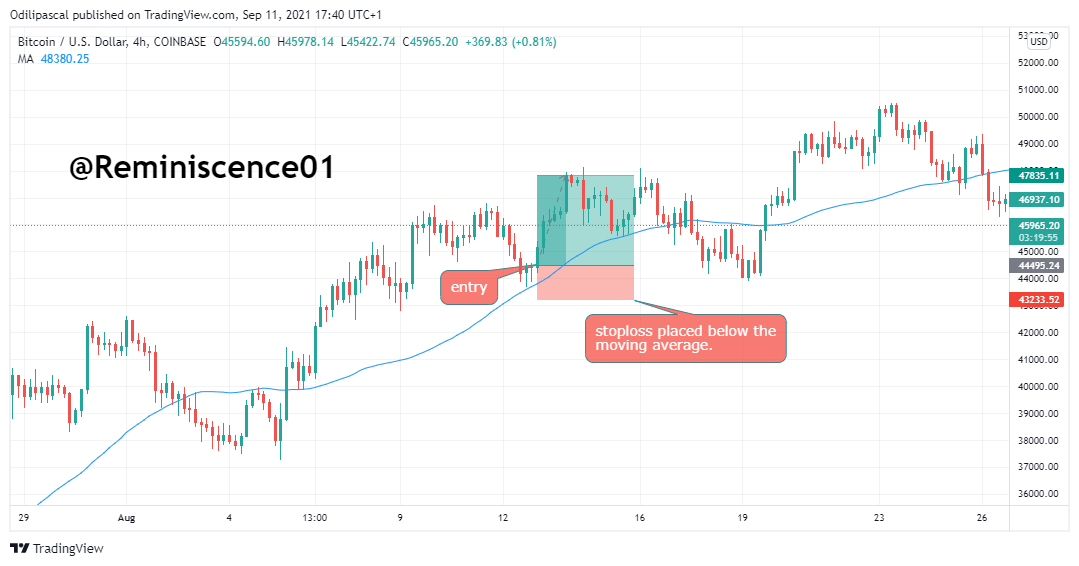
Most indicators provide traders with early trading signals. This helps to reduce stoploss size, thus increasing the winning ratio of a trade position. Similarly, technical indicators provide areas of support and resistance which are stoploss target areas and take profit areas. A good example is a moving average indicator. A good entry position using the moving average can be seen when price touches the moving average line and is reversed to the opposite direction. Stoploss can be placed few points below the moving average. This can be seen in the chart below.
Signal Confirmation
Just like we have discussed previously, technical indicators serve as signal confirmation to investors. This can be done by combining technical indicators with other technical analysis tools or maybe by using two different indicators of the same category to confirm a trading signal.
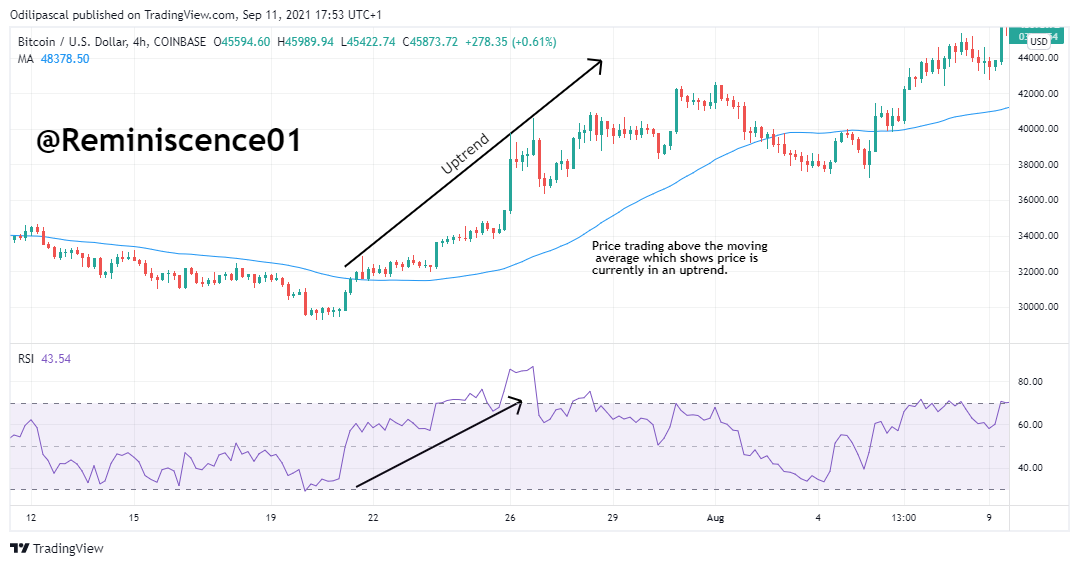
From the chart above, we can see how price broke above the moving average signaling a trend reversal to the upside. This buy signal can also be confirmed on the RSI as price rejects the oversold region reversing to the upside. From what we have on the chart, the RSI indicator has helped to confirm the bullish signal indicated by the moving average.
Conclusion
Technical indicators are very important technical analysis tools that an investor can use either as a support tool or a confirmation tool. However, though we have outlined the importance of technical indicators. An investor should bear in mind that these indicators can sometimes give false signals or lag behind the current market price. Therefore, it is advisable to have two or more signal confluences from price action and technical indicators to be on the safe side.
Similarly, it is essential to select an indicator that best suits your trading style and also understand its configurations before using them as a technical analysis tool.
We have come to the end of this lesson. In the next lesson, we will continue to elaborate on technical indicators to understand how to properly use them.
Thank you for being part of this lesson.
Homework Task
Ensure you have understood the lesson before performing the tasks. I encourage you to spend quality time answering the questions and also write in your own words. Remember it is not just about answering the questions correctly. Your creativity in answering the tasks is highly expected.
a) In your own words, explain Technical indicators and why it is a good technical analysis tool.
b) Are technical indicators good for cryptocurrency analysis? Explain your answer.
c) Illustrate how to add indicators on the chart and also how to configure them. (Screenshot needed).a) Explain the different categories of Technical indicators and give an example of each category. Also, show the indicators used as an example on your chart. (Screenshot needed).
b) Briefly explain the reason why indicators are not advisable to be used as a standalone tool for technical analysis.
c) Explain how an investor can increase the success rate of a technical indicator signal.
Homework Guidelines
- Homework must be posted in Steemit Crypto Academy community. Your homework title should be " [Your Title] - Crypto Academy / S4W2- Homework Post for @reminiscence01".
- Plagiarism is a great offense in Steemit Crypto Academy and it won’t be tolerated. Ensure you refrain from any form of plagiarism.
- Your post should not contain less than 350 words.
- All images, graphs, and screenshots from external sources should be fully referenced, and ensure to use watermark with your username on your own screenshots.
- Use the tag #reminiscence01-s4week2 #cryptoacademy and your country tag among the first five tags. Also include other relevant tags like #indicators, #technicalanalysis.
- Homework task run from Sunday 00:00 September 12th to Saturday 11:59 pm September 18th UTC Time.
- Only users with a minimum of 200 Steem Power and having minimum reputation of 55 are eligible to perform this homework. Also, note that you must not be powering down.
- User who have used upvote tools to gain SP or build their reputation are not eligible for this homework.
- You can only drop your homework link in the comment section if not reviewed after 48 hours.
The comment section is freely opened for suggestions and feedback on the lesson and homework.
Cc: @steemitblog
Hello professor @reminiscence01, please help review my assignment Prof @wahyunahrul skipped for last week... Here's the link
https://steemit.com/hive-108451/@cinnymartins/crypto-academy-season-4-week-1-beginner-s-course-socios-com-blockchain-based-platform-for-sports-industry-or-or-homework-post
Thank you for the lecture professor. I just have a few questions sir. Please what is meant by stoploss and take profit? And please which site do you use to observe the market?
https://steemit.com/hive-108451/@shylock2002/steemit-crypto-academy-season-4-week-2-or-homework-post-for-professor-reminiscence01-technical-indicators
Very educative,i will learn more from this course.thanks @reminiscence01
Hola Profesor @reminiscence , a ver si es posible pueda ayudarme con esta tarea, tiene cuatro días y no ha sido revisada, agradecería su ayuda, saludos https://steemit.com/hive-108451/@sir-lionel/crypto-academy-season-4-beginners-course-task-9-blockchain-wallet-types-uses-installation-etc-para-prof-sapwood
This is really a nice lecture and I will learn more when I attempt the homework thanks professor
Thank you. I'm looking forward to your submission.
OK dear
Good work professor @reminiscence
Thank you.
This post is shared on Twitter
A beautiful lecture as always, expect my submission soon sir.
Thank you. I'm looking forward to your submission.
I love this week's task it is highly educative and the presentation by professor @reminiscence01 makes it simpler to comprehend. Thanks for the good lecture delivered sir.
Thank you. I hope to see your submission.
I shall. Thanks