Steemit Crypto Academy Season 5 Week 1 [Beginner's Course] - Understanding Trends


Hello Steemians, I welcome everyone to the first week of Season 5 in the Steemit Crypto Academy. The previous seasons have been awesome and here we are again to provide you with exciting information about the cryptocurrency market.
Introducing Trends
The crypto market can either be in a trending phase or a ranging phase. This condition of the market is a reflection of the forces of demand and supply and also the struggle between the buyers and the sellers. When there's huge demand or more buyers in the market, we tend to see prices going up (bullish trend).
The same case is applied for the bearish trend when we tend to see more sellers than buyers in the market. When the market is ranging, we tend to see prices within a boundary bouncing off support and resistance points.
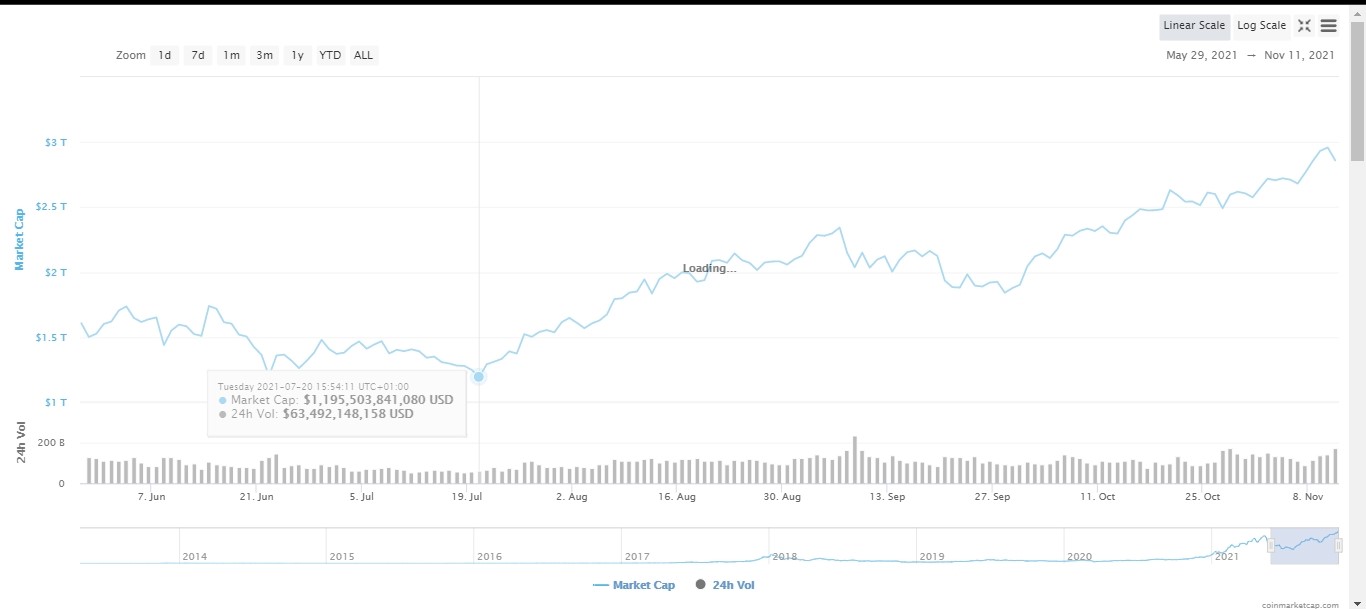
This study is focused on trends. Looking at the entire crypto market cap chart in the last 6 months, we tend to see an increasing value in the market cap. From $1.1 Trillion to almost $3 Trillion in the last 6 months. This shows a good development and increased demand in the entire crypto market.
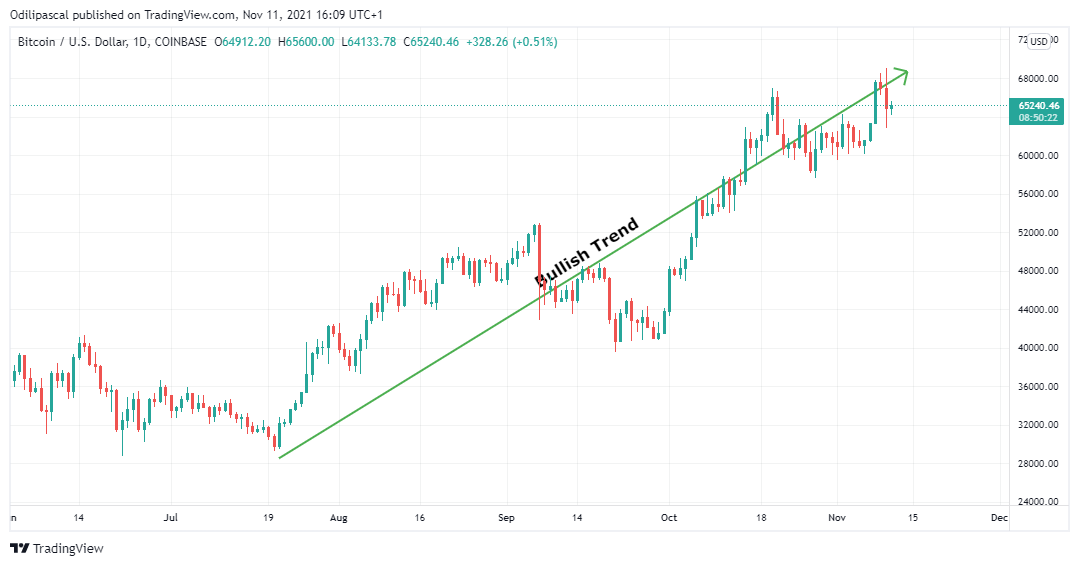
Now, looking at the BTC/USD chart shown below, we can see a bullish movement of BTC from $29.4k to its all-time high at $69k. Here we can say that BTC has been in an uptrend in the last 4months making higher-highs and higher-lows formation.
When we say the market is trending, we tend to see prices moving in a particular direction either upward or downward. During trending markets, we tend to see prices closing higher than the previous high for an uptrend. Also, during a downtrend, we tend to see prices closing lower than the previous low.
A popular trading quote says "the trend is your friend". This is true for crypto traders who understand how to identify trending markets to take advantage of them. Trading in direction of the trend gives you higher chances of capturing every market swing and also enables you to avoid going against the market direction.
Also, the knowledge of the trending market will enable a trader to identify when a trend is weak and exhausted to take profits and close up their positions.
Now we have understood trends, let's look at the different ways we can identify the trending phase of the market.
Market Structure
The market structure is one of the ways to identify the current state of the market. Market structure can help you identify whether the market is in an uptrend, downtrend, or ranging. This can be spotted easily using candlestick chart patterns formed on the chart.
Bullish Trend
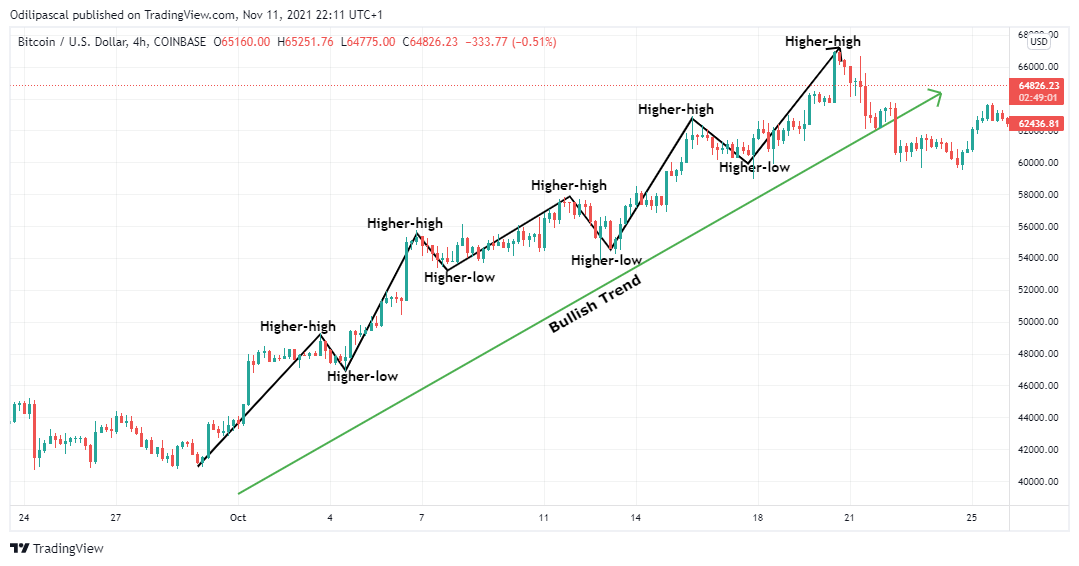
For a bullish market structure. We tend to see the market forming a higher-high and higher-low formation. This means that the price fails to trade below the previous low-point and also closes above the previous high-point. This formation shows the presence of buyers to keep pushing prices higher which leads to an uptrend.
Understanding the formation of bullish will enable a trader to know that a minor pullback during an uptrend is a retracement for the price to continue going higher. This can also help a trader get a good entry position during an uptrend. An example of a bullish trend can be seen in the chart below.
Bearish Trend
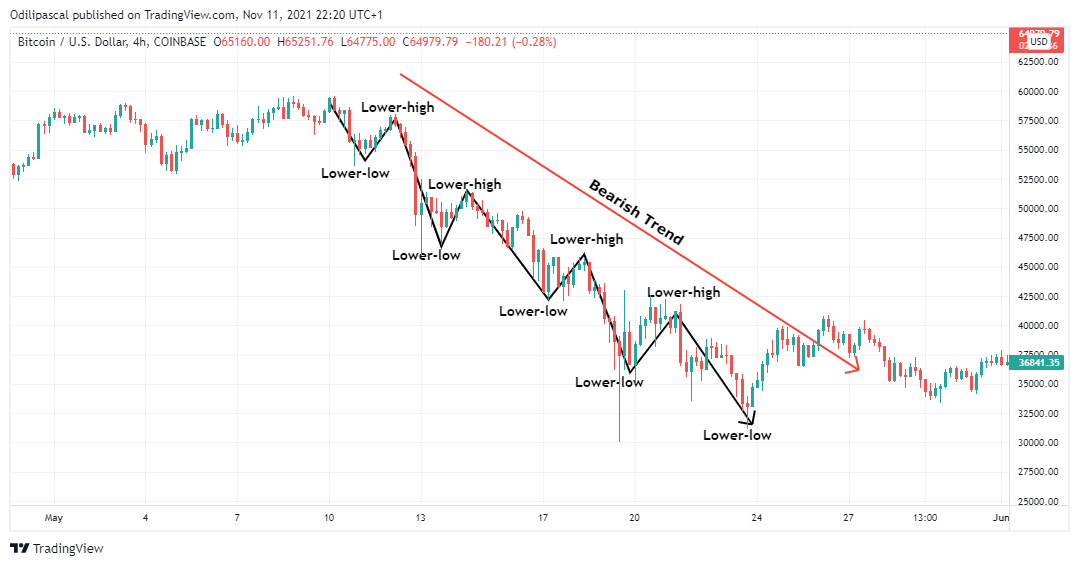
For a bearish market structure, we tend to see the market forming a lower high and a lower low formation. This means that the price fails to close above the previous swing high. Similarly, price breaks the previous low-point which shows strong momentum to the downtime.
This formation leads to a bearish trend until the market fails to create this lower-high and lower-low formation. Then we can anticipate weakness and trend reversal at this point. An example of a bearish market structure can be seen on the chart below.
Ranging Market
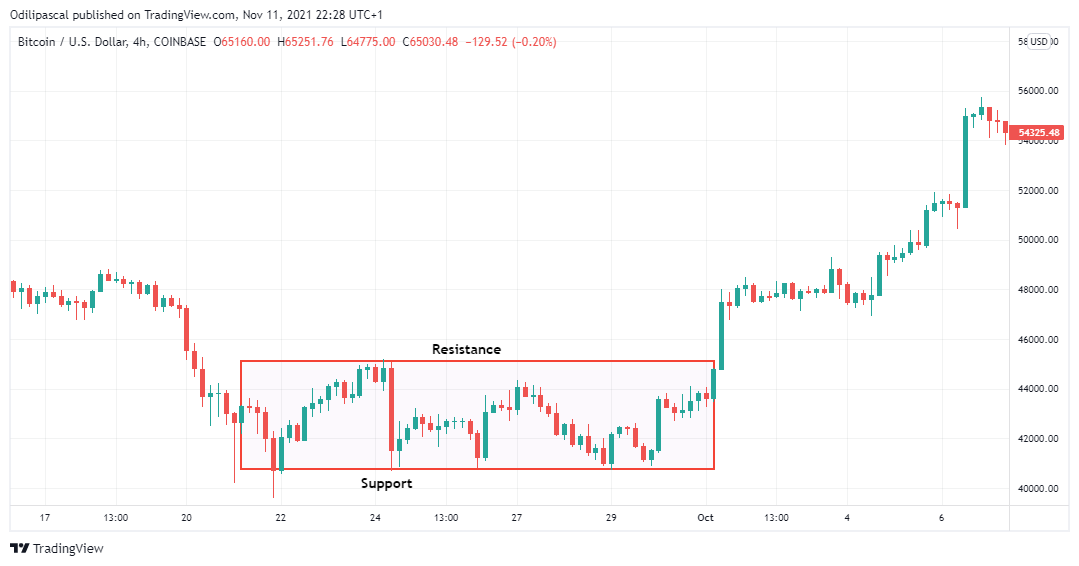
Sometimes, we tend to see the market bouncing off support and resistance areas without any trend. This phase is termed as an accumulation phase for either profit taking or build-up for a trend. During a ranging market, prices fail to either create a new high or a new low.
Traders who capitalize on ranging markets sell at resistance and buy at support as the market moves within a boundary. Trend following traders stays out of the market during this period until a breakout and trend are confirmed. An example of a ranging market can be seen on the chart below.
Trend Lines
Another amazing technical analysis tool for trend identification is the Trendlines. The trendline helps traders to identify the direction of the market. This can easily be drawn using two low points for an uptrend and two high points for a downtrend. A break of the trendline is a strong indication that the current trend is invalidated.
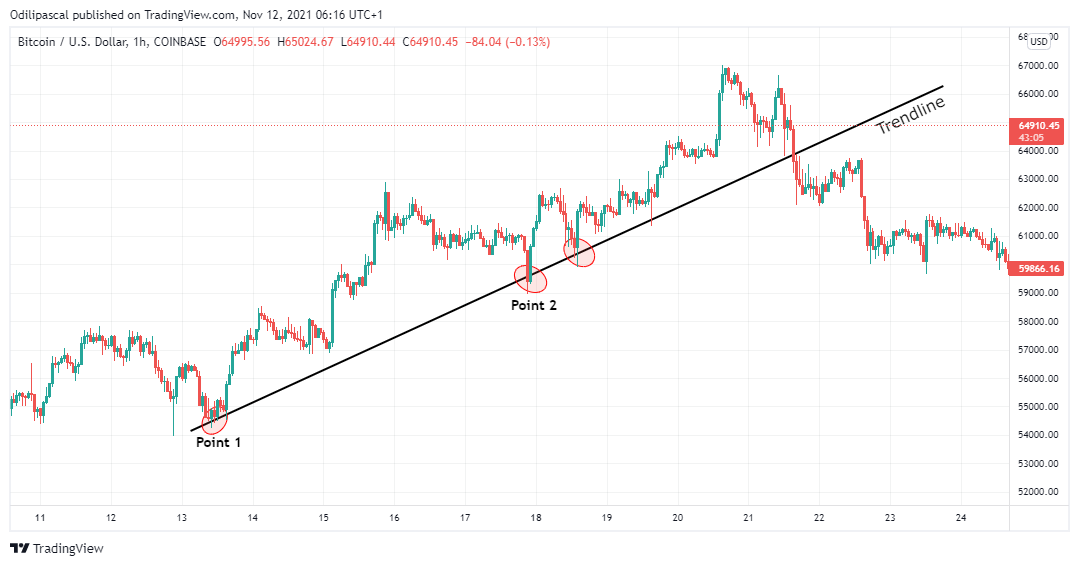
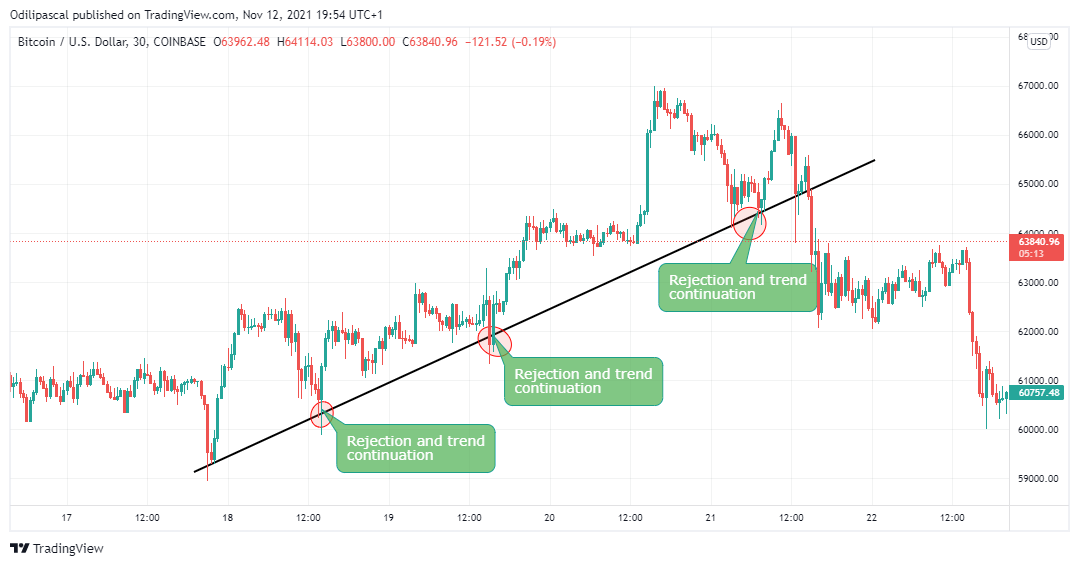
For a bullish trendline, we can see price trading above the trendline. Notice how price bounces back up each time it hit the trendline. This point can serve as an entry position for traders to keep riding the trend until it is invalidated (break of trendline).
An example of a bullish trendline can be seen in the chart below.
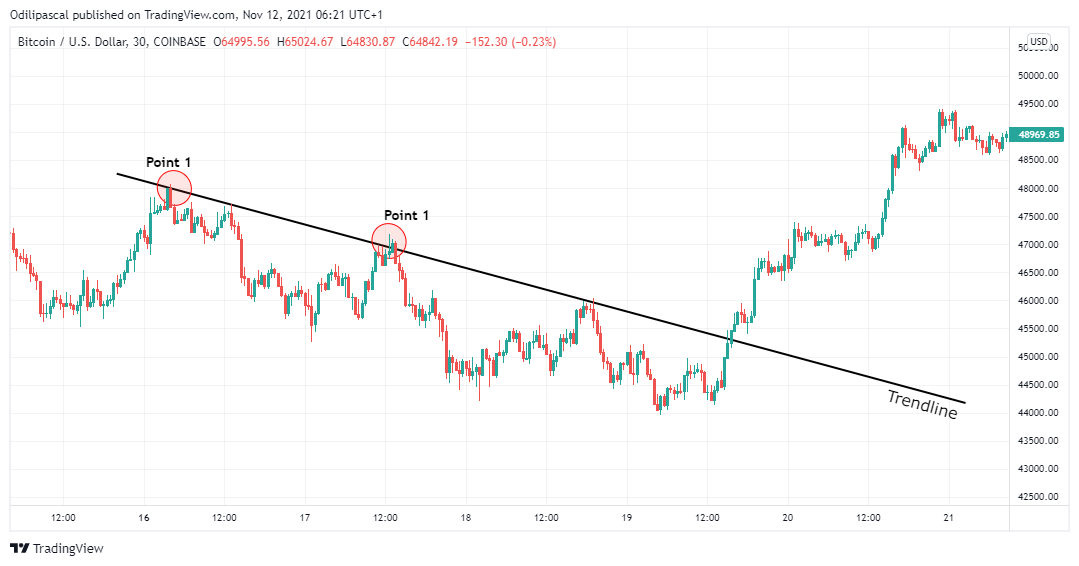
Similarly, for a bearish trendline, we tend to see price trading below the trendline. The trendline serves as a dynamic resistance during a downtrend as we tend to see price rejected when it hit the trendline. Trend-based traders can have good market direction and an opportunity to keep riding the bearish trend using the trendline until the trend is invalidated (break of trendline).
An example of a bearish trendline can be seen in the chart below.
Trend Continuation
During a trending market, price doesn't just move in a straight line. There are fluctuations and retracements which form zig-zag patterns on the chart. These retracements are a result of profit-taking by traders for the price to continue in its original direction.
That's why sometimes, after a strong bullish rally that breaks a previous resistance, the price often comes back to retest this resistance for a continuation of the bullish trend. Understanding trend continuation will help you know whether a trend will continue or a reversal is about to happen.
Also, understand that pullbacks are an entry opportunity for traders to keep riding the trend. This will enable them to purchase an asset at a relatively low price before that bullish wave.
Now let's look at a trend continuation pattern using market structure.
Market Structure
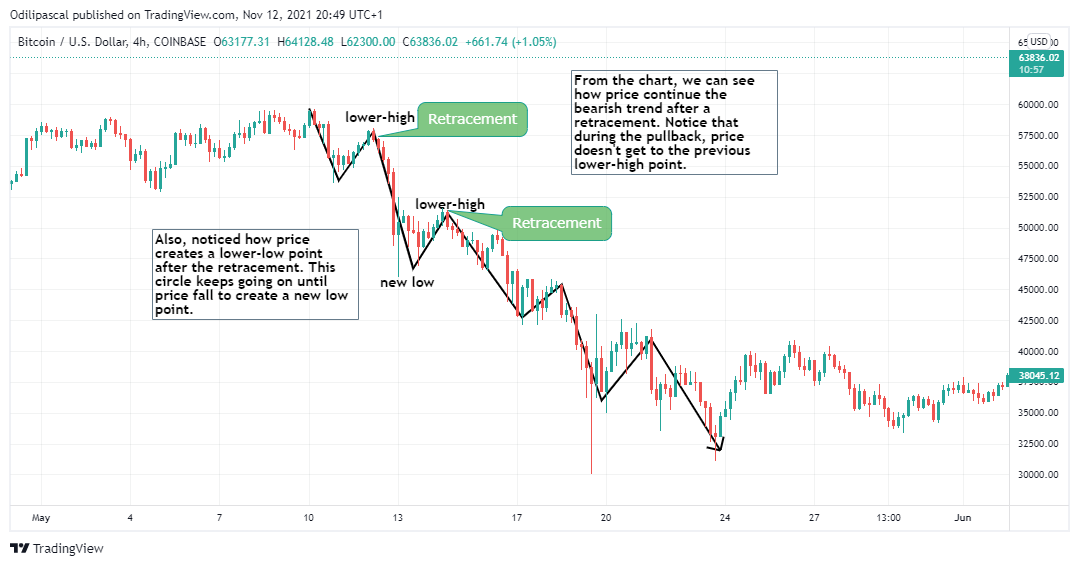
Price creates higher high and higher low points during a trending market. After an impulsive move, there's a retracement for the price to continue in its original direction. For a downtrend, the retracement creates a high point that is lower than the previous high.
This means that buyers are unable to push the prices above the previous high thus indicating that sellers are still in control of the price. This low point serves as an entry opportunity for traders before the next impulsive move.
There are two key points to be taken here for a bearish trend.
The high point during retracement must not get to the previous low point.
The new low point created must be lower than the previous low point.
Similarly, for an uptrend, the following key points should be noted for a trend continuation to the upside.
The new low point must not be lower than the previous low.
The new high point must be higher than the previous high.
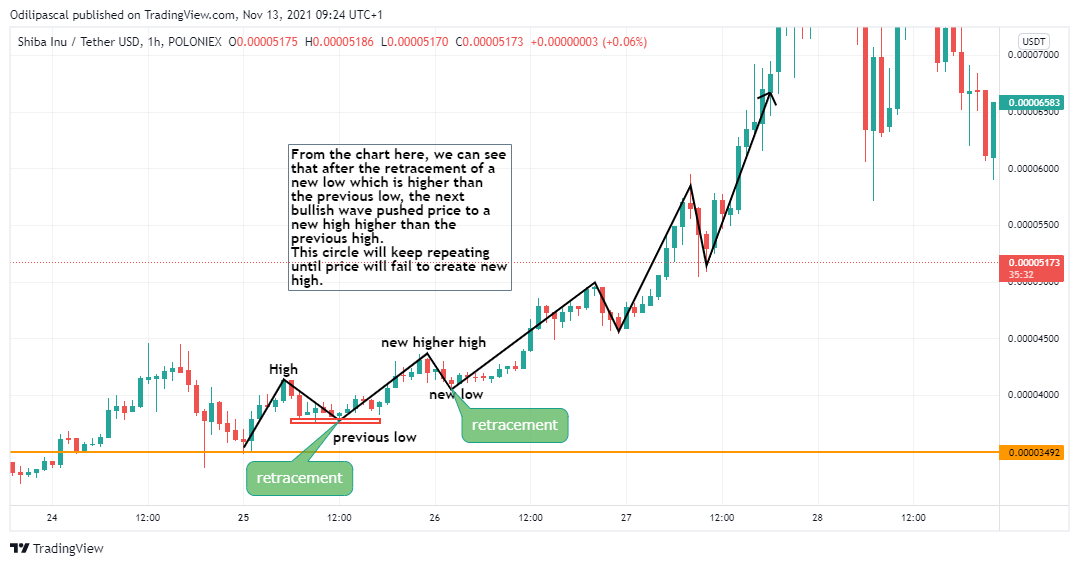
Violation of any of the rules above will signal weakness in the trend and a possible trend reversal. For example, during an uptrend when price fails to create a new high, this shows the weakness of the buyers to keep pushing the price up.
This also signals to a trader that the current bullish trend is weak and a possible reversal is expected. This same case is applied to a downtrend when the price fails to create a new low.
Spotting Trend Continuation using Trendline
Just like we have discussed previously, the trendline is an important technical analysis tool that gives traders information on the direction of the market. The trendline also serves as dynamic support and resistance during a trending market.
We have discussed how to draw a trendline in the previous section by joining two points on the chart drawn to the future. During a trending market, price retraces back to the trendline and gets rejected before continuing the original trend.
From the chart below, we can see how price bounces back up after it hits the trendline to continue the bullish trend. A break of the trendline is a violation of the bullish trend and also a trend reversal signal.
Analysing a Crypto Asset Pair to Identify the Current Trend
In this section, we will be analyzing the current Trend in BTC/USD on a 1hr timeframe on Trading. Looking at BTC/USD, we can see a bullish trend structure as the price kept creating higher highs and higher lows as BTC hits a new all-time high at $68.8k. After that, the price retraced to create a low at 66.2k.
After this retracement, the price is expected to continue higher create a high higher than the previous high. But from what we can see on the chart, the price failed to create a new high and this gives rise to the formation of a double top which is a trend reversal signal.
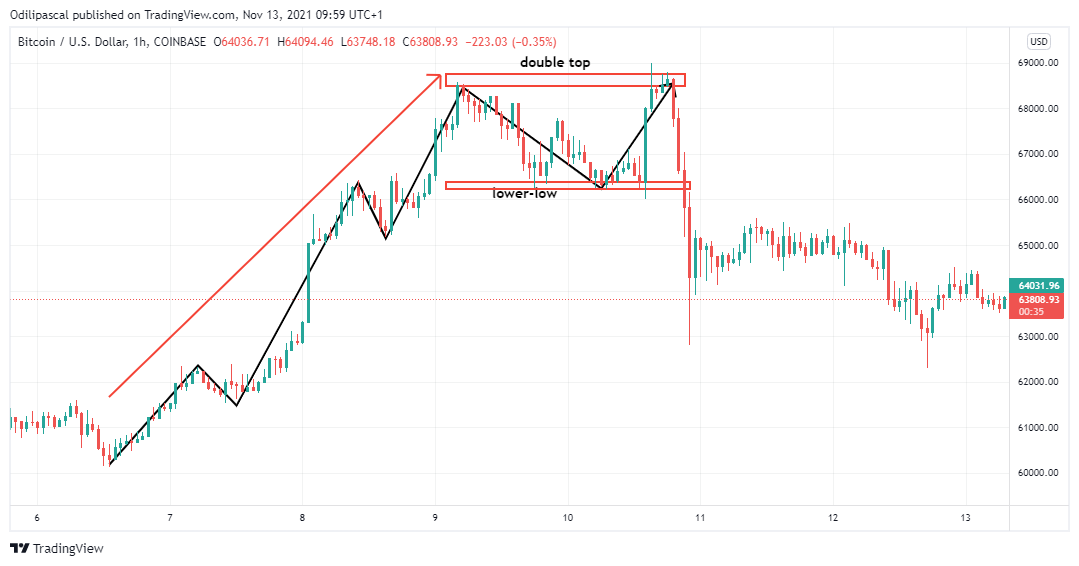
From what we have discussed in the previous chapter, the bullish trend is no more valid as prices have failed to create a new high. Also, the formation of a double top is a trend reversal signal. Understanding trends formation at this point will help you understand that it's time to close buy positions and take profits off the market.
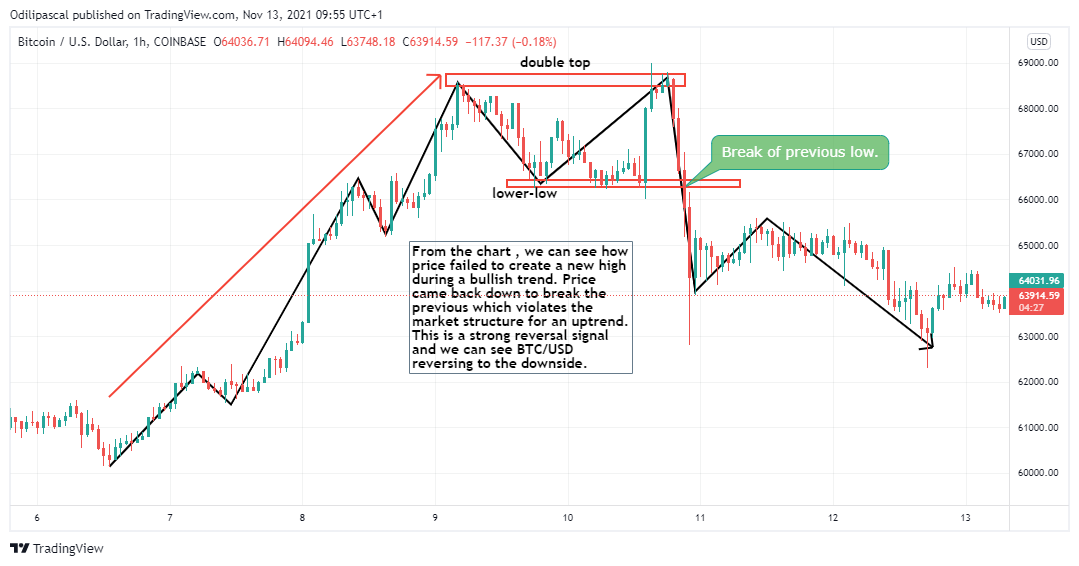
Similarly, after the formation of a double top, price came down to break the previous low point which violates the market structure for an uptrend. This also confirms that the trend has changed from a bullish trend to a bearish one as we tend to see lower high and lower low formation from BTC/USD.
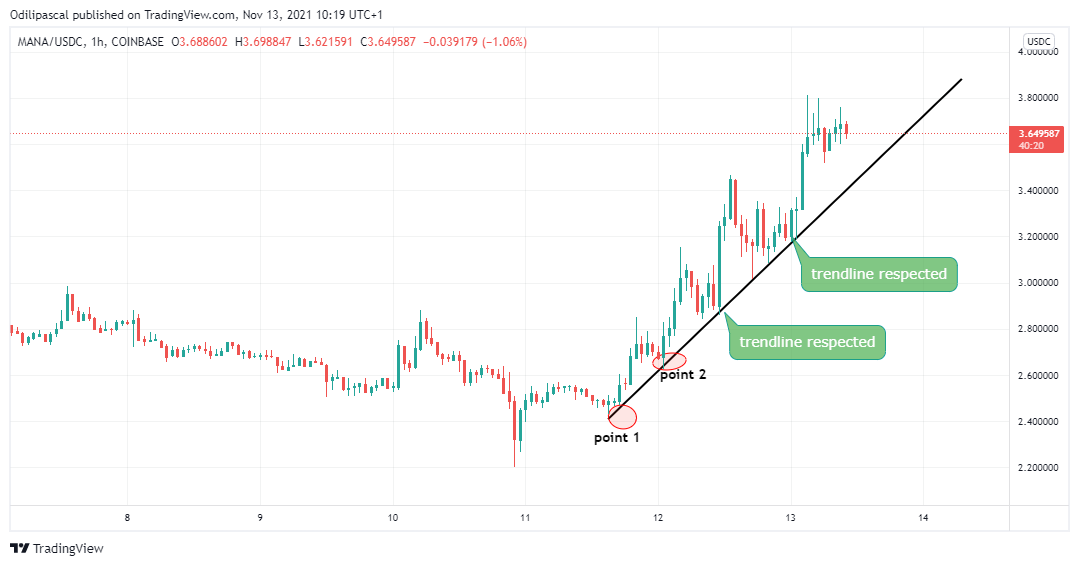
MANA/USDC Chart
From what we have on MANA/USDC, we have a bullish trend structure detected using the trendline. This trendline was drawn using two low points into the future. We can see how price rejects the trendline during retracement to continue the bullish trend. These points can serve as an entry position to keep riding the bullish trend.
If the price should retrace and break the trendline, then this is a signal that the bullish trend is invalidated. Break of the trendline is a trend reversal signal every trader should look out for.
Conclusion
In this lesson, we have discussed trends and how we can identify them using the market structure and trendlines. Understanding trends is an essential step in making a good crypto investment. This will enable you to understand the current state of the market and also predict the next market movement. Similarly, trends also give you a good entry position during retracements/pullbacks.
What we have learned is not a trading strategy for making cryptocurrency investments. It is just a technical analysis tool that aids in making good trading decisions. Ensure that other forms of technical analysis tools are in confluence with the market structure and trendline before making any investment decision.
In the next lesson, we continue our study on trends by focusing on identifying Trend Reversal in the market.
Thank you for being part of this lesson.
Homework Task
Ensure you understand the lesson before performing the homework task. Also, you are required to attempt all the questions and make use of your own Crypto chart. You can use any other cryptocurrency chart apart from BTC/USD.
1) a) What do you understand by a Trending market?
b) What is a bullish and a bearish trend? (screenshot required)
2) Explain the following trend identification and give an example of each of them. (Original screenshot needed from your chart). Do this for a bullish and a bearish trend.
i) Market Structure.
ii) Trendlines
3) Explain trend continuation and how to spot them using market structure and trendlines. (Screenshot needed). Do this for both bullish and bearish trends.
4) Pick up any crypto-asset chart and answer the following questions -
i) Is the market trending?
ii) What is the current market trend? (Use the chart to back up your answers).
5) Conclusion.
Homework Guidelines
- Homework must be posted in Steemit Crypto Academy community. Your homework title format should be " [Your Title] - Crypto Academy / S5W1- Homework Post for @reminiscence01".
- Plagiarism is a great offense in Steemit Crypto Academy and it won’t be tolerated. Ensure you refrain from any form of plagiarism.
- Your post should not contain less than 400 words.
- All images, graphs, and screenshots from external sources should be fully referenced, and ensure to use watermark with your username on your own screenshots.
- Use the tag #reminiscence01-s5week1, #cryptoacademy, #club5050 if eligible and your country tag among the first five tags. Also include other relevant tags like #trend, #trading #cryptocurrency.
- Only users who meet the requirements for #club5050 are eligible to participate in this homework task.
- Homework task run from Sunday 00:00 November 14th to Saturday 11:59 pm November 20th UTC Time.
- Only users with a minimum of 300 SP and having minimum reputation of 55 are eligible to perform this homework. Also, note that you must not be powering down.
- Users who have used upvote tools to gain SP or build their reputation are not eligible for this homework.
- To take part in the Academy you must have powered up a minimum of 150 STEEM in the past month for #club5050 eligibility.
Note: You can only drop your homework link in the comment section if not reviewed after 48 hours.
The comment section is freely opened for suggestions and feedback on the lesson and homework.
Cc: @steemitblog
#club5050 😀
My Assignment
Link
A superb lecture dear professor. Expect my warm entry soon !!
Thank you. I'm looking forward to your entry.
Nice lecture professor, I look forward in participating!
Thank you. I'm looking forward to your entry.
Saludo profe dígame si soy elegible para el # 5050 y si no lo soy no podré hacer su curso dígame por favor y cuánto tiempo me faltaría para hacerlo gracias porfesor y disculpe la molestia
Kindly visit @steemitblog for recent update on #club5050 eligibility.
Prof @reminiscence01.. am I eligible
Kindly visit @steemitblog for recent update on #club5050 eligibility.
Greetings Professor, what if someone didn't cash out/withdraw his earning instead he saved the (SBD) is he eligible for club5050?
I think it's better to power up 50% of your earnings. You can save the remaining SBD.
I've checked the tool for my #club5050 status but honestly I'm confused
I still don't know the exact amount of steem to power up to be eligible
Can you help please?
Check the amount of Steem you have cashed out in the last 30days and power up a greater or equal amount of that.
En los ultimos 30 dias ganaste 9.86SBD, solo hiciste powerup del 27.5% de esa cantidad, aun te falta hacer powerup de un 25% mas para pertenecer al club
I just did some power up now. I'm I now eligible?
Professor do i am eligible?
Please read the homework guidelines to check your eligibility.
Ok professor
What do u mean by club5050 requirements
How can someone check if he met it and again
Wot if I have only earned once in last one month and powered up half of what I earned ?
You can visit @steemitblog for update on #club5050.
To be eligible,it is required that you have powered up equal or greater amount of Steem you have cashed out.
Within a month right ?
Yes.
Sorry I keep disturbing
Okay now I have earned just once in a month and powered half up
I am eligible bah
Hola amigo, en el periodo de un mes retiraste todas tus recompensas. Puedes verificarlo en https://www.steemcryptic.me/club5050
Doesn't show on phone should I use a laptop
Refresh your page and input the details. again. Make sure you set the start date one month back.
Yes. You are eligible if the information is correct.
I just powered up equal to the amount I powered down
You can check my history am I eligible now ?
You are not eligible. In the last one month, you have cashed out 384.79 Steem but have powered up only 278.78 Steem. You need to power up equal amount or more than the Steem you have cashed out.
I hope this is clear.
Hi @reminiscence01,
I've not been active on Steemit in the past one month, am I eligible for the homework?
You need to meet the requirements to participate in the homework task. Kindly read the homework guidelines for eligibility criteria.
Profesor yo puedo participar este mes? @reminiscence01