[CRYPTO TRADING STRATEGY WITH MEDIAN INDICATOR]- Steemit Crypto Academy- Homework post for Professor @abdu.navi03 by @roma078
I'm glad to be part of this lecture. I'm hoping to do my best and get the possible best mark i could get.

lets get started...
1-Explain your understanding with the median indicator.

Technical indicators are one of the most important tools to traders and investors for their daily trading activities. They help to predict future price of assets and there is no doubt the Median Indicator is one of them. The Median Indicator is a trend based indicator similar to the moving average, ichimoku cloud, MACD etc. where they are used to identify trends of an asset. The median indicator has a different and special way of measuring volatility using a channel created using the ATR value from the median line.
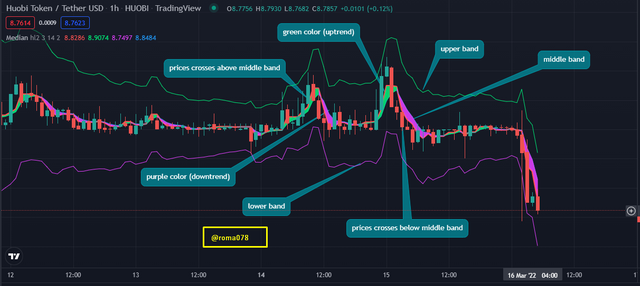
The middle band of the indicator shows different colors and every color have what they indicates and represents. A switch from purple to green indicates the price will be in bullish likewise a switch from green to purple indicates the price will go bearish as well. When the middle band crosses above the price it indicates bullish also when the price crosses below the price it indicates the confirmation of bearish movement. These is a confirmation to the color change signals.
The indicator also has the upper and lower band which is used to determine the volatility of the market. This feature is similar to the Ichimoku Cloud.
2-Parameters and Calculations of Median indicator. (Screenshot required)
We will have to navigate to a price chart preferable to TradingView platform to get access to its parameter;
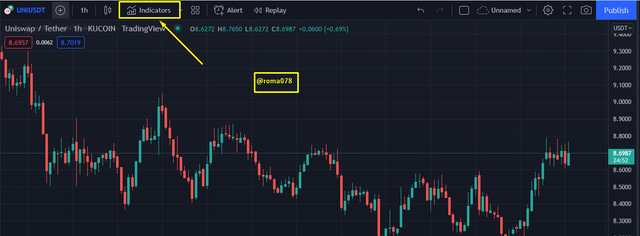
a. Lets navigate to TradingView and get to the chart of any pair of your choice.
b. Now we click on the indicators menu and search for our median indicator and click on it to get applied onto our chart.
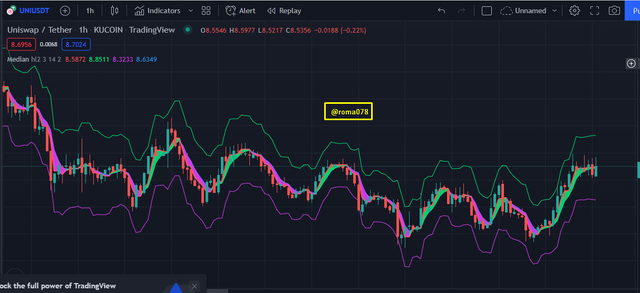
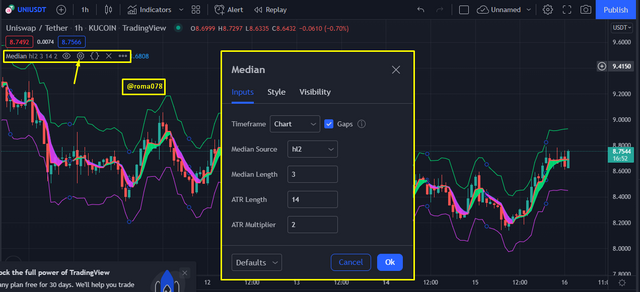
c. After the indicator is been applied on the chart, we move our pointer to the indicator settings and click on it to display the parameters of the indicator. The parameters include time frame, median length, ATR length, median source ATR multiplier etc. All these parameters can be altered to best suit the trader on their style of trade.
Calculating the median indicator has to do with the the difference in percentages between both the median and EMA values for a specific period of time. The calculations are shown below;
Median Value = (highest price + lowers price) / 2
Exponential moving average = Closing price x multiplier = previous day EMA x multiplier x (1- multiplier)
There are also some other parameters we need to consider as well which are;
Median length = period of observation*
Upper band = Median Length + (2ATR)
Lower band = Median length - (2ATR)
The median indicator is able to workout the median value with the consideration of the percentage value between both the median and EMA value on the chosen range or the specific interval.
The median indicator reads and check for the differences between both the exponential moving average and the median value analyzing which one is higher or lower then the other.
In a case where the EMA is higher than te median value, a purple could is formed which indicates a downtrend and likewise if the median is higher than the EMA, a green color is shown indicating a downtrend market.
3-Uptrend from Median indicator (screenshot required)
This indicator helps traders to identify buying and selling opportunities to minimize losses and maximize profits as not all trades will go well with traders since there are false signals given by all indicators.
With the Median indicator, it signal an uptrend when the median indicator cloud changes from purple to green thus when the median value is higher then the EMA value. It also serves as a buy opportunity when the price movement move above the green cloud.
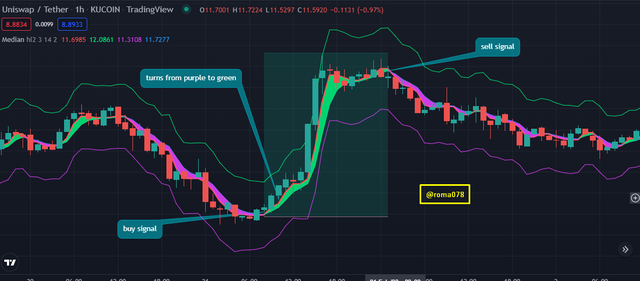
We can see from the chart above, the cloud changed color from purple to green which indicates the bullish trend and soon after that the price starts to move in a bullish trend. While i hodl for a while the green cloud changed back to purple which tells me to exit the market because a bearish trend is about to take place. Crossing of price above the cloud also indicates a bullish trend.
4-Downtrend from Median Indicator (screenshot required)
Just like the uptrend, the indicator indicates selling and buying opportunities for downtrend movement to gain profits and minimize looses since all indicators gives false signals so sometimes we don't get our predictions right.
The median indicator is able to tell a trader on buying and selling opportunities base on its color changes and price movement. For downtrend color changes from green to purple telling trader to make an exit from the market to avoid looses and get back to the market after the downtrend movement is exhausted. We can also confirm these signal when the price movement is below the purple cloud which indicates downtrend movement.
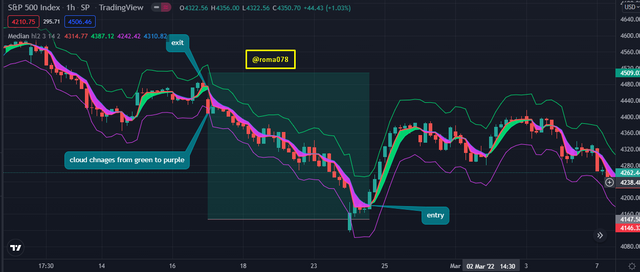
Considering the chart above, we can see the cloud changes it color from green to pruple and seen after that the price starts to move in a bearish direction. This helped me to minimize my looses and get back to the market after the the loud changes back from purple to green which we can see on the chart above.
5-Identifying fake Signals with Median indicator(screenshot required)
As I said already, all indicators gives wrong signals sometimes in our trades but its up to us the traders to point out this moments so as to avoid wrong trade decisions which could hurts us by loosing funds. Therefore the median indicator has the ability to also give wrong signals times to time. The good news is that, we can identify and point out these moments by using multiple indicators that help us fish out the false signals.
In my case i will be using the RSI indicator which is a trend-based indicator. This indicator has its own way of reading these signals which is different from the median indicator. The RSI indicator has a range from 0 - 100, where as from 70 above is the overbought region indicating the price will reverse back to downtrend. Also 30 and below is the oversold region which indicates the price will reverse in the bullish movement. Lets take a look at a chart on how to use the RSI to filter it out;
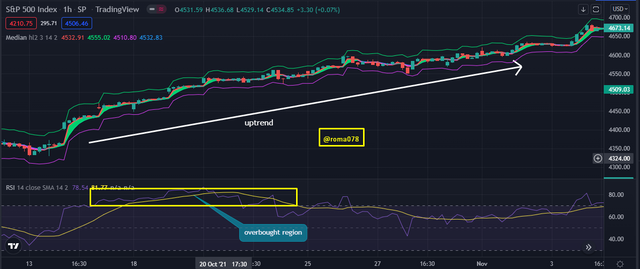
From my chart above, we noticed the price went into the overbought region on the RSi indicator but tracing it back onto the price of the pair, it didn't make any reversal but rather went up in an uptrend. This false signal makes a trader losses profit opportunity since he will be exit the market to avoid losses.
6-Open two demo trades, long and short, with the help of a median indicator or combination that includes a median indicator (screenshot required)
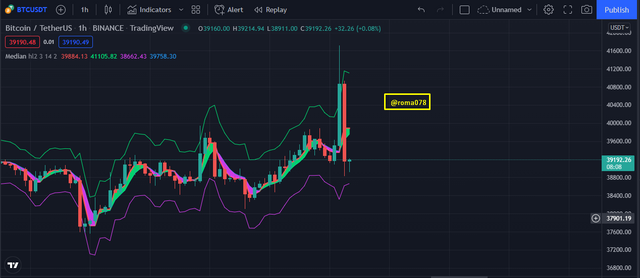
The Image above is a 1 hour candle stick chart of BTCUSDT pair. I will be placing my buy order on this pair. The first thing i look out for in this chart is the green cloud which is an indication of entry to the market. On this chart we can see its currently switched from purple cloud to green cloud giving us the greenlight to get into the market.
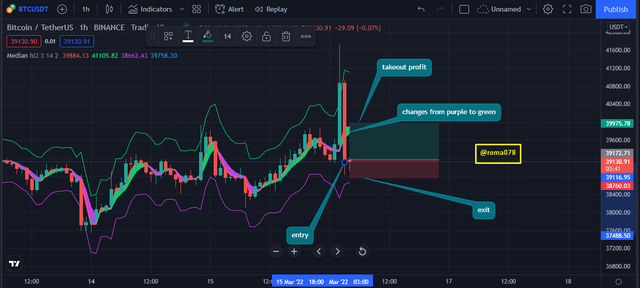
I made a buy position with my stop loss and takeout profit as well. The ratio of profit to loss in this trade is 1:9.
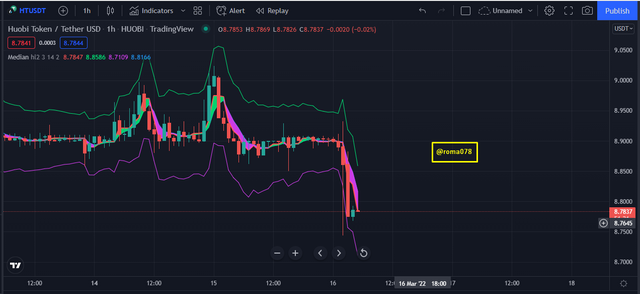
The above chart is a 1 hours candle stick of the pair HTUSDT. I spotted a sell position with the use of the median indicator and placed my order on this pair. We can see from the chart the color changed from green to purple which indicates that the price will go in bearish. While i monitor the chart
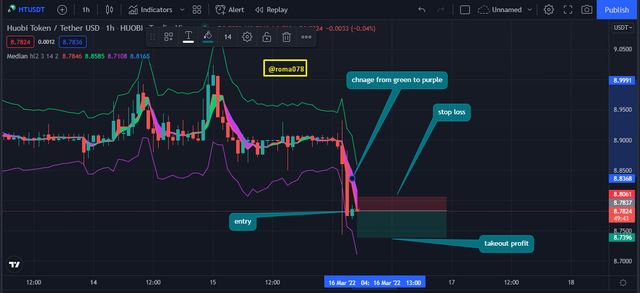
I made my entry position, stop loss and also my takeout profit to manage my trade very well.