[Crypto Trading with Moving Average]- Steemit Crypto Academy | S6W2 | Homework Post for @shemul21
Hello everyone!
I will be presenting the homework task given by professor @shemul21 which is about Crypto Trading using Moving Average Indicator.

Explain Your Understanding of Moving Average.
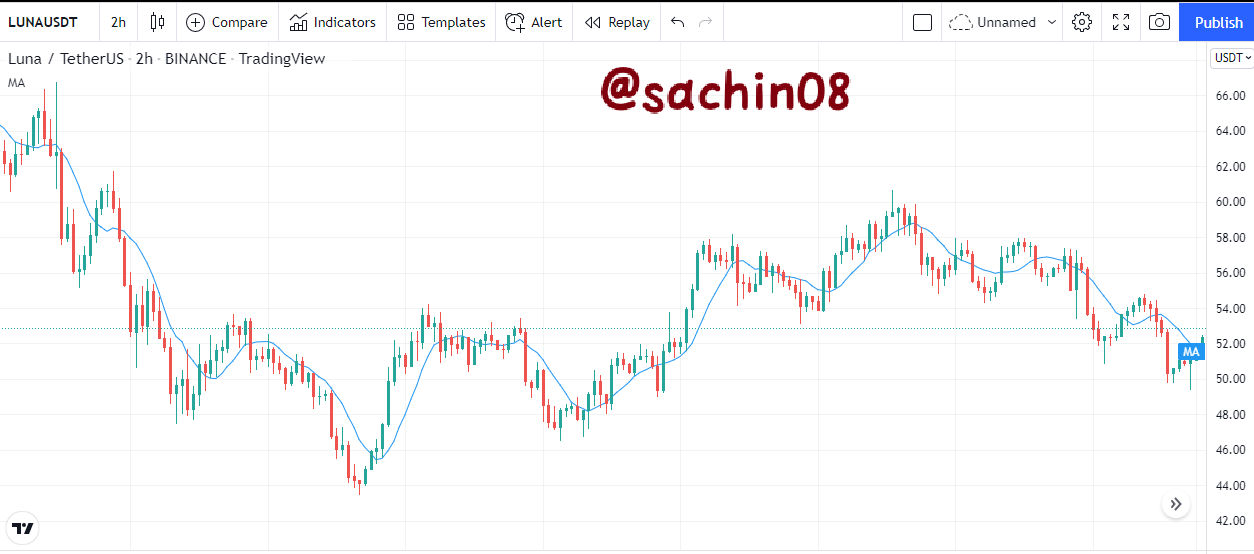
Moving Average is a technical indicator which is very popular in trading and is widely used by traders. Traders use this indicator to identify the ongoing and upcoming trend.
This indicator is based on the price data of the market and calculate the direction of the trend according to latest price data over a specific time period. It indicates average value of the price over a specific time period.
Moving Average (MA) Indicator provides average price data in the market. We can identify direction of trends and trend reversals.
We can also determine entry and exit points by using MA Indicator. It filters out noise and disturbance from the chart which makes it easy for the trader to read price charts.
When MA Indicator moves above the price, then it shows the trend is downward and When MA Indicator remains below the price, then it shows the trend is upward.
We can also determine entry/exit Points from MA Indicator at the time when this indicator changes it's position with respect to price and indicates trend reversal.
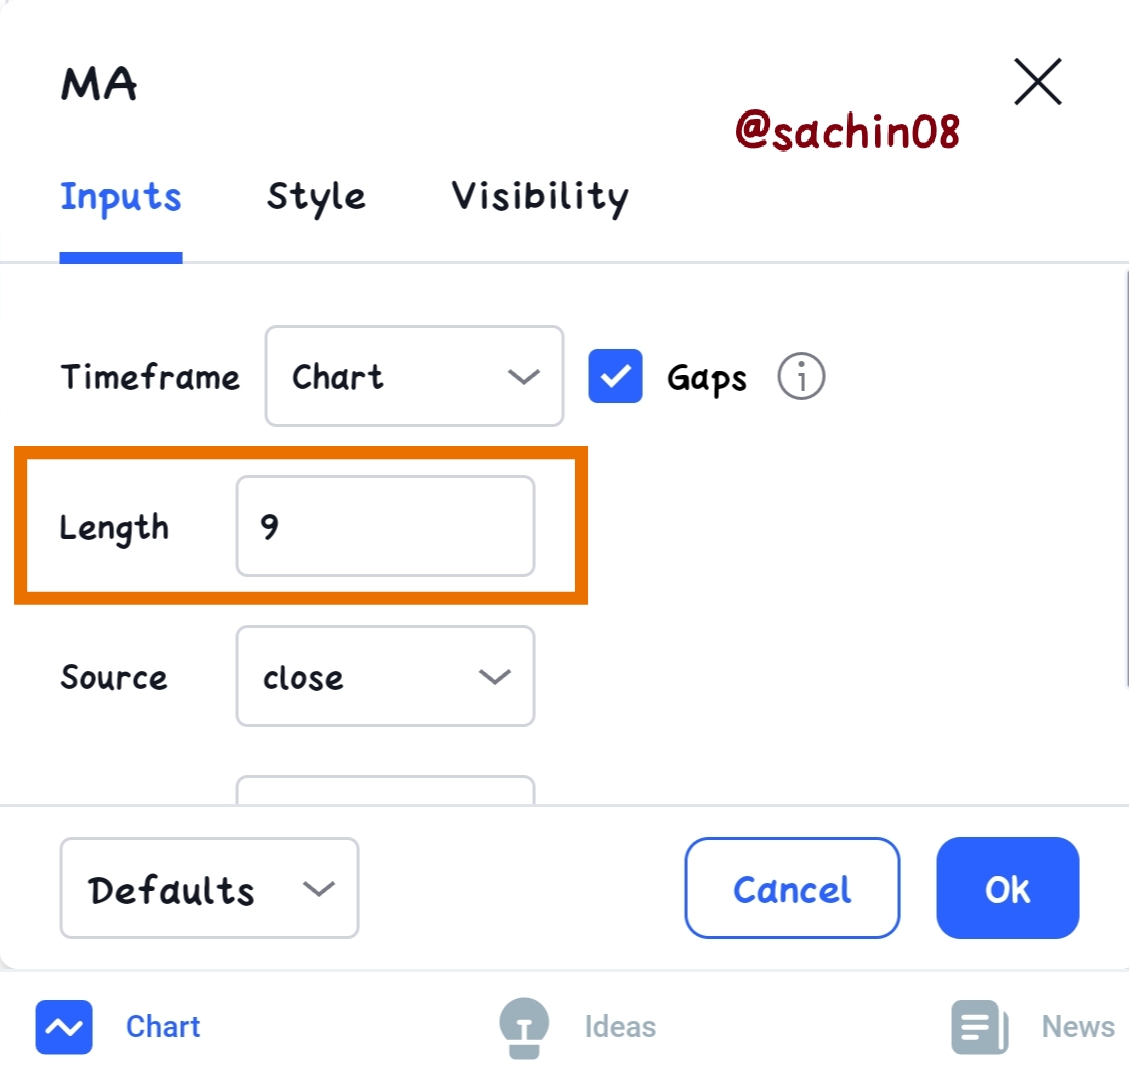
Settings of Moving Average Indicator
We can also customize settings of Moving Average Indicator as per our choice. We can easily set and customize length of MA Indicator as per our choice as you can see in the image below.
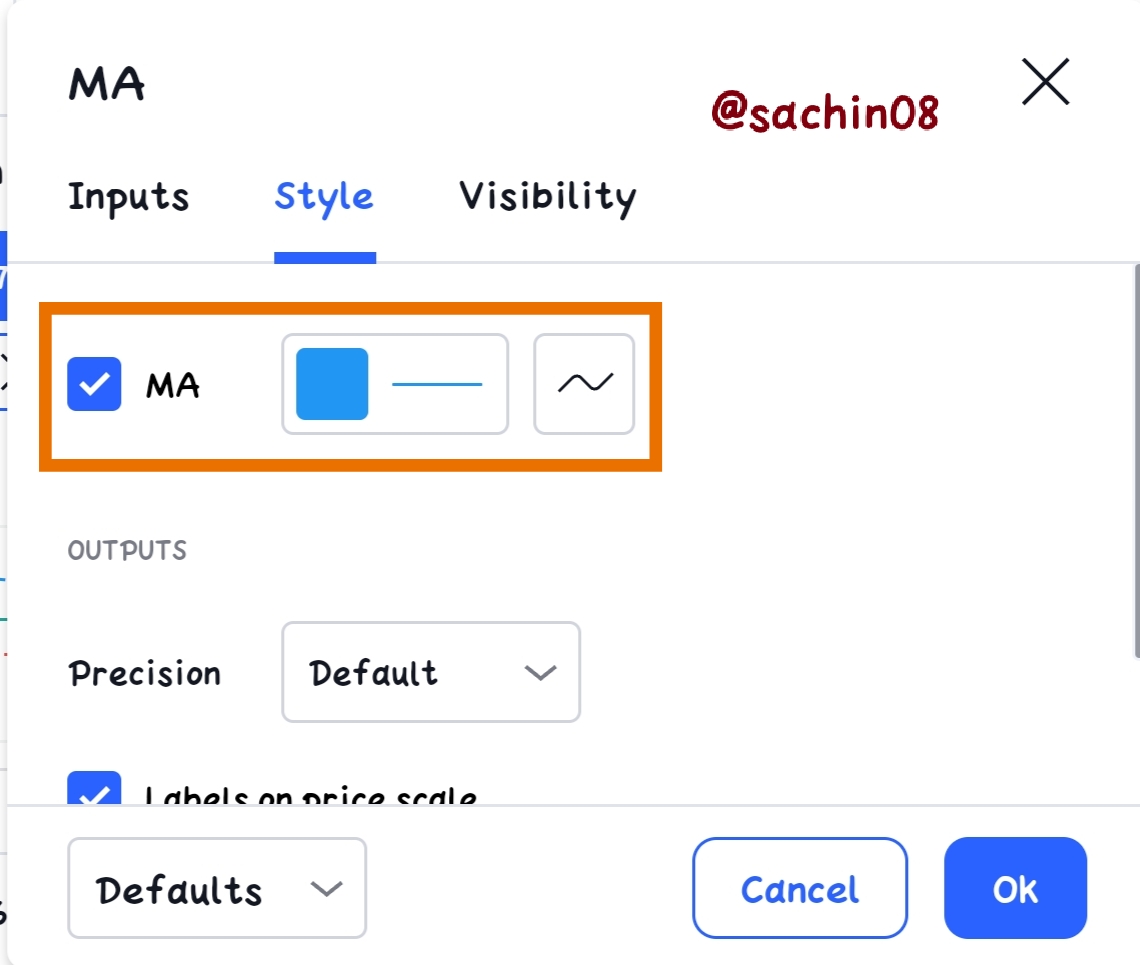
We can also set the colour of MA and thickness of MA Indicator line as per our choice as you can see in the image below.
2. What Are The Different Types of Moving Average? Differentiate Between Them.
Well, There are main three types of Moving Average Indicators which generally used by traders in day to day trading.
Simple Moving Average (SMA) Indicator
Exponential Moving Average (EMA) Indicator
Weighted Moving Average (WMA) Indicator
Let's discuss about all these three types of Indicators.
Simple Moving Average (SMA)
SMA Indicator is basically the average price in a particular time period. It helps traders by identifying all the values of price and give and an exact average price which leads in the identification of the direction of trend.
When SMA comes below the price, then it is a sign of upward trend and When SMA comes above the price, then it is a sign of bearish trend.
We can also customize the settings of SMA Indicator. If we set the period of SMA to longer time, then It will help us in long term trades and If we set it's length to short time period, then it will help us in short term trades.
Formula of Simple Moving Average
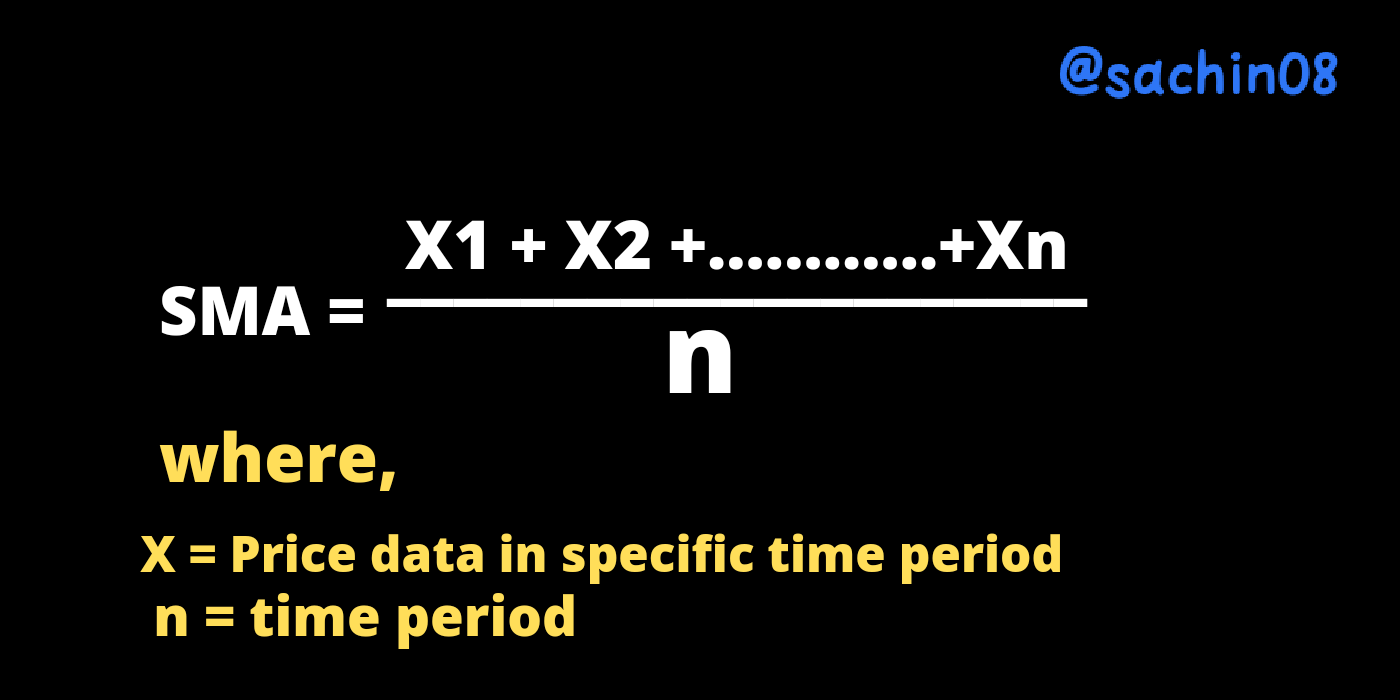
Exponential Moving Average (EMA)
EMA Indicator is somehow very similar to SMA Indicator. EMA Indicator applies more weightage to the data in the current trend. It helps in identifying the direction of the trend.
It takes the price data in a accurate manner and just because of it's well determined calculation, it provides more precise average data.
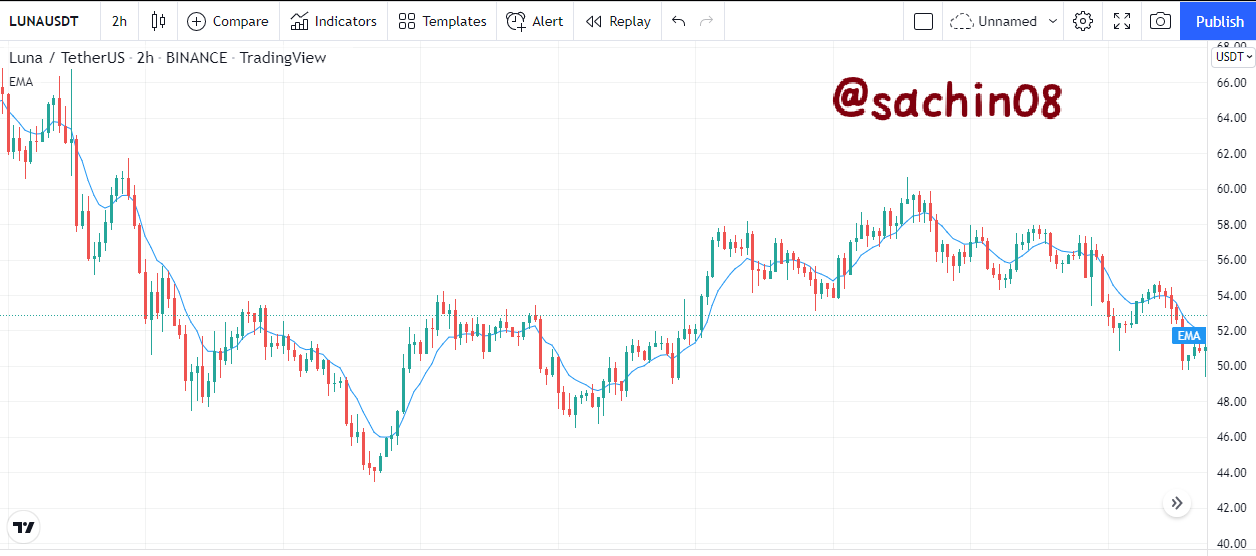
We can consider a Rising EMA as a bullish signal and a Falling EMA as a bearish signal. We can also take entry and exit points with the help of EMA.
Here is an example of EMA Indicator on the chart-
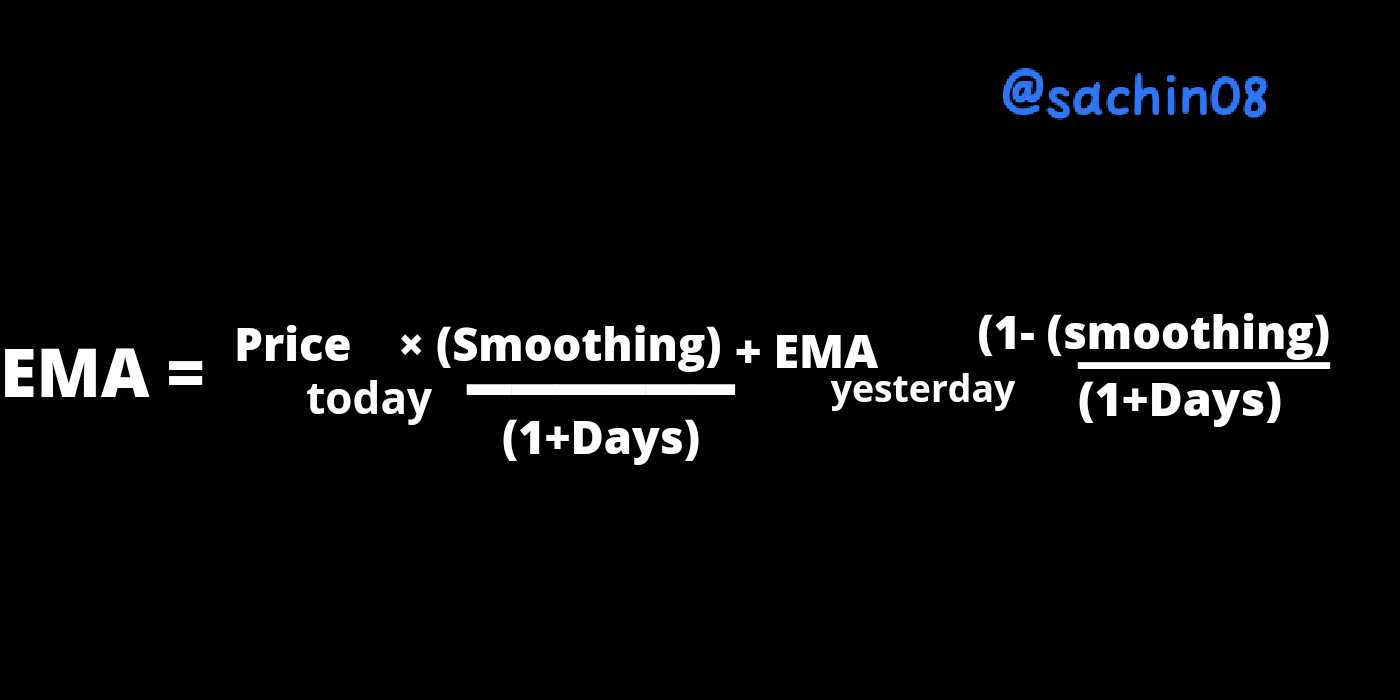
Formula of Exponential Moving Average
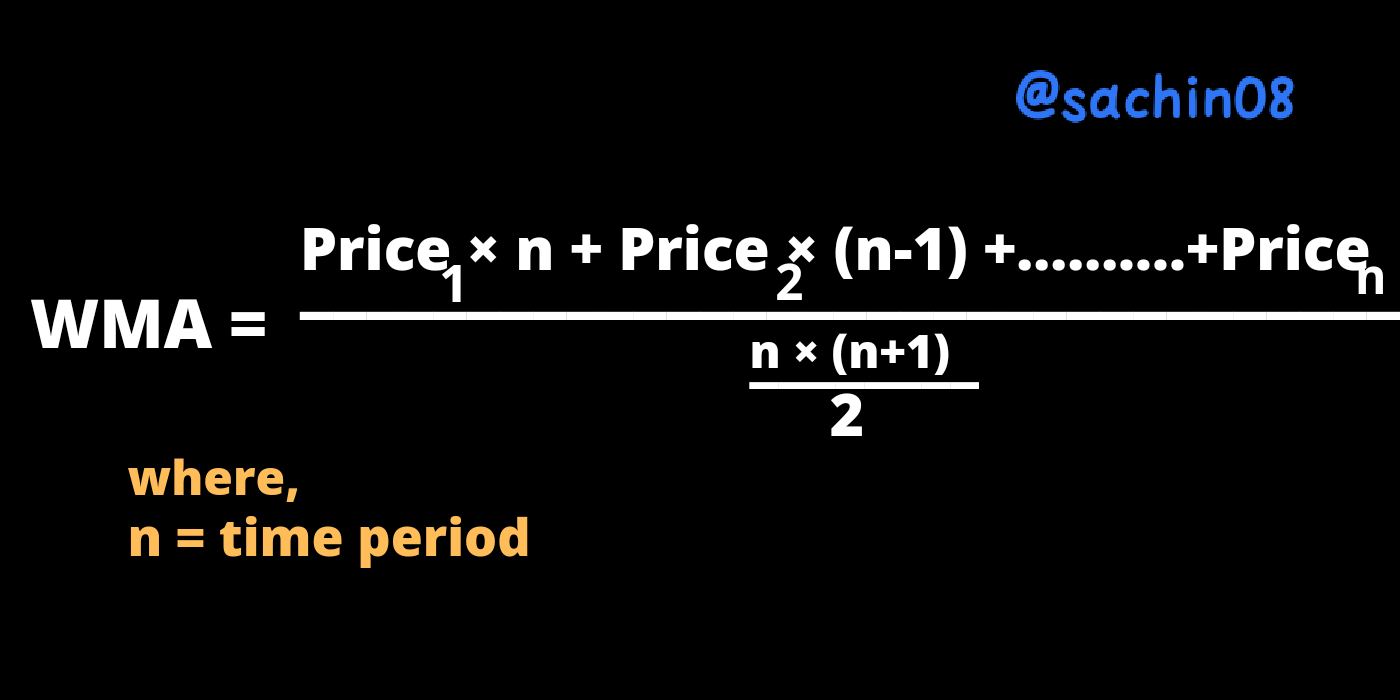
Weighted Moving Average (WMA)
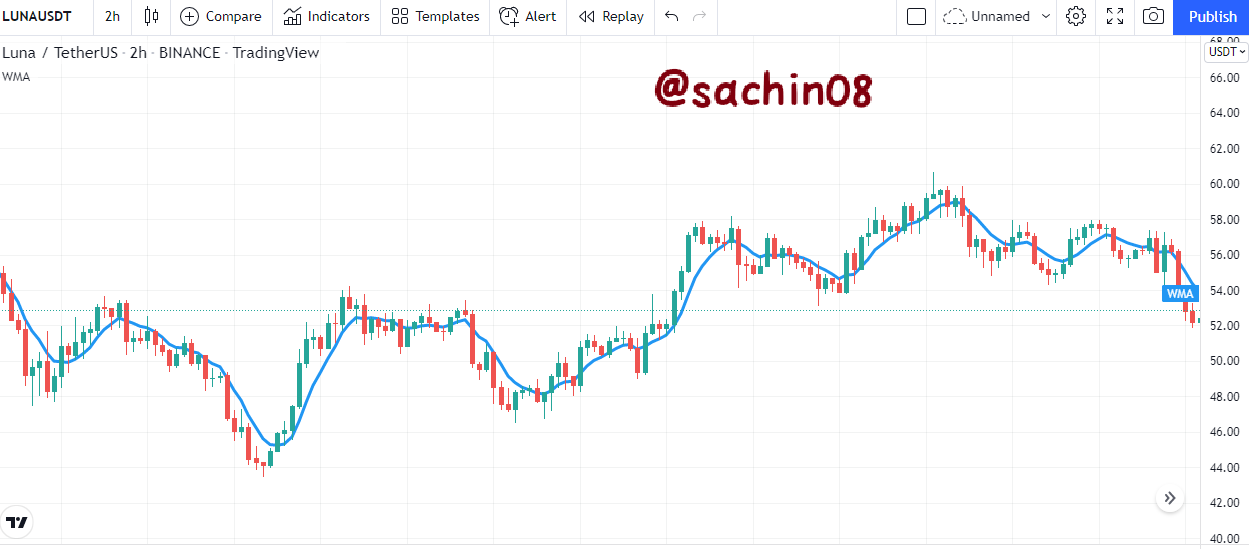
WMA Indicator helps in identifying the direction of the trend. It applies more weight to the recent price data and takes into consideration and applies less weightage to previous price data.
It helps in identifying the market price movements by taking some recent price data into consideration. WMA Indicator determines average value by multiplying price data and then summing up the resulting data to find out the average value.
Here is an example of WMA Indicator on the chart-
*Formula of Exponential Moving Average

Difference between SMA, EMA and WMA
| SMA | EMA | WMA |
|---|---|---|
| It calculates average price over a particular time period. | It calculates on the basis of current trend and data. | It basically focus on the most recent price data and then calculates average. |
| SMA is overall slow indicator in all these three types of MA. | EMA is faster than SMA and WMA because it focus on current trend price data. | WMA is faster than SMA as it gives more weightage to most recent price data. |
| SMA is beneficial in long term trades. | EMA is beneficial in short term trades. | WMA is also beneficial in short term trades. |
| SMA will be beneficial with long period length. | EMA will be beneficial with short period length. | WMA can be beneficial with both short and long period length. |
3. Identify Entry and Exit Points Using Moving Average. (Demonstrate with Screenshots)
As I have already mentioned that SMA is very beneficial in long term trades and EMA is beneficial in short term trades. So, I will use these indicators according to it's variability and will identify entry and exit points.
We can combine both EMA and SMA at same time to determine both short term trades and long term trades. It will easier to identify entry and exit points with the help of both SMA and EMA.
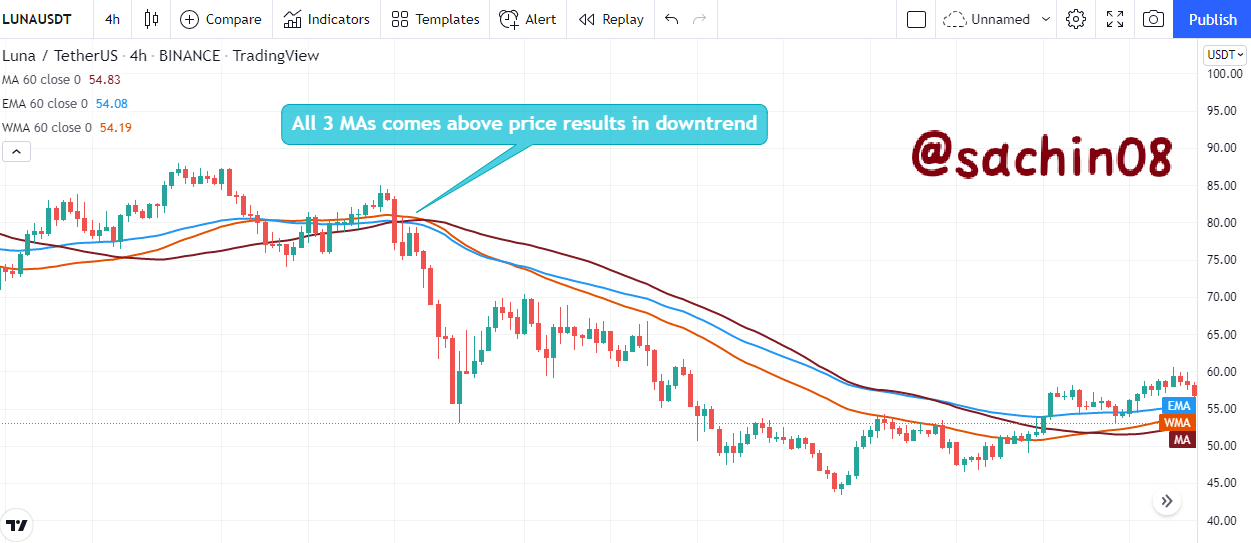
As you can see in the above image, I have applied 60 days SMA, 60 days EMA and 60 days WMA Indicators in the chart. When all these three indicators comes above the price, then price has taken a bearish move which shows the results of MAs Indicators.
We can also find out entry and exit points if we apply these Moving Average Indicators on the chart. Now, I am going to show Entry and Exit points using Moving Average.
Entry Point
I will be using SMA and EMA Indicators here as these indicators are good in short term as well as long term trades.
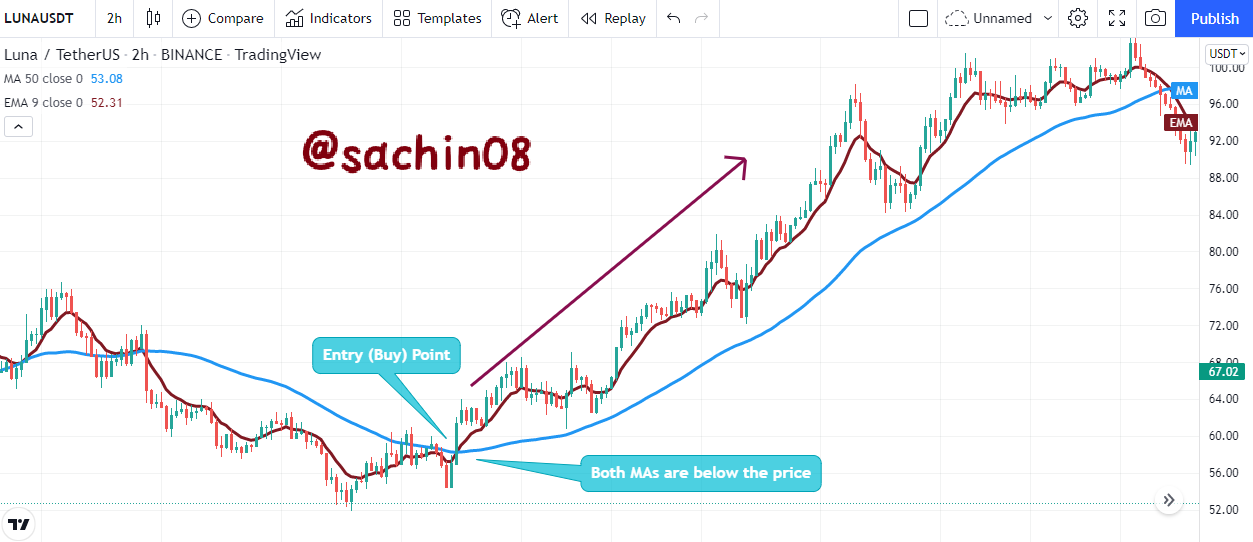
From the above image, I have used 50 days SMA and 9 days EMA in the chart and When these both indicators comes below the price, then that point will be considered as our Entry point or Buy Signal.
We can take our entry at that point and I have mentioned necessary things on the image also.
Now, I will show an example of Entry point using all three types of Moving Average.
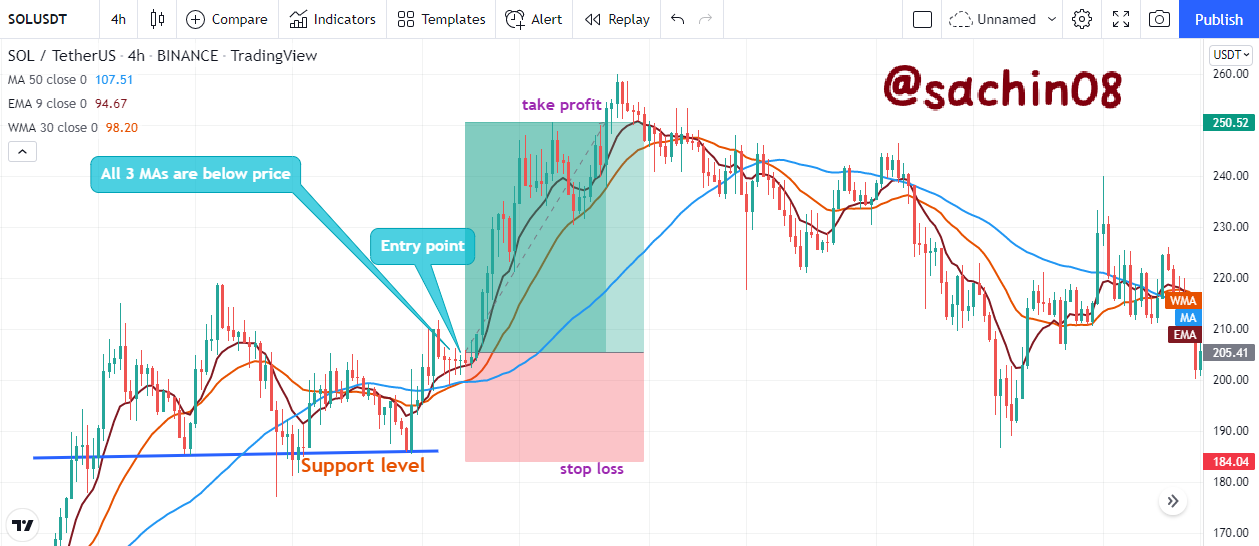
From the above image, I have used 50 days SMA, 9 days EMA and 30 days WMA Indicators for determining entry point for our trade.
I have mentioned a point in the image at which all three indicators are below the price which indicates a strong sign of bullish move by the price.
And hence, I have taken entry at that point and as a result, the price moved in upward direction and We can book our profit in this type trade until any of the Moving Average comes below the price.
Exit Point
I have used 50 days SMA and 9 days EMA in the chart and Here is the example of Exit Point using Moving Average Indicator.
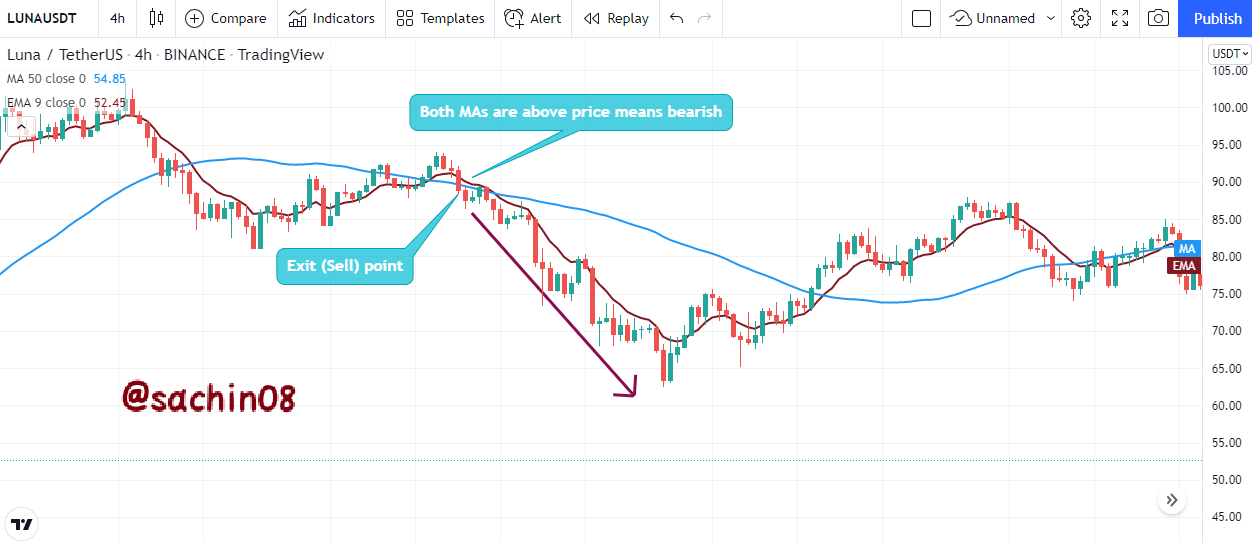
You can see in the above image, I have mentioned a point where both SMA and EMA are above the price which indicates bearish signal and hence, I have marked that point as Exit point and this can be our Sell Signal.
4. What do you understand by Crossover? Explain in Your Own Words.
Moving Average Crossover means that We should combine same type of moving average on the chart instead of using single one.
Likewise We can combine two EMAs of different length for better clarification. I will prefer two EMAs of 50 days period length and 200 days period length.
The EMA of shorter length i.e. 50 days period length will be faster than the EMA of 200 days period as 50 days EMA will be closer to the price movement and will react even with small movement in the price whereas 200 days period EMA will move according to long term.
Here is an example of both these EMAs on the chart -
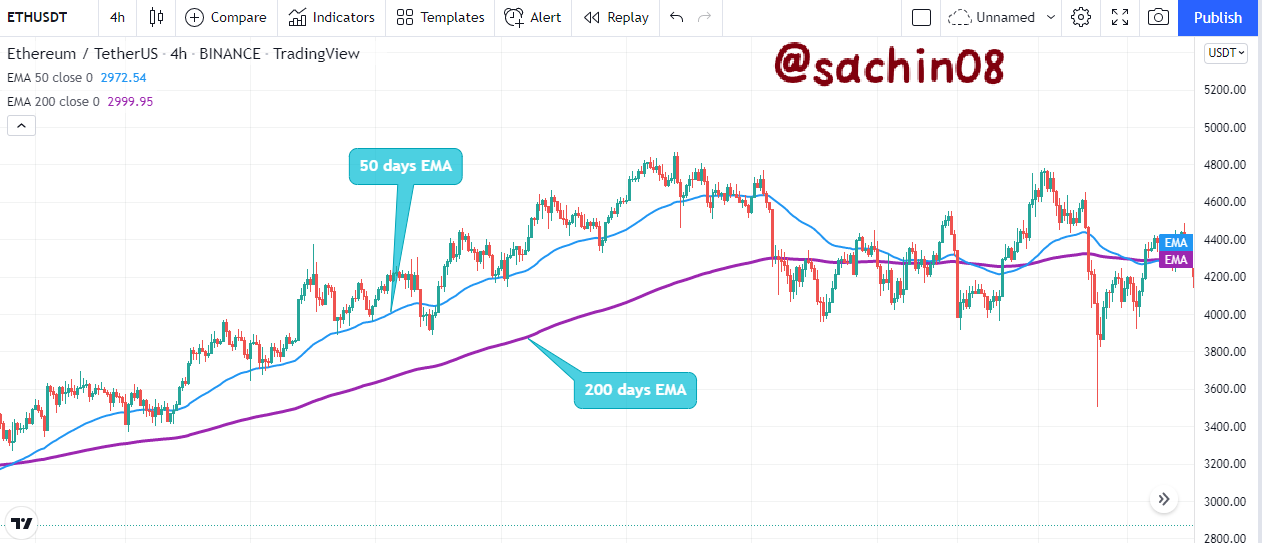
From the above image, You can see I have combined 50 days EMA which is in blue colour and 200 days EMA in violet colour in the chart.
We can easily determine entry and exit points by using crossover strategy of moving average. Combining 200 days EMA will also help in long term trades.
Now, Let me tell you about how to find entry and exit points using Crossover strategy.
If shorter period EMA exceeds the longer period EMA or If shorter period EMA comes above longer period EMA, then We can take entry at that period or that can be our buy signal.
If shorter period EMA comes below the longer period EMA, then We can consider that point as our Sell Signal or Exit point or We can open Short position at that point.
Now, I will present some trade setup using Crossover strategy of Moving Average.
Entry Point
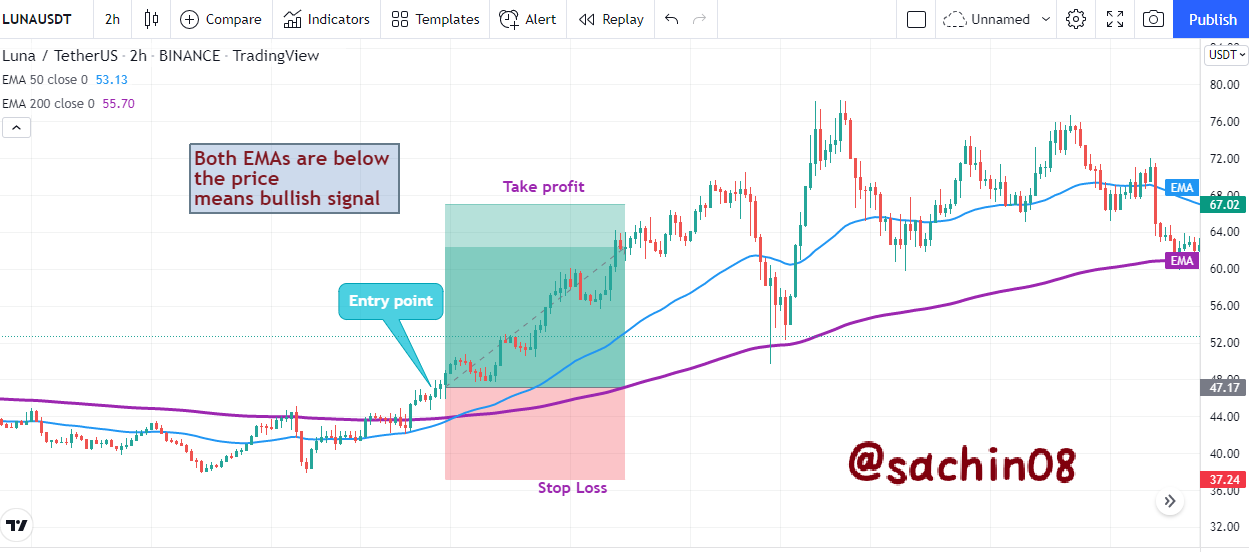
As you can see in the above image, I have mentioned a point where 50 days EMA comes above 200 days EMA and hence, I have marked entry point at that point.
As a result, Price move into our desired direction and We can also book our profit at the time when this condition reverse. I have mentioned both stop loss and take profit level in the chart itself.
Exit Point
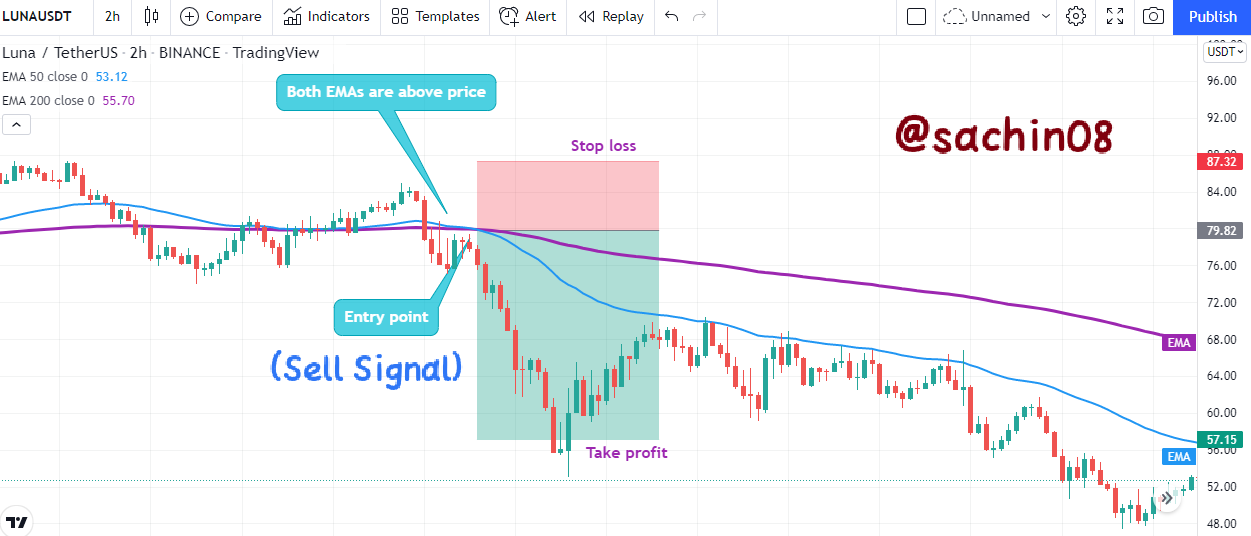
From the above image, I have marked a point where 50 days EMA comes below the 200 days EMA and hence, We can exit our long position at that point or We can open Short position at that point.
I have also marked Take profit level and stop loss level in the image and We can take our profit at the time when this condition reverse.
5. Explain The Limitations of Moving Average.
Moving Average Indicator has many benefits and It is widely used by traders. Apart from benefits, It also has some limitations which I will discuss here.
It does not take some date into consideration like the data which is not included in the calculation of average data.
This indicator don't respond to down fluctuations and complex movement of the price in a certain period.
There is also lag in this indicator which results in receiving signal too late in case of trend reversal.
It can also give false signals sometimes whenever there is some complex or sudden fluctuations in the price movement.
The data used my moving average can also be revised and hence, the signals can also be revised signals which results in false signals.
Conclusion
It was a wonderful lecture about Crypto Trading with Moving Average Indicator. I have discussed all about Moving Average Indicator in this post.
Moving Average indicator is very useful indicator and it's types are also very helpful in trading and We can also apply Crossover strategy to determine entry and exit points.
Thanks to professor @shemul21 for providing this lecture.
Note - All images are taken from TradingView