Steemit Crypto Academy Season 5 Week 2 [Beginner's Course] - Recognizing Simple Patterns in Trading


Introduction
Hello everyone!
This is my first lesson as a Crypto Academy Professor and I am glad that I am sharing knowledge to you all. I welcome you all to the Second Week of Season 5 of Steemit Crypto Academy.
This Lesson is about Recognizing Simple Patterns in Trading.
In Pattern Trading, the main aim is to hit the breakout point and then exploit the resulting strong price movements. To determine these points in advance, We will find out it in more detail in the following topics. So, Let's get started.
Triangles
This is the first Chart Pattern. Triangles can be the easiest type of patterns to trade for beginners. They are of three forms. There are symmetrical triangle (neutral version), ascending triangle (bullish version) and descending triangle (bearish version).
With these Patterns, We can clearly define some outcomes and targets and We can even get a clue for the time when it should breakout. Let's take a view at Ascending Triangle and We will find out How does an Ascending Triangle behave?
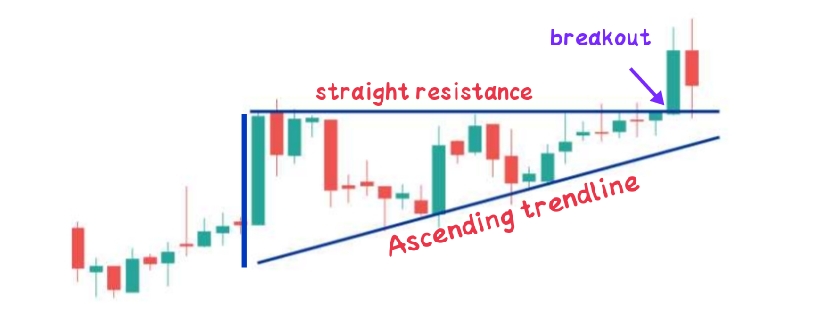
Ascending Triangle can be recognized by the fact that the asset price always bounces off the same upper price level. You should note that, after bouncing, it does not falls lower at the lower edge than before. In this case, We have to trade the breakout from the triangle upwards as because it is a bullish pattern.
For trade or entry point, Take a close look at the horizontal line which is straight or flat resistance and then choose an entry point that is just above it. Set the stop loss just below the rising edge of the triangle.
At the moment of Breakout, there will be a volume peak which will be higher than the previous ones.
The same is apply for the bearish descending triangle. Just mirror it in the other direction. Now, let's talk about Symmetrical Triangle.
Symmetrical Triangle
Symmetrical Triangle is slightly different from ascending and descending triangle.
It offers a breakout chance of 50% in both the directions.
This is somehow tricky, but We can trade it by taking our entry point for long above the lowest upper price and a short below the highest lower price. There is no horizontal line in Symmetrical Triangle. Let's take a view at Symmetrical Triangle.
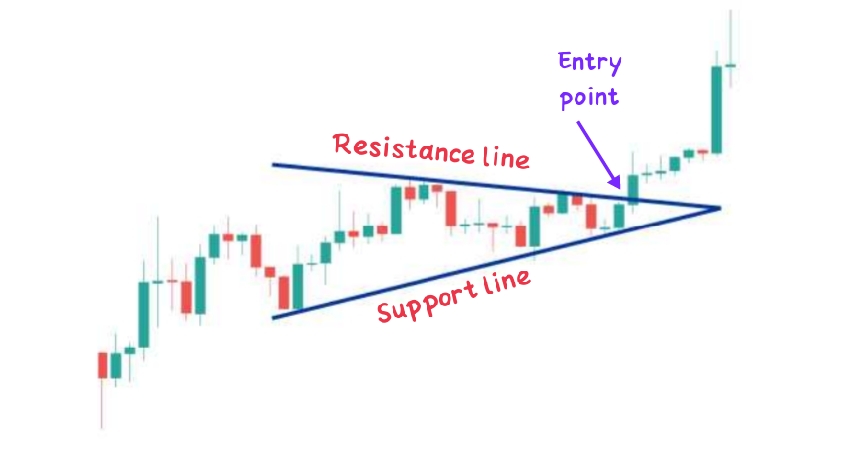
From above image, You can see that there is Support line and Resistance line in Symmetrical Triangle. In above image, It broke the resistance line, We can long at that point or there will be bullish move. If it breaks the Support line, then there will be bearish move and We can short at that point. We have to take entry point only after that the price breaks one of these lines.
Flags
Even more beautiful Triangles can be seen now which are so-called Flags. They are even more beautiful because the corresponding targets are much more profitable with accurate trade.
The Flag pattern occurs after a strong or sharp move by the price in the market and then, It make a flag shaped pattern and after that, It takes a strong move.
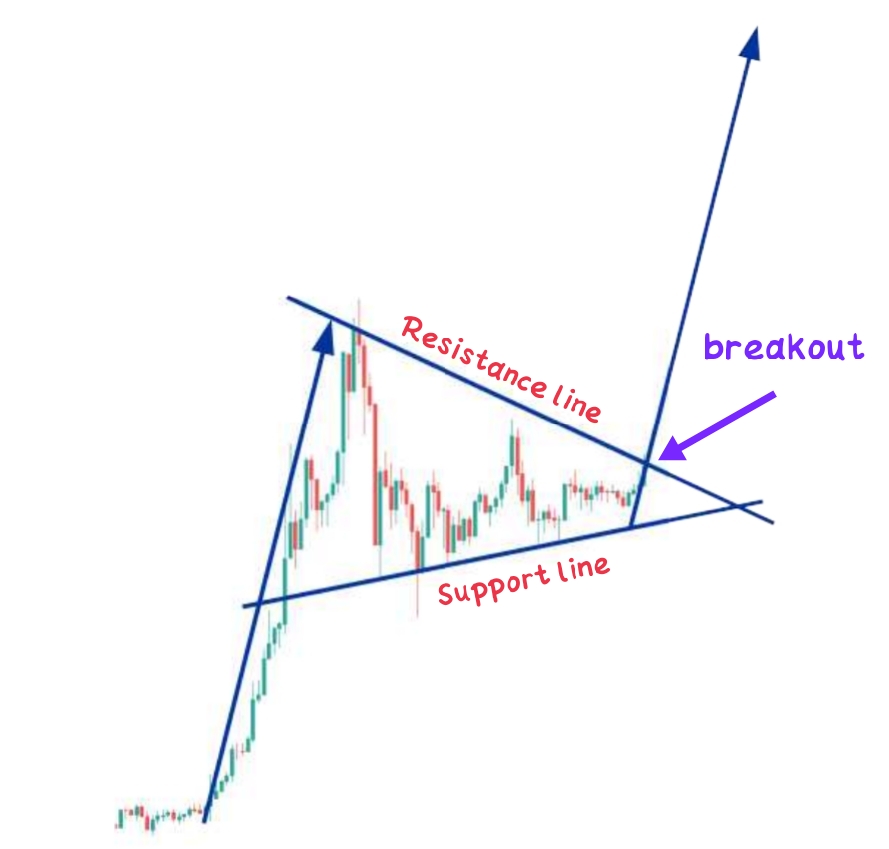
The above image is an example of Bull Flag. When the price make a Flag pattern after making an impulsive bullish move and that Flag pattern pointing in downside direction, then We can say that It is a Bull Flag and We have to consider Resistance line and Support line and When the Price breaks the Resistance Line, that Point is considered as our Entry Point.
For Bear Flag, When a price makes a Flag pattern after making an impulsive bearish move, and that Flag pattern pointing in upside direction, then We can say that It is about to make a reversal and When it breaks the support line, We can consider that Point as our Entry point to Short.
Flags of this type don't necessarily have to be pointed, as shown in the above image, the top and bottom lines can just as well be parallel. The best performance is offered by the flag pointing downward in the Bullish Version.
This Pattern, like many others, has a Bull Flag and Bear Flag. In the above image, We looked at a Bull Flag. Bear Flag appear in the chart after a massive sellout.
How to trade using these Patterns?
Now, I will show you some trade setups using these Trading Patterns in Chart.
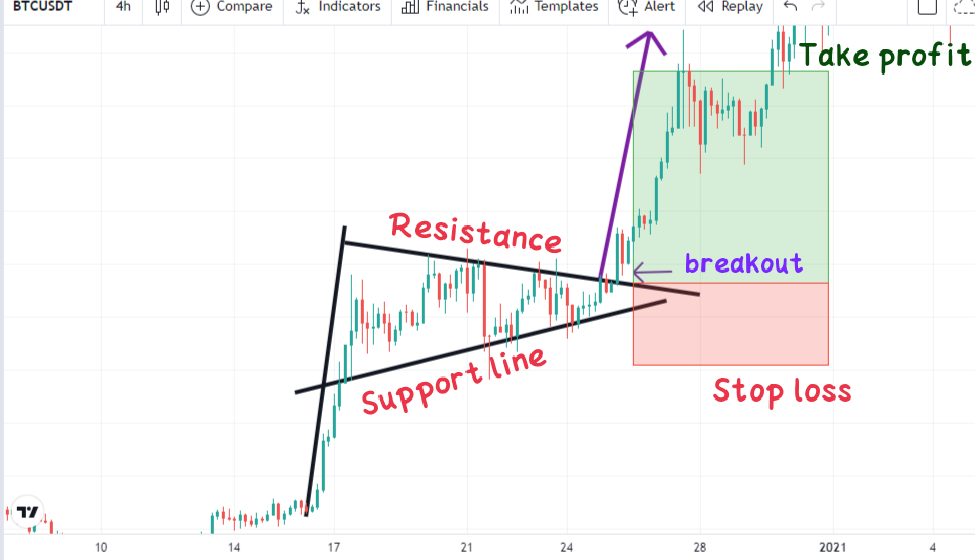
- Trade Setup using Ascending Triangle -
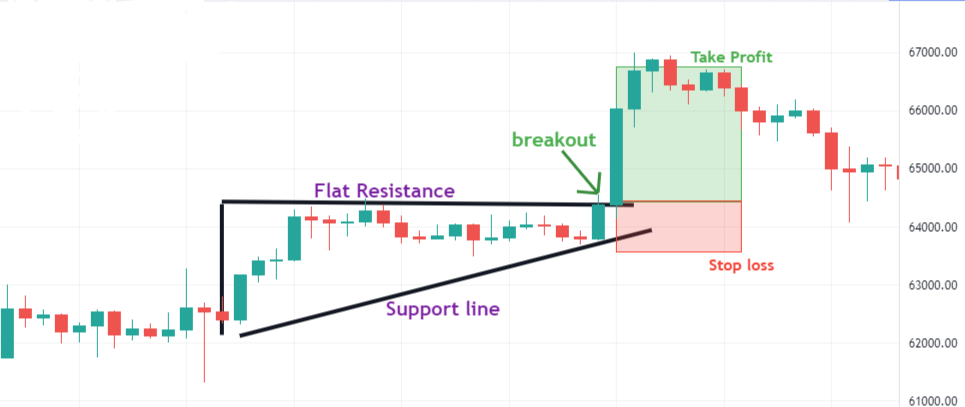
From the above image, We can see that there is Ascending Triangle formed. For entry point, Look at the Resistance line and Support line and the point where it breaks the Resistance line will be our Entry Point and We can mark our Take Profit Level and Stop Loss level. Mark Stop loss just below the Support.
- Trade Using Bull Flag -
As You can see in the above image, there is Bull flag formed after the massive Upward move by the price. So, When the Flag is formed, Make Resistance Line and Support line and then Observe the Point where It breaks the Resistance Line, that point will be our Entry Point.
After taking entry, Mark the Take Profit level and Stop loss level such that Stop loss level will be marked just below the Support line.
Conclusion
In this lesson, We have read about Simple Patterns in Trading. Recognizing Simple Patterns like Triangles, Flags is good for finding out Entry Points.
These Patterns are often observed in the chart of Crypto assets and If We knew about these Patterns, then We can easily trade them and can make profit by trading these patterns.
Thank You for reading my lesson. If there are any error in writing, then please let me know in comments.
Homework Task
Make Sure you understand the lesson before performing the homework task. Also, you are required to attempt all the questions and make use of your own Crypto chart.
1. What is your understanding about Triangles in Trading. Explain all forms of triangles in your own words. (Screenshot required)
2. Can we also use some Indicators along with it Triangle Patterns? Explain with Screenshots.
3. Explain Flags in Trading in your own words and provide screenshots of both Bull Flag and Bear Flag.
4. Show a full trade setup using these Patterns on any Cryptocurrency chart. (Ascending Triangle, Symmetrical Triangle, Bear Flag)
5. Conclusion
Homework Guidelines
- Homework must be posted in Steemit Crypto Academy community. Your homework title format should be " [Your Title] - Crypto Academy / S5W2 - Homework Post for @sachin08".
Plagiarism is a great offense in Steemit Crypto Academy and it won’t be tolerated. Ensure you refrain from any form of plagiarism.
Your post should not contain less than 400 words.
All images, graphs, and screenshots from external sources should be fully referenced, and ensure to use watermark with your username on your own screenshots.
Use the tag #sachin08-s5week2, #cryptoacademy, #club5050 if eligible and your country tag among the first five tags. Also include other relevant tags like #chart, #trading #pattern.
Homework task will run from Sunday 00:00 November 21th to Saturday 11:59 pm November 27th UTC Time.
Only users with a minimum of 300 SP and having minimum reputation of 55 are eligible to perform this homework. Also, note that you must not be powering down.
Users who have used upvote tools to gain SP or build their reputation are not eligible for this homework.
To take part in the Academy you must have powered up a minimum of 150 STEEM in the past month for #club5050 eligibility.
Note: You can only drop your homework link in the comment section if not reviewed after 48 hours.
Cc:-
@steemitblog
@steemcurator01
@steemcurator02
Ascending Triangle can be recognized by the fact that the asset price always bounces off the same upper price level. You should "note" that
Thank You.
Now, It has been edited.
Thank you for the lecture prof
Wonderful lecture you have here professor @sachin08.
Will drop my homework post very soon😊
Thank You.
Please professor @sachin08, i don't get the question
Can you explain? Please
Should we use triangle pattern for getting entry Points alone or can we use other Indicator with it to get accurate entry points???
Hello professor @sachin08, i guess this supposed to "S5W2" not "S5W1"
Oh yes.
Thanks for rectifying my mistake.
I have been in anticipation of your lecture 😊😋. You've done well
Let's get to business
Excellent work, than you very much!
Thank You
i have not complete week 1 task so i can write this w2 task
Nice post Professor 🌹
Prof, couldn you add images of bear trend for the other illustrations.
It’s confusing to deduce it from the lecture without seeing it
It is in homework task. It is opposite to that of bull trend.
You can identify it according to bull trend patterns as it is somehow opposite to that of bull trend.
i have not complete week 1 task so i can write this w2 task
Yes ofcourse
Nice post sir
I am looking forward to post this homework
Thank You.
I'll wait for your assignment.