[In-depth Study of Market Maker Concept]-Steemit Crypto Academy | S4W6 | Homework Post for @reddileep
Hello Everyone,
I am much grateful participating in this week homework post by prof @red. The detail lesson provided on In-depth Study of Market Maker Concept was very comprehensive.

1.Define the concept of Market Making in your own words.
The Concept of Market Making
In cryptocurrency trade market, we have buys who are alway in demand for an asset or token and sellers who supply the asset or token in keeping a balance between Demand - Supply force. To trade cryptocurrency we need to create and order which will be listed in the orderbook. Some of these order executes immediately after we create them and others take awhile before executing, This is usual due to the type of Oder place by the trader (either Market or limit order) and sometimes the how liquid the asset market is.
Market order is created for a buy and sell of an asset at the a market current best available price. When this order is created by trader for either buy or sell its executes immediately after the order is created and this kind of traders are called market takers. With limit order, the buy or sell order is created at a specified price, this is usually higher than the market price and it take a little time to execute after it has been created. Those who create this kind of order are known as market makers and they are out to make profit.
In a liquid market, we can create a limit order which will execute immediately as a result of enough buys and sellers ready and willing to trade the assets. Here, the difference between the Ask price and Bid price is less and so we have small spread, any buy or sell trade place will be executed quickly. Ask price is the lowest price a seller is willing to sell an asset while Bid price is the highest price a buyer is willing to pay for an asset. The difference between these two is called the Spread. Liquidity is how easy and asset can be traded.
Having understood all these concepts, we can now explain what market making is. Market making is a trading strategy adopted by market makers in providing liquidity to both sellers and buyers with a specified order greater than that of the current market price with the ideology of making profit. As mentioned, this order takes awhile to execute but executes much faster in a liquid market.

2.Explain the psychology behind Market Maker. (Screenshot Required)
The Psychology Behind Market Maker
Market makers as mentioned already provide liquidity in the market by setting their own bid and ask price for both buy and sell orders. As they risk their funds in this kind of strategy, they usually set the price bid price lower than that of the top sell price and also set the ask price slightly higher than the top buy price, this creates a difference between the bid-ask price know as spread.
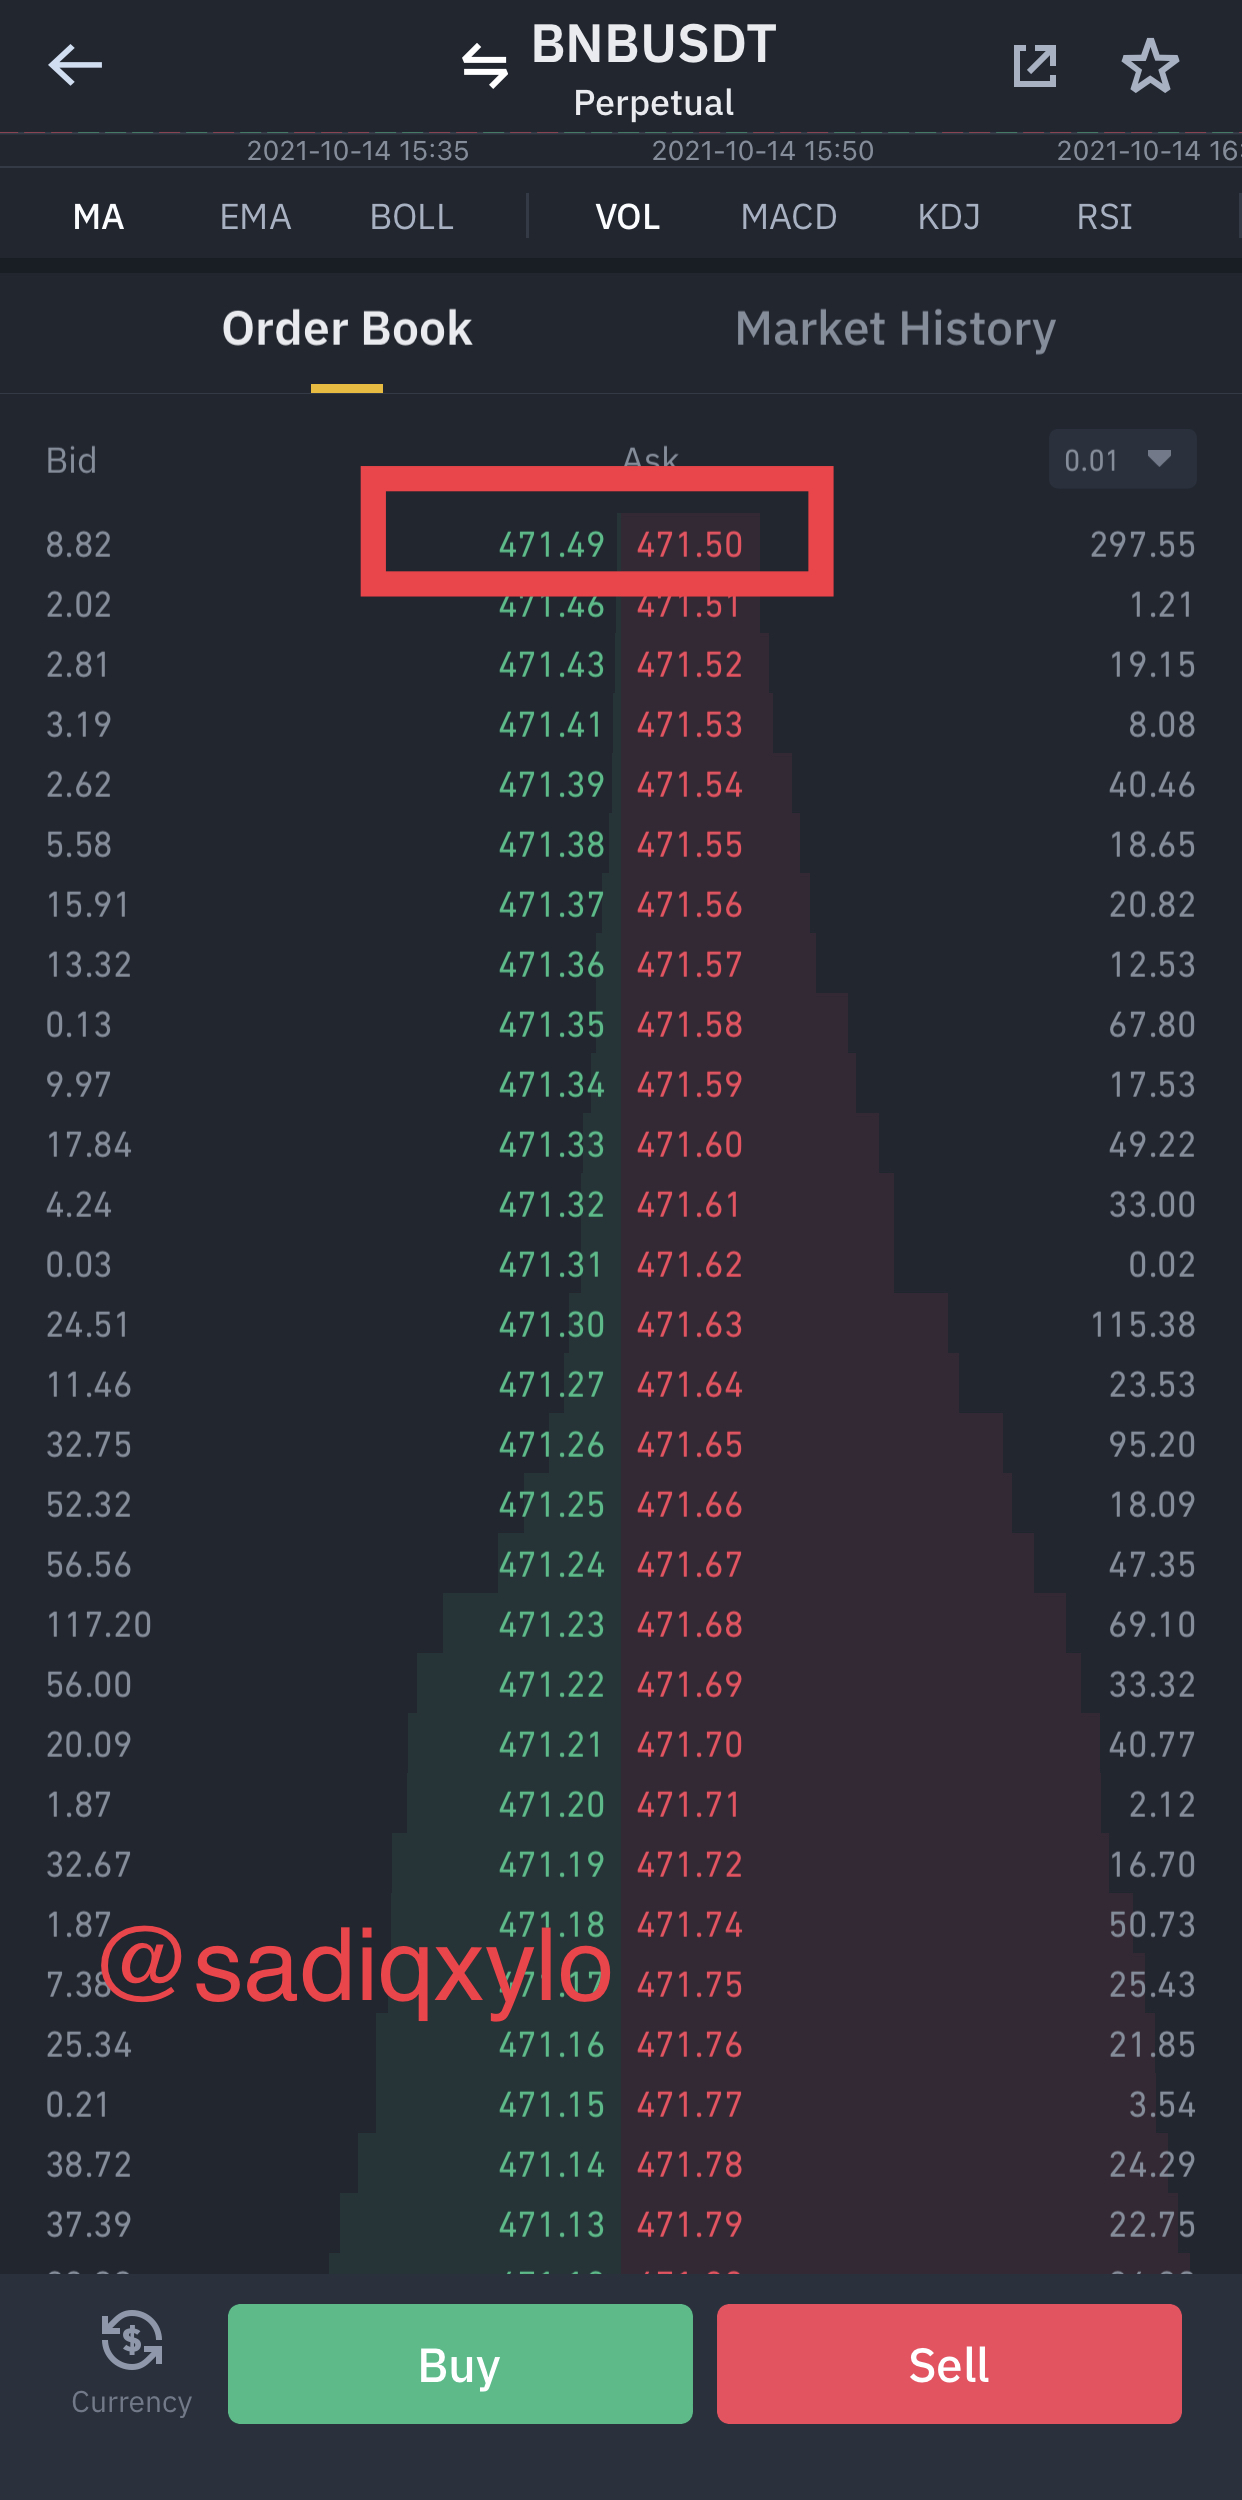
Market makers obtain their profit by multiple the amount of transactions carried by a spread. For instance as seen in the screenshot above, the difference between the bid-ask spread for BNBUSDT is $0.01 . This means that when a transaction worth $5,000 is initiated with this spread, market makers obtain a profit of $0.01 * $5,000 = $50
This scenario is used by market makers to obtain profit from retail traders. In some cases selfish market makers create a large spread to make more profit.

3.Explain the benefits of Market Maker Concept?
Benefits of Market Maker Concept
Below are some of the benefit of market maker concept;
Provide Liquidity in the market: liquidity is how easy an asset can be trade for different asset or fiat. With liquid market, we have a small spread as a result of market makers setting the Bid price closer to the Ask price for easy execution of market orders.
Determine the trend of an asset: from the bid-ask prices set by market makers can be used to identify an uptrend or downtrend of an asset. When both bid and ask price of an asset is crease by market makers it can be assumed that the price of the underlying asset is increasing, and same way if both bid and ask price are decreased by market makers we can as well deduce that the price of the underlying asset is depreciating.
Stabilization of market spread: market makers aim to provide liquidity in the market by bringing the ask price closer to the bid price providing a small spread which stabilizes the range of spread. This Crete an entry point for some traders since the asset will be acquired at a lesser price.
Increase the price of cryptocurrency: As market makers always determine the price of an asset by providing liquidity which controls the spread. Market makers can decide to increase both bid and ask price which will notify traders to enter the market to gain profit, and as More traders are demanding for the asset, the price will eventually rise.
Gives profit to traders: with the market maker concept, traders can buy asset at the market price and when selling they set their own limit order slightly higher than that of the current market order to make a little profit out of it.
- Increase the number of traders: market makers has a way of increasing the price of cryptocurrency which brings more traders into the market since they don’t want to be left out when others are making profits.

4.Explain the disadvantages of Market Maker Concept?
Disadvantages of Market Marker Concept
Provide liquidity for short term: market makers seek to make profit and so will provide liquidity only when they are to invest their funds. When they make profit, they stop to provide liquidity.
Slippage: slippage is a concept in which an order executes slightly higher or lower than the intended price as a result of market volatility . As market makers keep changing the bid-ask price to provide liquidity due to volatility , slippage constantly occur with traders whose trade with market makers.
Manipulation of market price: market makers are out to make profit and so can sometimes lower trading prices to enter the market acquiring the assets at its lowest price, after acquiring the assets they again increase the trading price to make profit and exit the market.
Fake Signal: market makers sometimes create false signal to involve traders into the market by increasing the price of the asset, after the market trend of the asset gets back to normal, traders involved in this mess will sell their asset with a fear of making greater loss ass they have already loss of of their assets.

5.Explain any two indicators that are used in the Market Maker Concept and explore them through charts. (Screenshot Required)
There several indicators used in market making concept and as required by this task, I will be using Bollinger bands and Random Index (KDJ)
- Bollinger Band
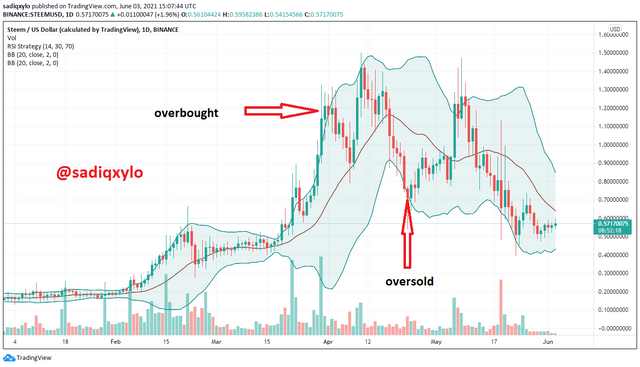
Bollinger band was develop by famous John Bollinger in the year 1980s. It is a technical indicator which is used to measure price volatility, overbought and oversold, market trends . As RSI indicator does in determining oversold and overbought of an asset, Bollinger band act as an oscillator to determine an overbought and oversold of an asset.
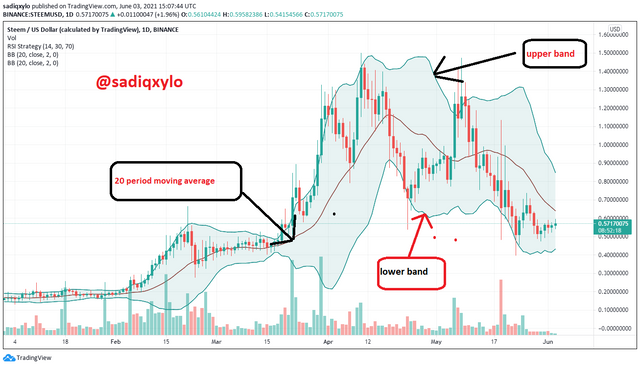
Bollinger band is a technical indicator consisting of three different lines, the upper band, middle line known as simple moving average (SMA) and the lower band. The upper is plotted above SMA with a plus two standard deviations (+ 2 SD) and the lower band is plotted below the SMA with a minus 2 standard deviations - 2 SD), this is done with a period of 20 by default.
How Bollinger Band Works
Bollinger band can be used in identifying so many signals and some include, price volatility, overbought and oversold, price breakout and so on. Some of these will be discuss below.
Market Volatility
Bollinger band signals price volatility in much simpler way, the wider the upper band and lower band from each other the greater market volatility of an asset and also the closer the upper band and lower band to each other the lesser the market volatility of an asset. Market makers use this strategy with bollinger to identify market volatility and provide liquidity for traders.
Overbought and Oversold
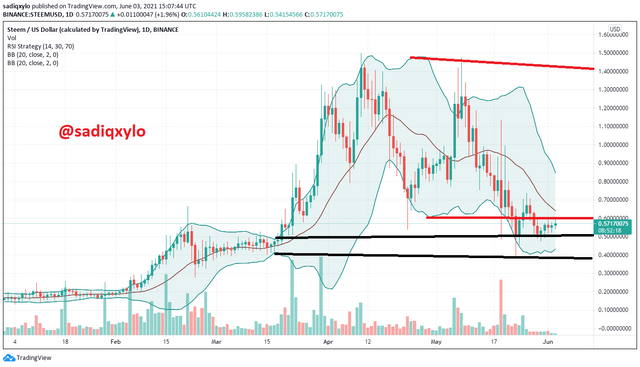
When the price of an asset is extremely increasing it can be term as an overbought, this is indicated by a Bollinger band when the price chart touches the upper band. At this point traders can place themselves in a sell position to gain profit from the market. Market makers will set a bid higher than the market price to take advantage of the market.
Also, when an asset price is extremely decreasing it can be term as an oversold and it is indicated by the Bollinger band when the price chart hits the lower band. At this point traders can place themselves in a buy position to attain more of the asset. Again market makers will set the bid lower than the market order to market advantage of the market.
- Random Index (KDJ) indicator
The Random Index is a technical indicator that was developed in the late 1950s by crypto enthusiast George Lane. Random Index has been a good indicator in in analysing and predicting the changes in asset trend over a certain period of time. To add on, the Random Index help traders to identify trend reversal, entry and exit points in the market, overbought and oversold and many other signals.
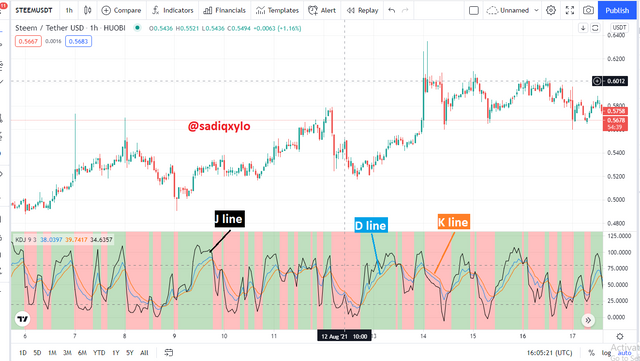
The Random Index is much similar to the Stochastic Indicator which consist of two different lines but with the Random Index, there is an additional like called the J-line. The J-line identifies the divergence of the D-line from the K-line. The D-line and K-line as function in the Stochastic indicator are for depicting oversold and overbought respectively, hence, these two lines are for entry and exit points or buy and sell positions.
The Random Index consisting of these three lines D-line, K-line and J-line gave it the name KDJ Indicator which is used for determining asset trend, overbought and oversold, buy and sell positions etc.
How Random Index Works
Overbought Signal
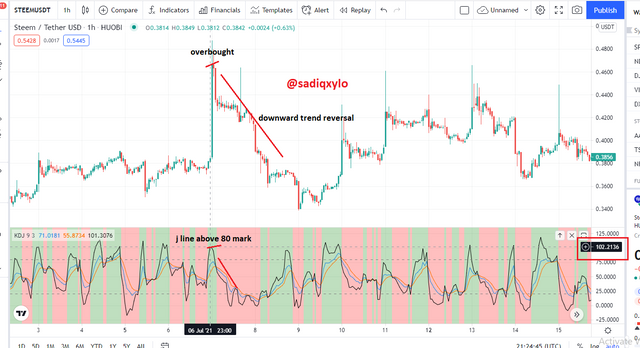
The KDJ indicator depict an overbought by the J - line plotted above the 80 mark in the price chart. When the J - line moves above the 80 mark, it’s indicated by the KDJ indicator as an overbought region. Overbought usually follow by a downward trend reversal, this is due to traders marking a lot of profit and decide to exit the market. Market makers set the bid price very high for traders to exit the market making room for them to enter at the dip.
Oversold Signal
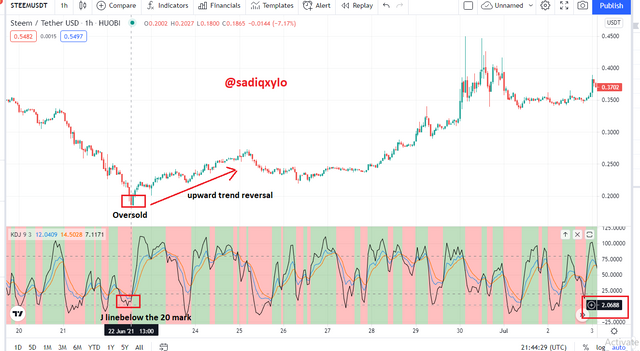
This is indicated by the J - line plotted below the 20 mark. An oversold usually occur as a result of great number of traders exiting the market and is usually followed by an upward trend reversal as the indicator marks an entry points for traders and asset is bought at the lowest price. Again market makers take an advantage as the bid ask price will be decrease and traders will enter the market while they will intentionally increase it again.
Uptrend Signal
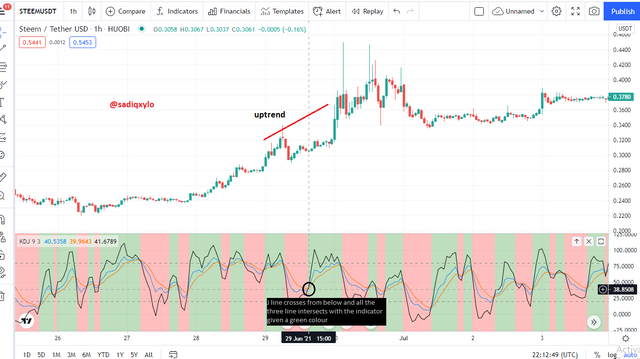
Uptrend signal is given by the KDJ indicator when the J - line crosses over the D - line and the K - line from below upwards, at this point all the three line intersect and the initial downward trend of the asset will take reversal to an upward trend. The indicator gives a green colour for an upward trend. Market makers identify this trend and set bid and ask price higher for traders to make profit since a lot of traders will be entering market.
Downtrend Signal
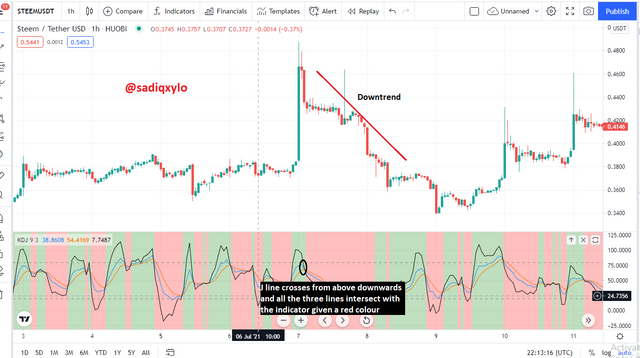
Downtrend signal is given by the KDJ indicator when the J - line crosses over the D - line and the K - line from above downwards, at this point all the three line intersect and the initial upward trend of the asset will take reversal to a downward trend. The indicator gives a red colour for a downward trend. Market makers again decreased the bid ask price to exit the market.
Screenshots taken from tradingview
Reference 1 from my own work
Reference 2 from my own work
Market makers read this signals given by both indicators in providing liquidity and manipulating market price of an asset by increase and decreasing both bid and ask price to control the spread and take advantage of the market.
CONCLUSION
The concept of Marie making provides a smooth market for both traders and market makers as they will always provide a liquidity market for trade to be executed very fast. Though market makers helps traders in a way but since they are out to make profit, they do anything in their power to manipulate market spread to favor themselves which brings the draw back of this concept.
Thanks For Your Attention