"Algorithmic Trading with Moving Averages on Steem"
QUESTION 1: INTRODUCTION TO ALGORITHMIC TRADING
Algorithmic trading is the use of computer programs to make automated trades electronically on behalf of an organization or individual in accordance with some rules defined previously. They perform analysis of huge volumes, study the dynamics of the market, and take into account a whole range of data over a period without people making the decisions to invest. This method includes defining a number of parameters such as a change in price, a change in volume or a period beyond which the algorithm is programmed to execute a trade. The same done with other asset classes such as bonds or cryptocurrencies can be enhanced through algorithmic trading where trades will be completed in faster and larger volumes than what is possible for human traders.
The most important potential gain from this approach is, without a doubt, that of speed. Instead of only being able to connect to one such lineup, algorithms instead connect to multiple such lineups ensuring that the best possible price for an order is gained for execution on the other side. This lowers costs, prevents market manipulation and enhances the outcome of the trades executed. They have made it easy for large institutions and hedge funds to handle bulk orders economically and effectively all under precision and quick actions thus making the whole trading affair easy. Using high frequency data within algorithmic trading is particularly explosive given the hundred of million orders that are sent in a couple of seconds so that traders can take advantage of minute price differences in various markets.
The constant maintenance by algorithmic trading is the decrease and even elimination of human error, specifically emotional bias in making trading decisions. Human traders are highly emotional, often motivated by fear or greed leading to irrational decisions especially when the market is rapidly fluctuating. Algorithms simply stick to strategies that have been developed and set, and therefore do not involve any emotional attachment, thus delivering high levels of consistency. Further, something that human traders cannot do is to operate 24/7 which is particularly important for access to opportunities in global markets with different timings.
In today’s marketplace, algorithmic trading has become a potent factor in strengthening the liquidity and depth of the market. It makes the market more heady and overwhelming by recruiting more and more operators who dare to subject themselves to such competitively cutthroat conditions. This increased liquidity benefits institutional traders as well as private traders, as it results into lower bid-ask spreads, better price formation and less price instability. Though very many advantages arise out of the high frequency trading, some constraints to finances such as low level of competition and market manipulation come about. Nonetheless, its contribution to the current systems of trade cannot be overlooked as it has changed the dynamics in which the financial markets operate.
AN EXAMPLE OF A BASIC ALGORITHMIC STRATEGY USING MOVING AVERAGES.
The most common and frequently used algorithmic strategy with the use of moving average is none other than what we know to be the moving average crossover.
What is moving average crossover? Moving average crossover is a trading strategy using two moving averages where the moving averages have to cross each other for a trading opportunity to be seen.
In the use of a moving average crossover strategy, we have what we know to be the death cross and the golden cross. The death cross of a moving average is said to occur when the short term moving average which ranges within 20-50 crosses below the long term moving average which ranges within 200 and above, and this often gives a sell signal of the token and the Golden cross of the moving average is said to occur when the short term moving average crosses above the long term moving average, and this can be read to be a bullish signal of the market.
HOW TO APPLY IT ON STEEMUSDT
Inorder for me to apply the algorithmic trading of moving average crossover on the price chart, I decided to visit trading view and show the step by step process on how I got this done.
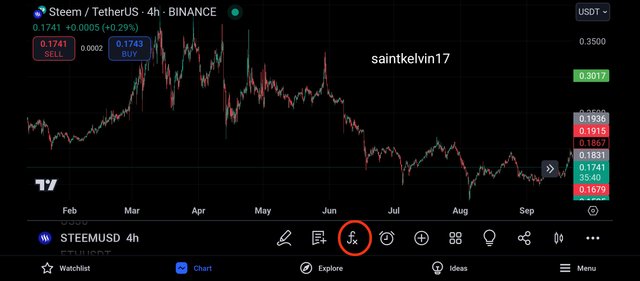
I visited the pair STEEMUSDT on the Trading view app and I clicked on the indicator icon as shown above since I want to apply the moving average to the price chart.
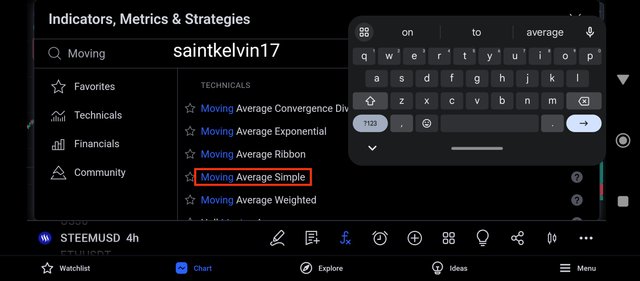
Clicking on the indicator icon, the above popped up and I went to the search botton to search for a simple moving average indicator, and clicking on this we can see from the screenshot below that the moving average was added to the price chart STEEMUSDT.
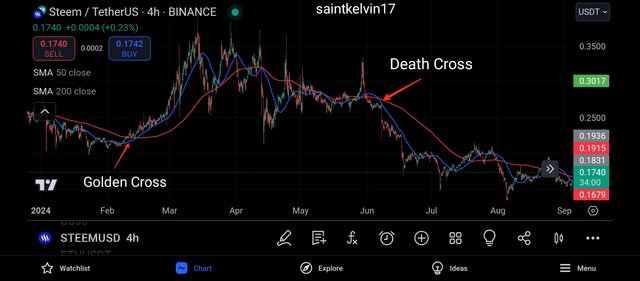
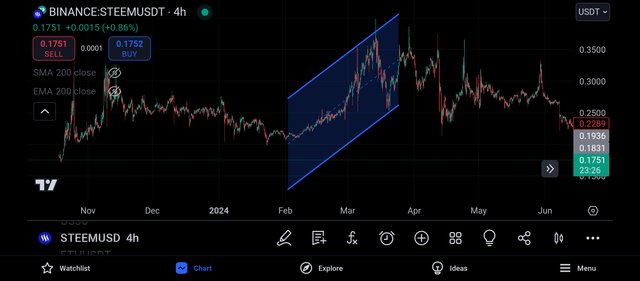
I then applied two moving averages, the long term moving average with the range of 200 and with the red colour and the short term moving average with the range of 50 with the blue colour.
And also, I indicated the moving average crossover just as seen above.
When the short term moving average crosses above the long term moving average, it can be referred to as the golden cross and this signals a bullish move and when the short term crosses below the long term moving average, this can be referred to be the death cross and this signals a bearish move.
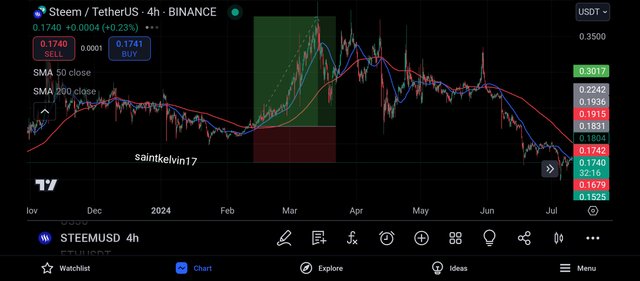
The screenshot above is of the pair STEEMUSDT and it's shows how to apply the golden cross on the price chart whenever it appears, and we can see that my entry was placed when the golden cross happened which gave a buy signal on the price chart.
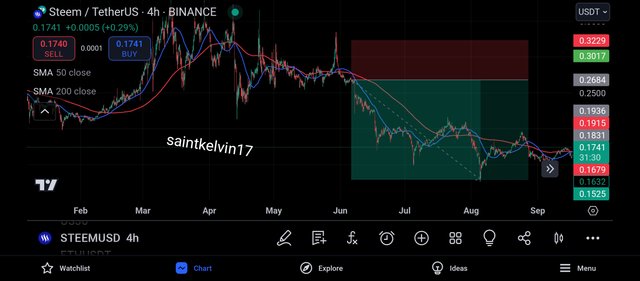
And likewise was done on the death cross, the small range moving average crosses below the long range moving average, and this signals a sell in the market, just as seen above.
QUESTION 2: MOVING AVERAGES IN ALGORITHMIC TRADING
Moving Averages as used in algorithmic trading are used to gauge trends of assets prices. The other most common types of moving averages that are in circulation include the Simple Moving Average (SMA), Exponential Moving Average (EMA), and Weighted Moving Average (WMA). Each of these has different ways of assessing as well as weighting the past prices, and it’s their shortcomings as well as strengths in day trading strategies that this paper will focus.
With the Simple Moving Average (SMA) a predetermined number of previous price points is averaged but all periods are assigned the same weights. Its calculation is easy and smoothens the price for a long period of time, which helps in detecting trends over the long run.
The Simple Moving average also happens to be very suitable for both beginners and experts as it Is very easy to understand
However, there are certain disadvantages of using SMA. The major disadvantage of using SMA is that it is too slow to catch up with the recent changes in the market price. This speed in action is a plus in active markets. However, SMA can actually be found running far behind the real action. This makes SMA is less appropriate to day trading strategies, where time is of the essence.
Traders who make use of SMA often miss their chances to react early to market movement due to the lagging property of the SMA indicator and this is particularly inappropriate in market with a high volatility.
Using the death cross from the above screenshot as an example, looking carefully at the above chart, we would notice that the SMA reacted late to the change of market structure.
The market has formed series of bearish candles before we could get the death cross and this made me enter the market a little bit late, this is one of the set back of SMA.
Adding more functionality to each of these tools, the Exponential Moving Average (EMA) warrants mention as well. Exponential Moving Average (EMA) applies to the rates but incorporates the assumption of decreasing sensitivity to older rates. This allows the traders to make short positions smoother and quicker when the prices changes. This capability of a faster turnaround assists traders in arriving at new developments earlier than MA and this is better placed in fast growing algorithmic trading.
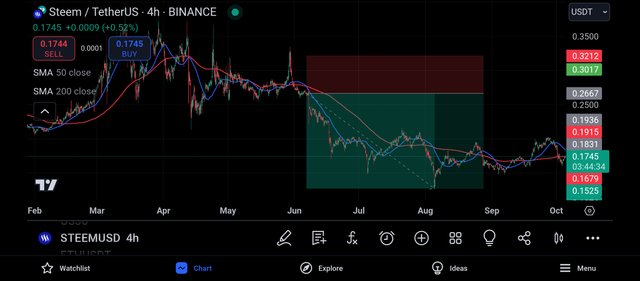
From the above screenshot, we can see that the EMA gave both buy and sell signal quickly and on can take advantage of this.
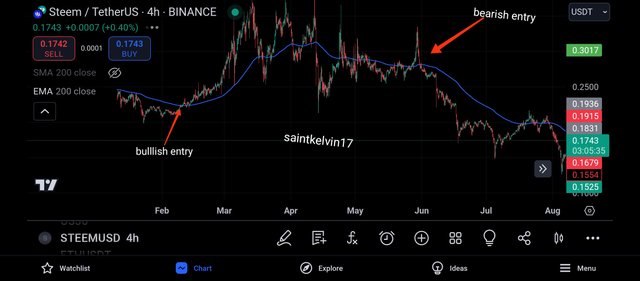
When the EMA is seen below the price chart, the market can be understood to begin a bullish move and when the EMA is above the price chart, we can expect to see a bearish move of the market.
The movement of the price curve has its advantages, and some disadvantages as well: more sensitivity is a benefit in capturing price areas, however, it results in the misdirection several times in an active volatile market.
A weighted Moving Average (WMA) computes the moving averages of a chosen number of days of the available price but places a given emphasis on the more recent data. Similarly to EMA, WMA is also quicker at adjusting to price changes, however its weighting system can be described as more sophisticated as traders can determine the significance of certain past data. Because of this, it can be employed in the more advanced trade strategies. Still, its limitation for a number of traders can be the pricy computation and like for EMA, it can prone to the market noise and spurious signals can arise.
In algorithmic trading strategies, rather than simple moving average, EMA is usually more popular as it provides both smoothness and responsiveness. It has, it should be stressed, all the advantages that are needed most of the time so that the wrong decisions can be avoided. Because EMA is more responsive, it is suitable for more aggressive strategies where the reacting to price change matters, especially in short-term ones. However, the choice between moving averages comes down to the purpose of the trading strategy, with all types having their pros and cons.
WHICH WOULD I PREFER AND WHY
All three moving averages are very important in trading and when handled by a skilled trader will produce efficient results.
However, I would prefer to make use of SMA as it is easily understood, and most commonly used both by new and experienced traders.
I have carried out my backtest on all 3 moving averages and the SMA gave me a more effective result, a more win ratio also I encountered some few losses due market manipulation.
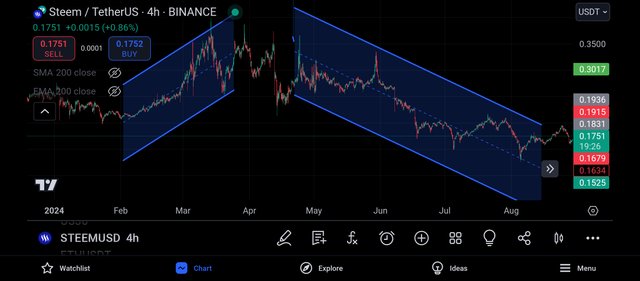
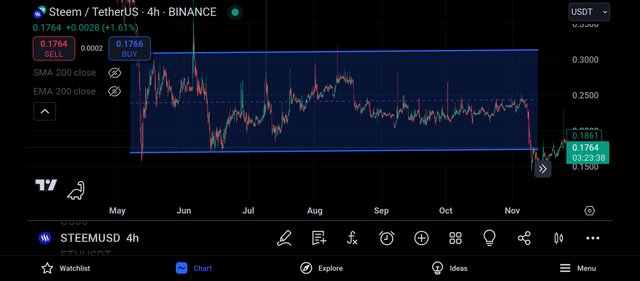
The SMA helps me to easily detect the trend of the market, when the SMA falls below the price chart, I understand it to mean a bullish phase of the market, as the SMA thus acts as support level to the market price as it keeps forming higher highs and higher lows.
And when the SMA goes above the SMA, I understand it to be a bearish market where the SMA inturn acts as a resistance level to the price chart
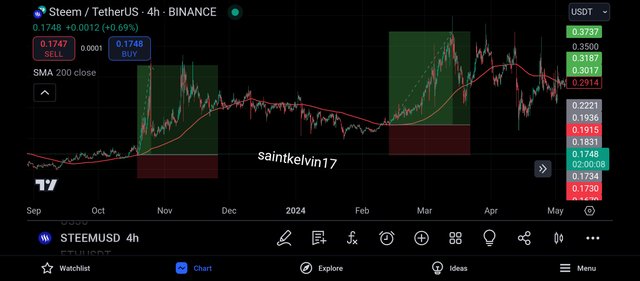
The above screenshot shows me making use of a large scale SMA to catch good trades on the pair STEEMUSDT, I can either make use of a single SMA or I make use of SMA crossover to spot death cross and golden cross.
QUESTION3: DESIGN AN ALGORITHMIC TRADING STRATEGY
One thing I have learnt about trading is that the simpler we keep it, the more effective and profitable it is, and since we do not control the market, it is very important that we implement a strict risk management policy.
And when implementing a risk management policy, it is very important to take into account of account size, and as the saying goes, a good trader is not one who is skilled at technical analysis, rather he is who is good at risk management.
- MY ENTRY AND EXIT:
Since it will be an automated trading, I intend to enter the market only based on golden cross and death cross.
This implies that I will enter a buy on the market went the short range SMA indicator crosses above the long range SMA indicator and I will enter a sell on the market when the short range SMA crosses below the long range SMA.
And I will do so because when the short range SMA crosses above the long range SMA, it signals a golden cross and this is a bullish signal, and when the short range crosses below the long range it shows a death cross and this signals a bearish Market.
- RISK MANAGEMENT
Like I said, a good trader is not known by his ability to predict the market, rather he is known by his ability to manage risks in the best way possible.
And to effectively manage my risk, I will only risk 25% of my trading capital in a trade, that is, if I am trading a $1000 account, each of my trade will cost me $250 if it goes again me.
And also, I trade with a risk to reward ratio of 1:3, that is, if I am risking $250 I will expect to make a profit of $750 when the trade hits my take profit level.
And also in line with my risk management, I will ensure to take partials when trading , taking of partial is a very effective way to minimize loss and risk in the market.
And to backtest my strategy, I can go far back as 6months to 2years to check how the market has reacted to this strategy and how profitable it has been.
And as far as I can remember, backtesting the crossover of moving average has a winning rate of 85% which is a very good win rate for a trader to be profitable.
Question 4: IMPLEMENTING ALGORITHMIC TRADING
There are several programming languages and platforms which can be employed to carry out an algorithmic trading strategy, as per its complexity, its expected performance and how it is expected to interact with other tools. Python occupies one of the leading positions in the list of languages for algorithmic trading, mainly because of its numerous libraries useful in data analysis, machine learning, and visualization, for instance, NumPy, and pandas, and matplotlib. Several open source libraries of Python such as TA-Lib for technical analysis and ccxt for cryptocurrency trading enhance its usability in testing and implementing trade plans.
MetaTrader 4 and 5 (MT4/MT5) are widely used application in most Algorithm trading and most especially in foreign exchange and CFDs. It employs a proprietary language called MQL4/MQL5 which is built especially for writing trading robots (Expert Advisors) and programmable indicators. This is because most of the traders who engage in this kind of trading are looking for mainly active trading in the forex and commodities market which makes MetaTrader develop almost all tools required for such trading with real time, such as integration of technical indicators and brokers.
An alternative remedy for customers who would like to use charting platforms and would not wish to do extensive programming is the option of TradingView, which combines a simple interface with pine script. Additionally tradingView provides facilities for proper visualization and analysis of market data. The platform provides a social network for traders, which is quite beneficial as it helps in sharing and comparing the strategies that these users employ. It connects perfectly with brokers to the extent that trades can be executed from the platform itself.
Explained below is how I developed a trading strategy using the golden cross and death cross of SMA.
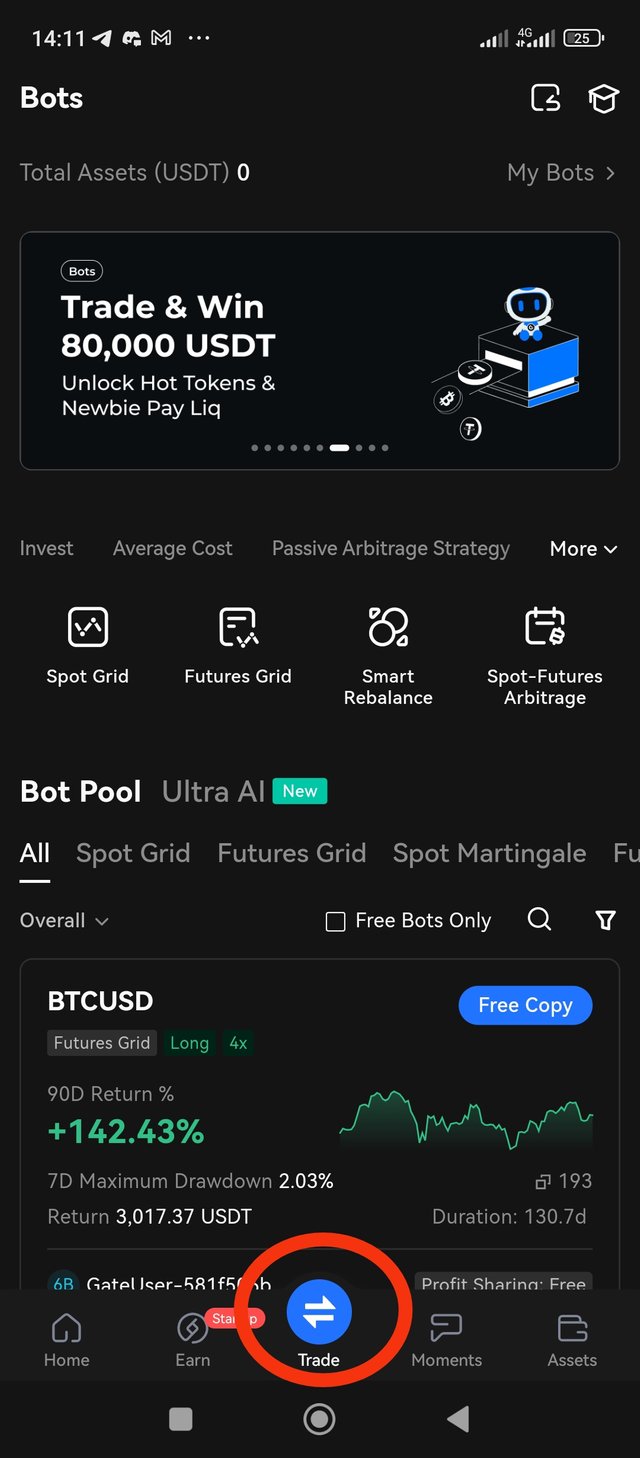
I visited the exchange gate.io and the image on the left hand appeared and then I clicked on trade, just as seen above.
By clicking on trade, I intend to show how I set my algorithm trading and then the image on the right hand appeared.
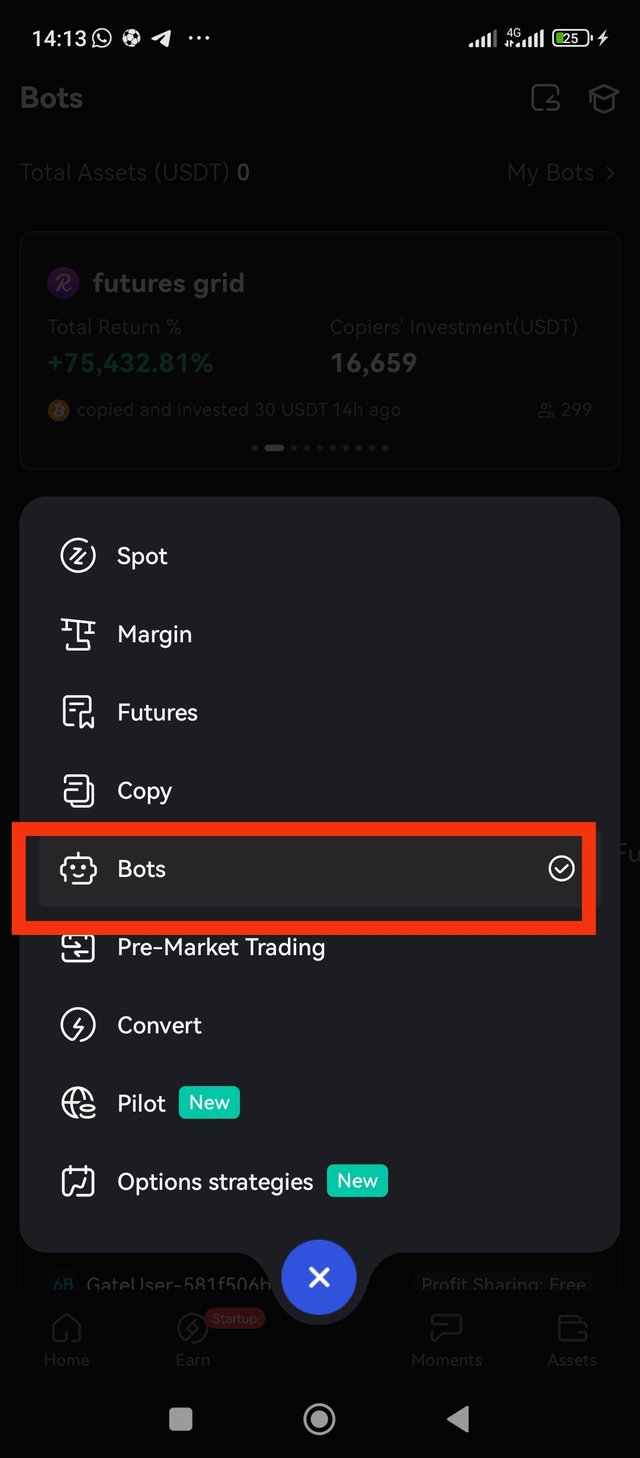
And since the algorithm trading involves the use of bots, I then decided to click on bots.
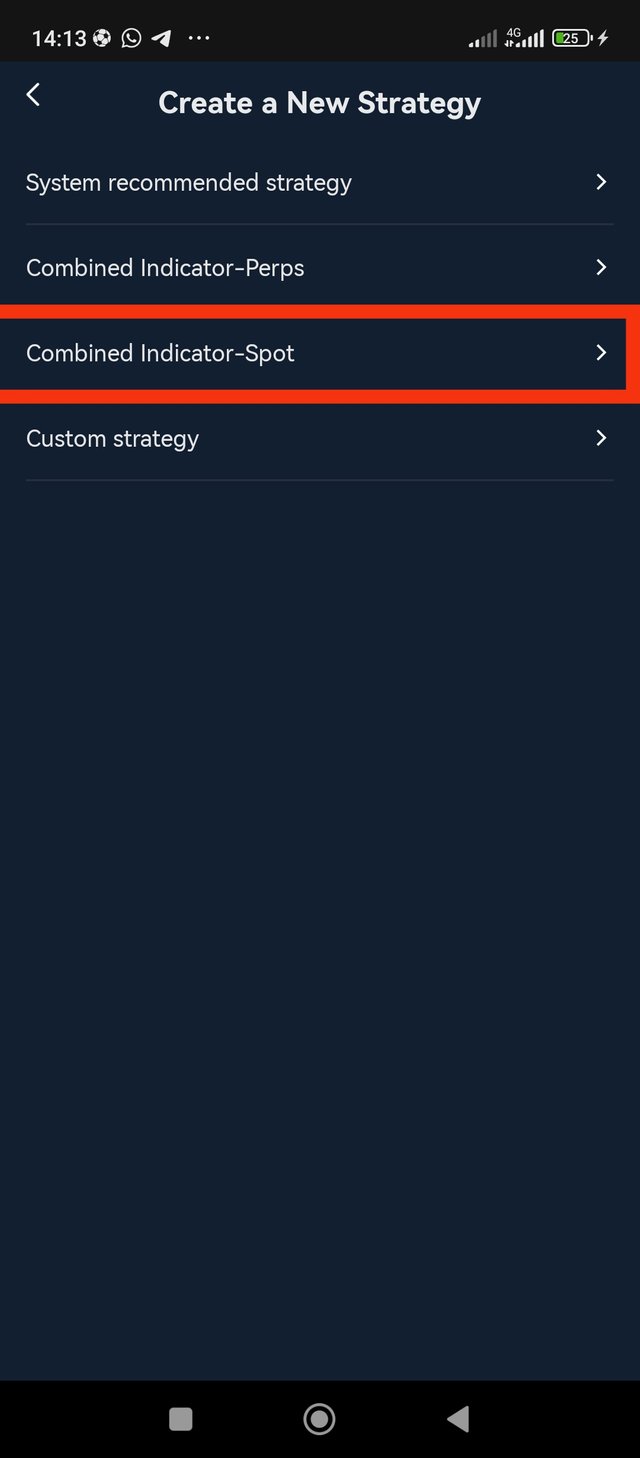
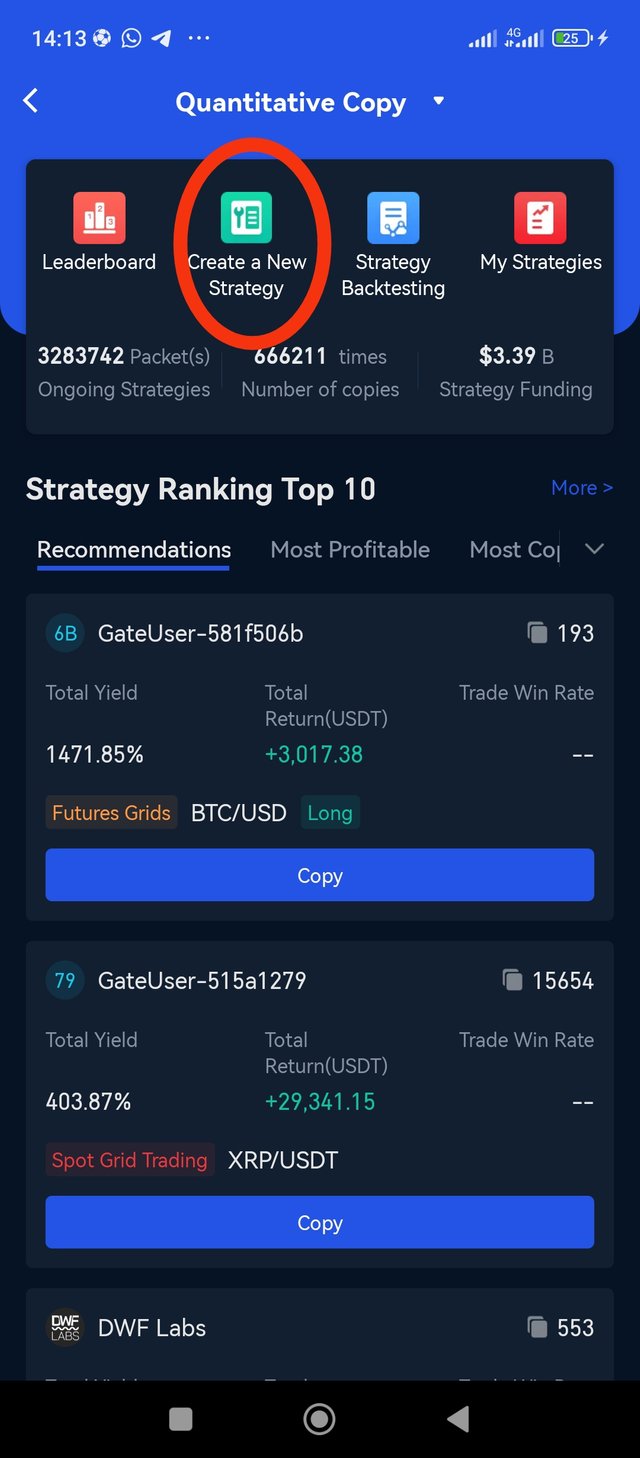
After clicking on bot icon, I then clicked on the create strategy icon just as seen above.
After clicking on create strategy icon, the display on the right hand appeared and I then clicked on combined indicator, and this is because I intend to make use of a combined indicator.
And the combined indicator I decided to make use of is 2 SMA indicator, the long range and short range which is used to detect death cross and golden cross.
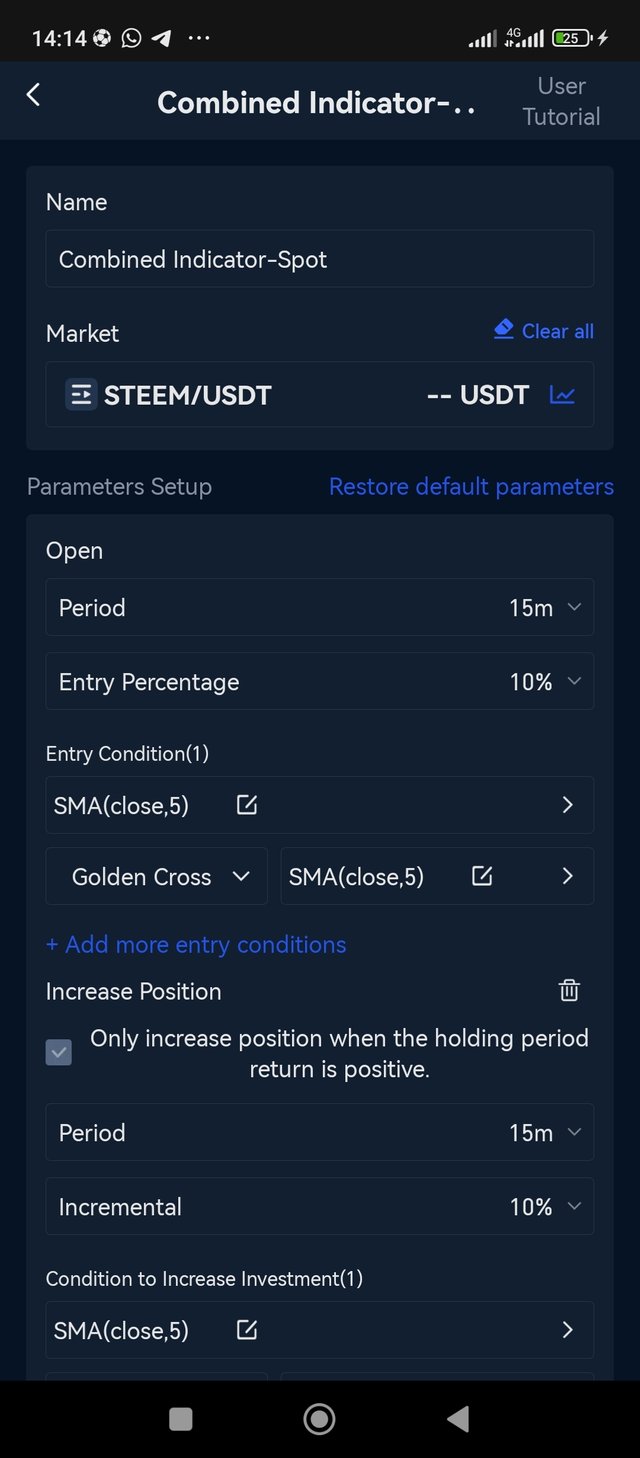
After clicking on combined indicator, the image on the left hand side appeared and I adjusted my chart to be STEEMUSDT.
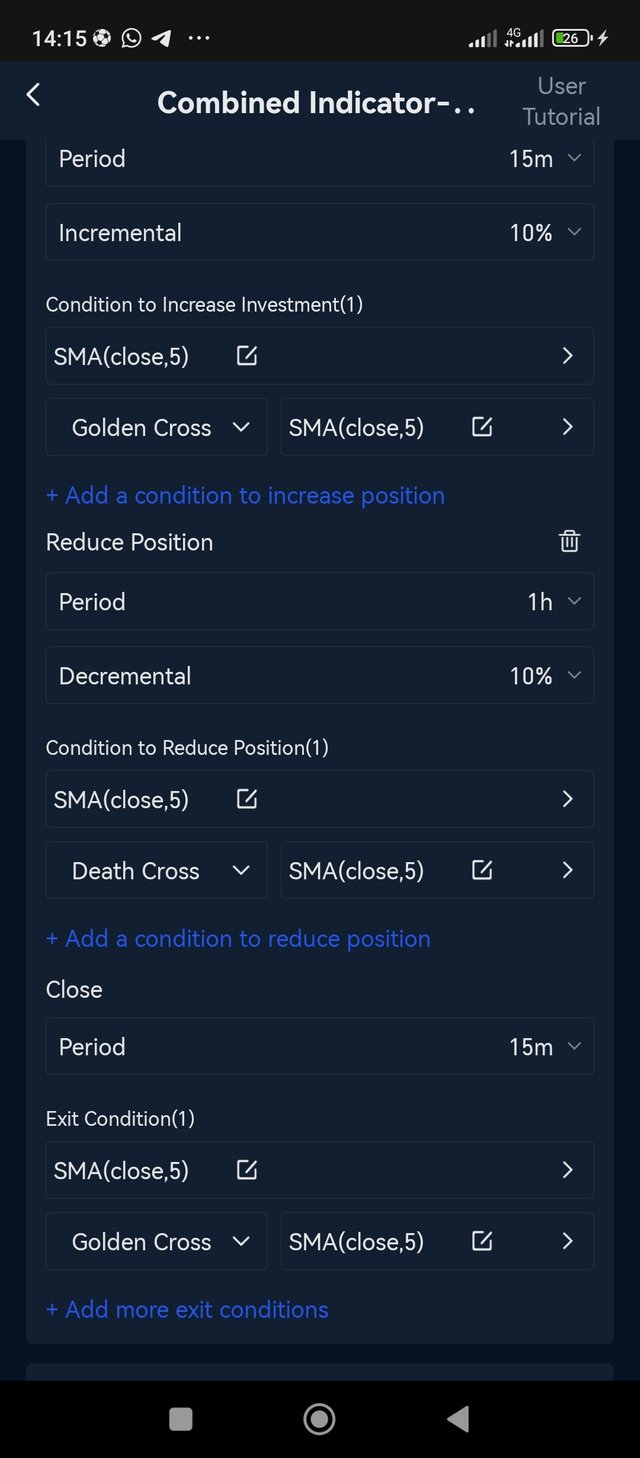
And then I went ahead to set my parameters, I set my timeframe to be on the 15m, and I made sure I made use of SMA and I programmed the bot to search for both death cross and golden cross.
And all of this can be seen from the above screenshot.
QUESTION 5: PERFORMANCE REVIEW
To carry out this aspect of the assignment, I decided to go far back as the late 2023 to carry out my backtest.
I decided to go this far because backtesting is all about testing your strategy to see if it holds in the long run, that is for a long period of time for different phases of the market.
A strategy might proof to be profitable in a bullish market and then perform otherwise in a bearish Market, and this is the beauty of backtesting.
As seen above, my backtesting began from the month of November, and I did my backtest for the bullish phase of the market, and for this phase, my algorithm trading worked well giving me some profits and a few loss.
The golden cross played very well on this bullish phase, and the market kicked me in severally and my entry was done on a low timeframe, as I love setting my analysis to be done on the 5min timeframe.
And carrying out my backtest on a bearish phase, I didn't make as much profit as I did on the bulllish phase.
During this phase, I was tempted to risk more than my agreed capital which is 25% of my capital but as a result of a strict trading rule, I refused to risk more.
I stuck to the 25% and some hit stop-loss and some hit take profit, and another thing I ensured to do was to take partials, this helps to mitigate risks in the market.
The ranging market was not so favourable for me using the cross over of SMA because of market manipulation.
And from this backtest, I have decided to stay off the chart when it's ranging, as there are so much uncertainties in a ranging market.
CONCLUSION
The use of moving averages in technical analysis can be very effective, most especially when multiple indicators are used.
And I have explained this post to the best of my ability and every information on this post was made as an educational content and should not be used as a financial advice.
Twitter share
https://twitter.com/Saintkelvin18/status/1842586318800633949?t=-tj8mDLj7kx-HhRYqNo_Mg&s=19
Upvoted. Thank You for sending some of your rewards to @null. It will make Steem stronger.
At first I thought maybe I can't participate in the contest then when I browsed different sites to learn it and then I cleared the issue and I participated in the contest. Actually saves our time and funds too. You have very nicely created moving averages of 200 and 50 showing the correct usage. Best of luck to you.
Greetings bro, I also had the same thoughts, is not an easy task for us to do, this shows that the crypto academy and teaching us to always make research and put what we have learnt to practice.
Good to see your comment, I will check on your entry soon so have a nice day 🤝.
✔
Great job on your post You have clearly explained the concept in a way that easy to follow and I appreciate how you have provided examples to help understand the topic better. The effort you hsve put into breaking down the key points really stands out. I also like how you have connected the information with practical applications. Keep up the good work and I am sure this will be helpful to many readers. Wishing you the best of luck in the contest
Thanks for stopping by, creating posts like this requires quality time and also understanding. It wasn't an easy process.
I just wanted my readers just like you, to be satisfied with my post and also learn something new.