Crypto Trading Using TRIX Indicator -Crypto Academy / S6W3-Homework Post for kouba01

QUESTION:1
- Discuss in your own words Trix as a trading indicator and how it works
Introduction to TRIX Indicator and its working cycle
Introduction
The TRIX Indicator commonly known as triple exponential average indicator which is developed by JACK HUSTON in 1980 used to observed the oscillation in marekt with respect to trends and price momentum regulating the oversold and overbought areas of marekt. The price movements can be turned in any directions though at that time the false signals also arises to prevent them TRIX Indicator plays a vital role in trading.
This Indicator can also be used with other indicator in order to extract divergence between price action although trend identification is one of the core elements and significance of TRIX oscillator. Held the indicator also enhances the impulse in market which easily corrected by using trix indicator though using trix with different oscillator indicator like MACD, MOVING AVERAGE can describe the behaviour of market more prominent way.
As per the calculation criteria is very complex held jack formulated this formula and configured in indicator thkugh we just need to remember and analyse the cross over of trix Indicator with zero line where the traders can extract the impact of overbought and oversold areas these valuations is same like RSI but as far i described the Indicator having string oscillations though falseness would be escalated and true signals will be pluck out, held working of zero line will be exaggerate in below working cycle of TRIX.
Working Cycle of TRIX Indicator:
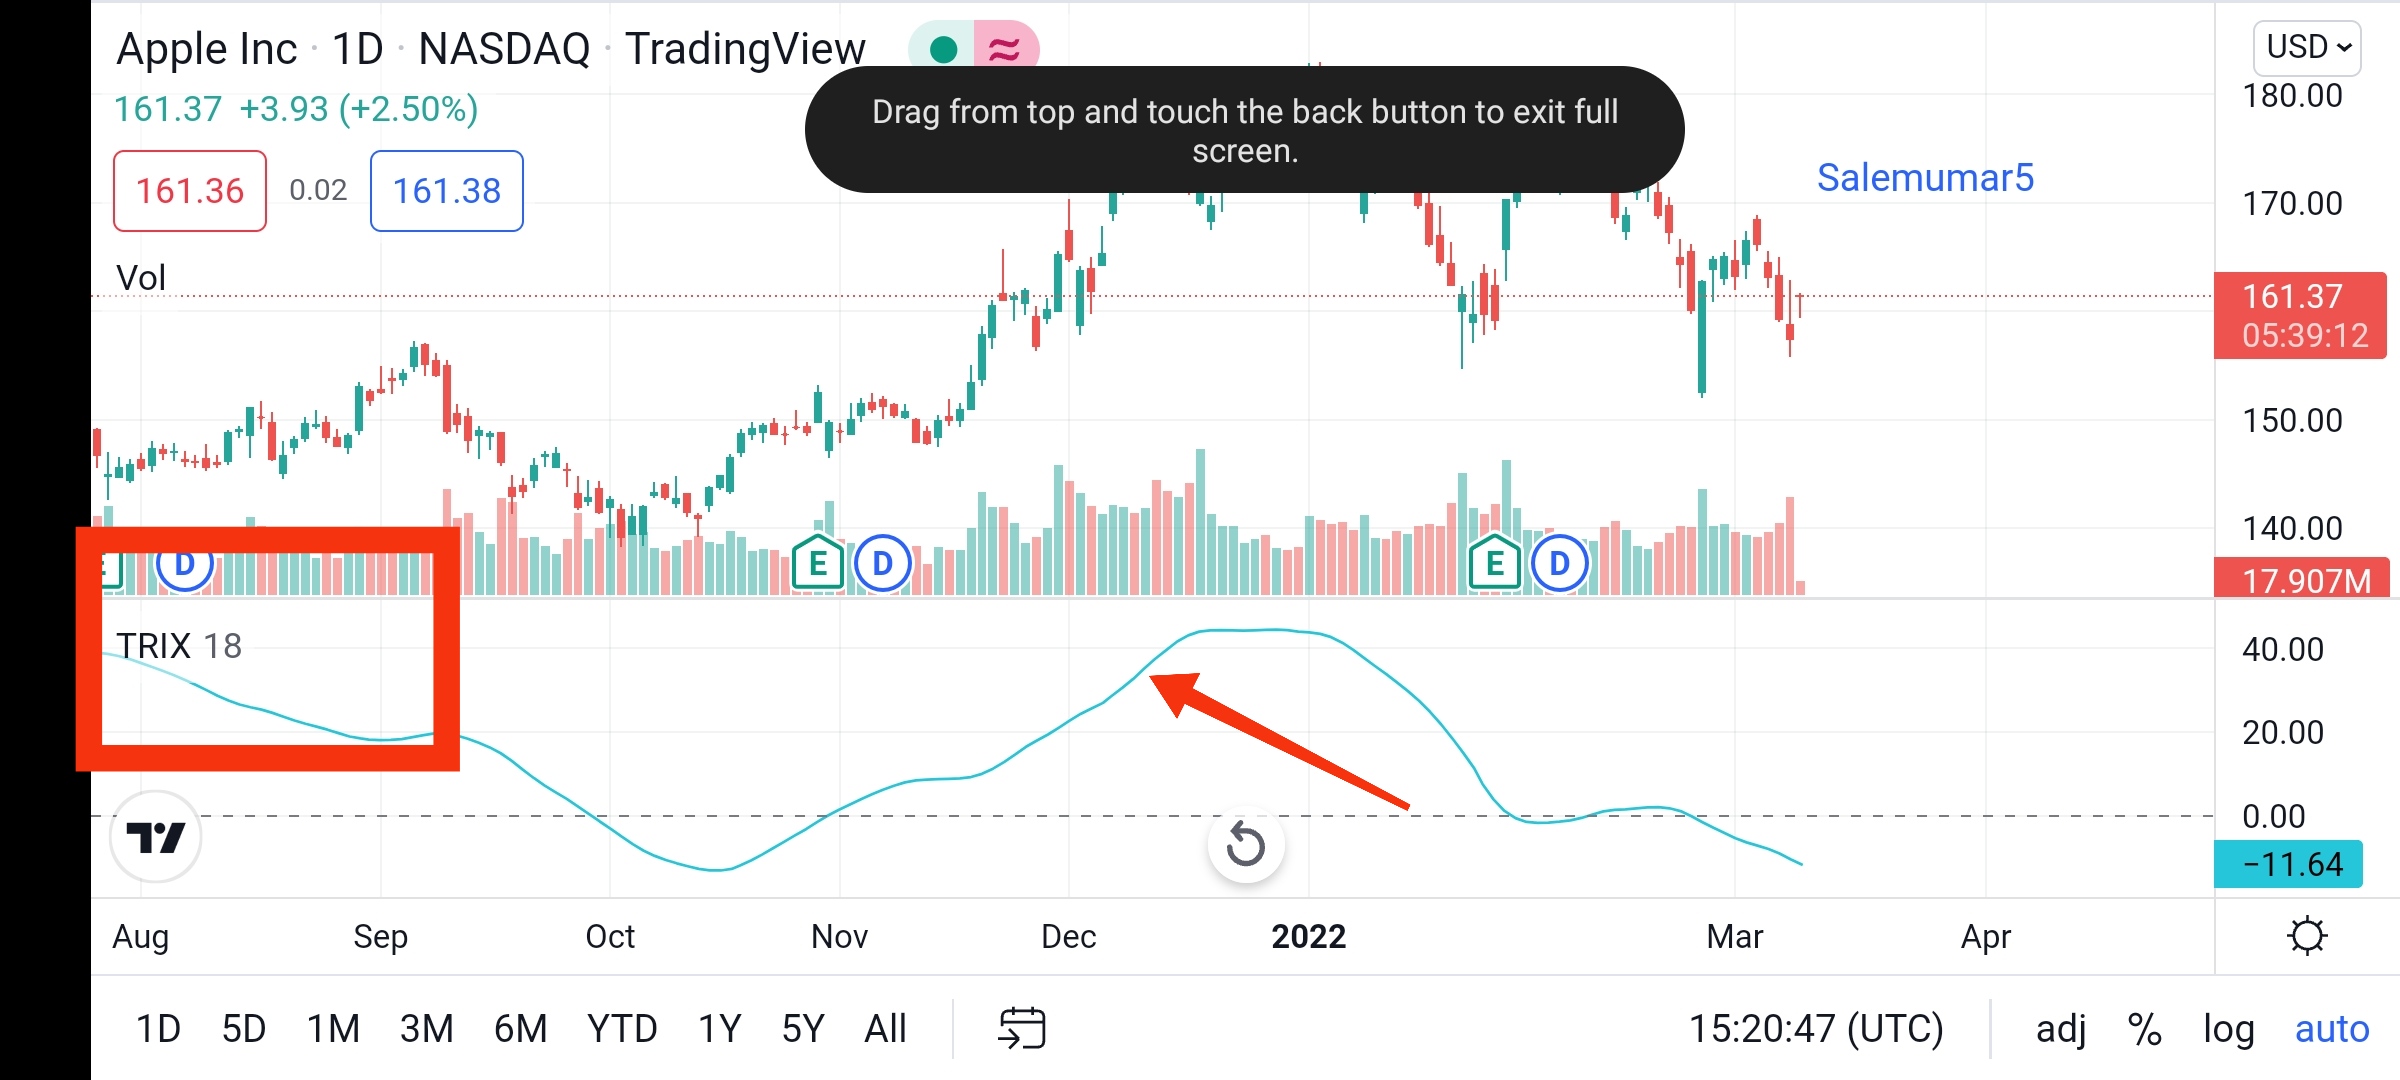
The Trix Indicator is similar to momentum Indicator which create oscillation frequency in market through which the trends and momentum of volatile market can be observed thkugh its working totally similar to RSI where the same line described the over bought and oversold position here the the Zero line plays a vital role in order to suggest the market penetration if the TRIX crosses above zero line it signals buy entry and it crosses below the zero line it signal the sell entry. Held when the Trix pretending the negative values it will be decreasing and for positive values will be increasing TRIX in market
There are many cases for strong negative values defines the strong overbought position whilst strong positive values will signs us the oversold areas. Though its your maneuvering skills will be implied in trading and how you handle your trade with this working.
QUESTION:2
2 Show how one can calculate the value of this indicator by giving a graphically justified example? how to configure it and is it advisable to change its default setting? (Screenshot required)
Calculation, configuration and default settings of TRIX
Calculation:
The formulation of TRIX is quite complex but its calculated as per default setting by the trading view platform so you just need to apply the given formula below;
TRIX = (EMA3 t - EMA3 t-1) / EMA3 t-1
The TRIPLE EXPONENTIAL MOVING is interconnected with 14 EMA and its uses and recommended to be used because the moving averages based on closing price of coin whilst the falseness also prevented though volatility doesn't effect the indicator and price momentum is also move smoothly.
The oscillator movement is very rare and significant part of TRIX because the longer EMA periods will drive better results for long term trade held false signals are also prevented though as per study and professor also recommended 14 to 15 EMA support which is good. Though as you will encourage this EMA support will tends to be sensitive because the there will be likely manner of false signals in chart.
Hence trix which support TRIPLE EMA though it encourages your trade to be more confidential integrated and reliable because the fake signals ain't arise ultimately the more wait in chart though it truly wave with best price action default 14 will accumulate you more chances in market held don't look forward the complexities just focused on default setting and maintain them accordingly with your time frames.
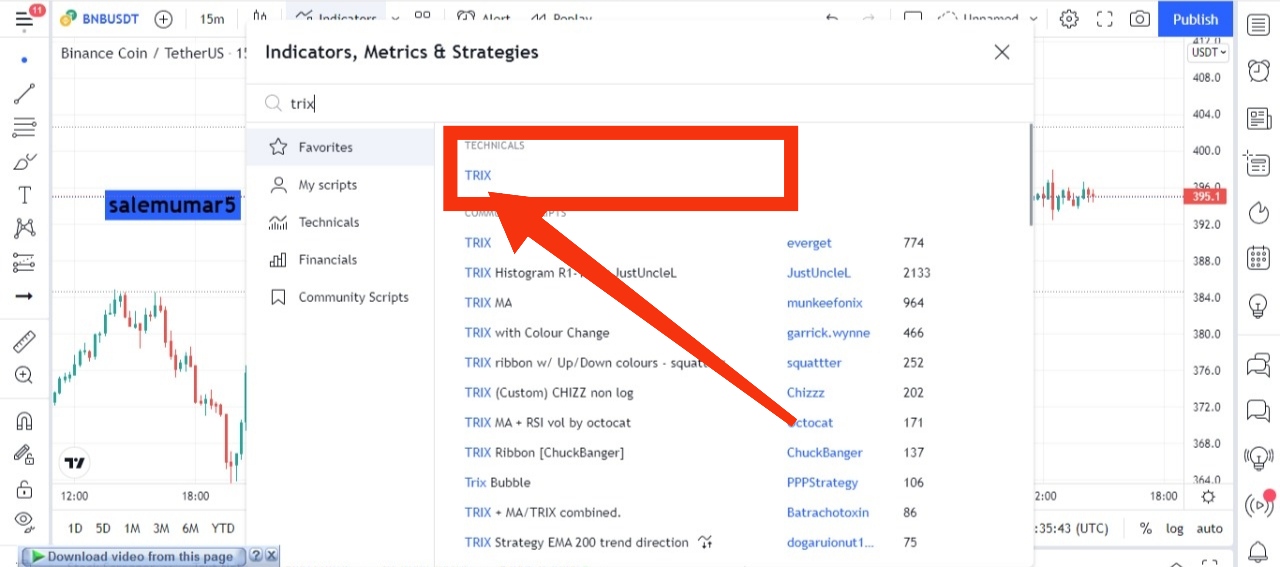
Configuration of TRIX Indicator:
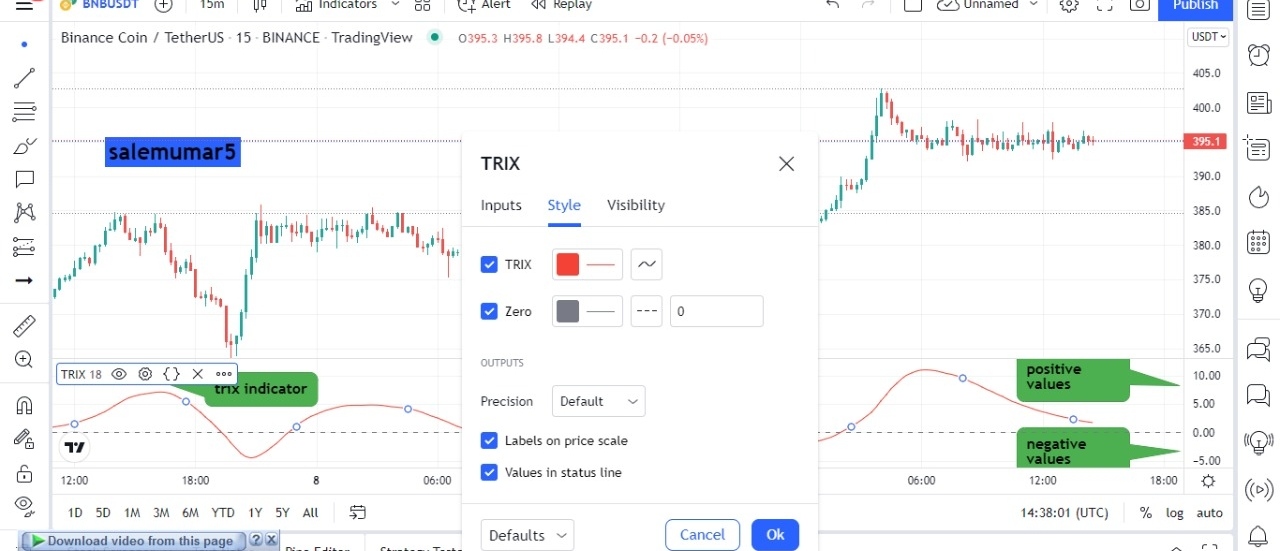
Go to tradingview link after you can see in picture below the the indicator option click in that and configure the TRIX indicator.
TRIX default settings analysis:
- Here you can see below the input option where we told you that we will run the default setting time frame will be run according to chart and length us 18 while the gaps are should be enabled
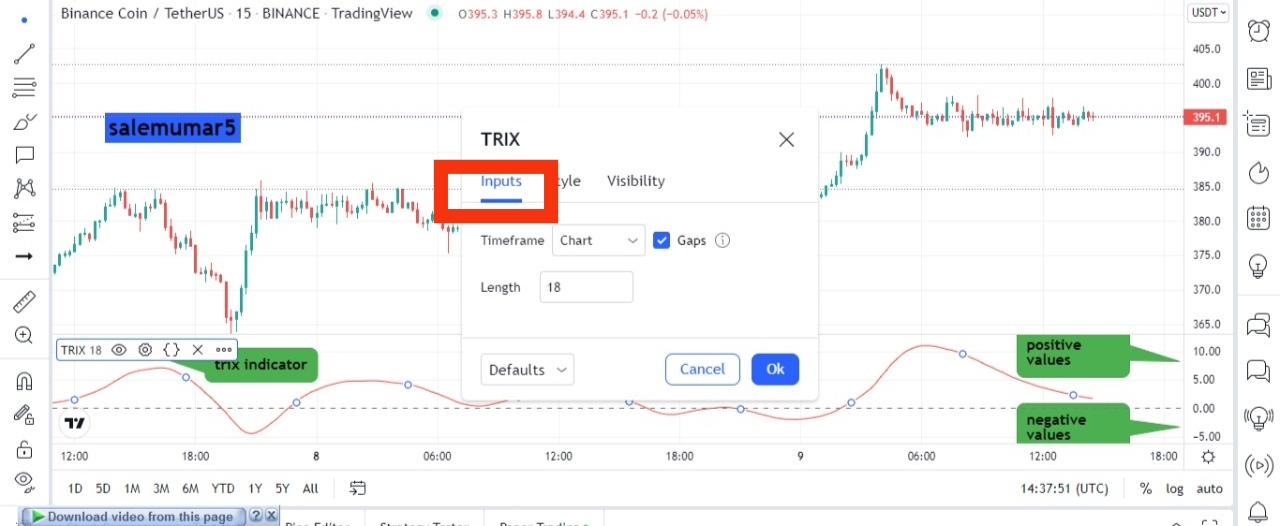
- Here TRIX line is denoted by red line and zero line is configured with grey colour though you can see the precision output is sett default.
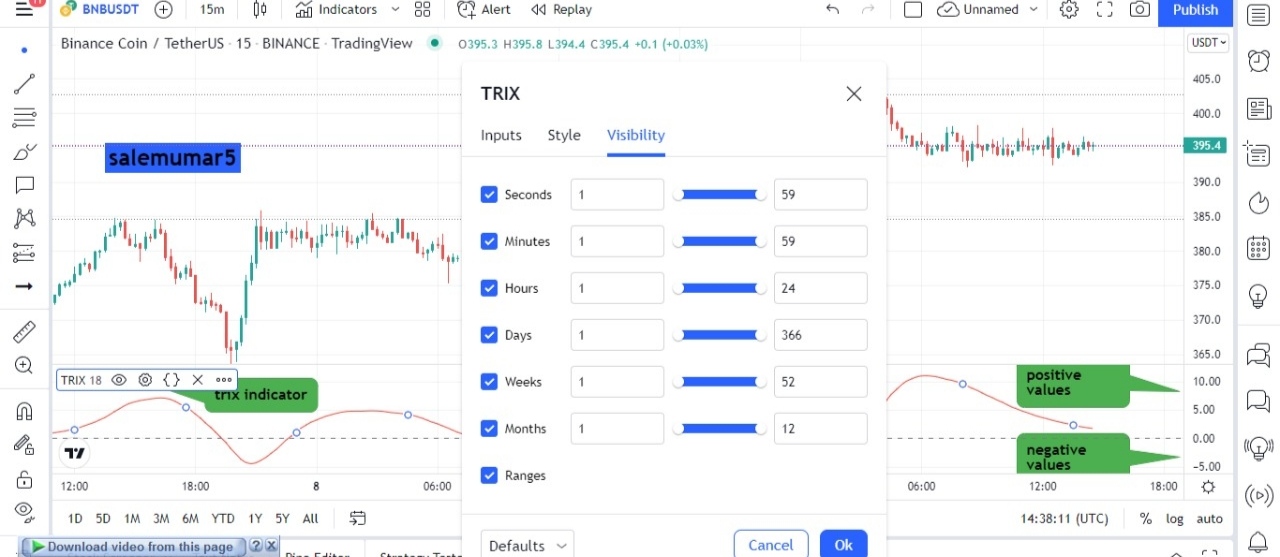
- Here the visibility is based on calculation according to sec, mins, hours, weeks and month with different level you can see below.
QUESTION:3
3.Based on the use of the Trix indicator, how can one predict whether the trend will be bullish or bearish and determine the buy/sell points in the short term and show its limits in the medium and long term. (screenshot required)
Trend identification buy and sell signals in short term and long term limitations
As you guys are now familiar with bullish and bearish trends in market and we had previously discussed this term mainly in our course lets elaborate the bearish and bullish cycles in TRIX indicator.
Here the concept of TRIX Indicator bull and bear stage is affirmed by zero line where the oscillator cross over the zero line above position and move upward its bull run 🐂 phase whilst if the oscillator crosses the zero line from below and move Downtrend it will be a bear 🐻 trend in market.
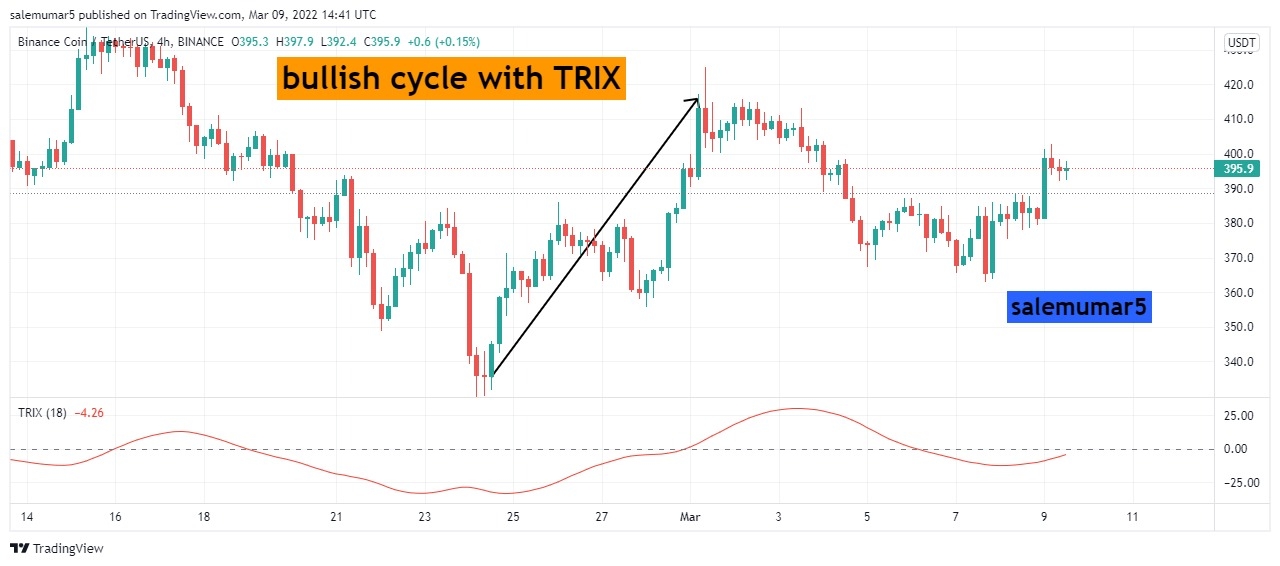
Bullish trend:
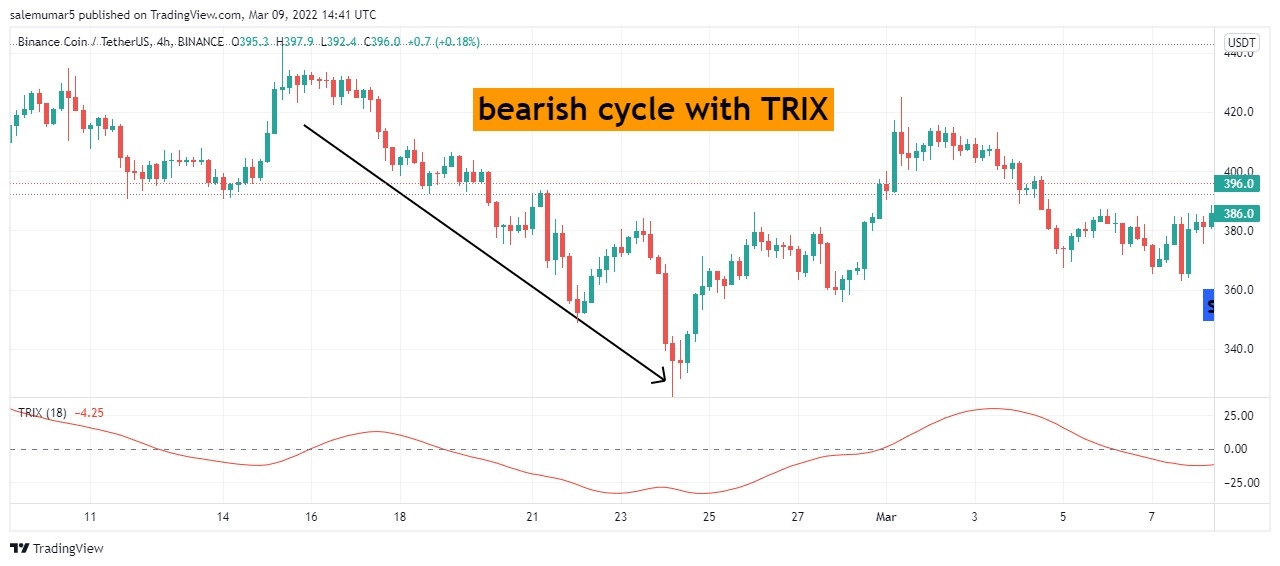
Bearish trend:
Buy and sell signals are generated on the bases of zero line cross over while you can achieve the up trend and buy trend and right after the breakouts where crossover occur take you trade in parralel
This TRIX will signify the buy signal when the trix line cross the zero line from bottom to top and continuously move upward untill the maximum positivity of TRIX is achieved same where the TRIX cross over the market by top to bottom you can trade in sell position untill the maximum Downward negativity achieved. Lets analyse them below in charts with detail.
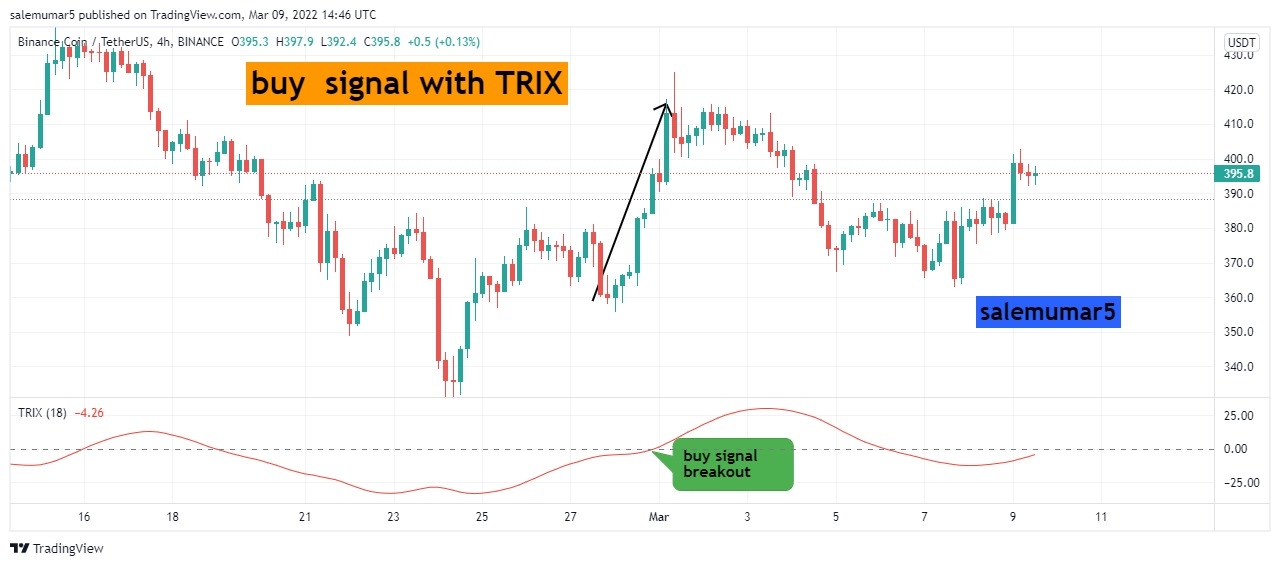
Buy and long position trade:
Here the chart below you can see the BNB/USDT with 4hrs chart its mainly attract the trix because time frame is large, though you can see the point where i enlightened the call out where the breakout and cross over has been occured from bottom to top and price continuously move upward and do maintain your trade with 1:4 will provide you good results.
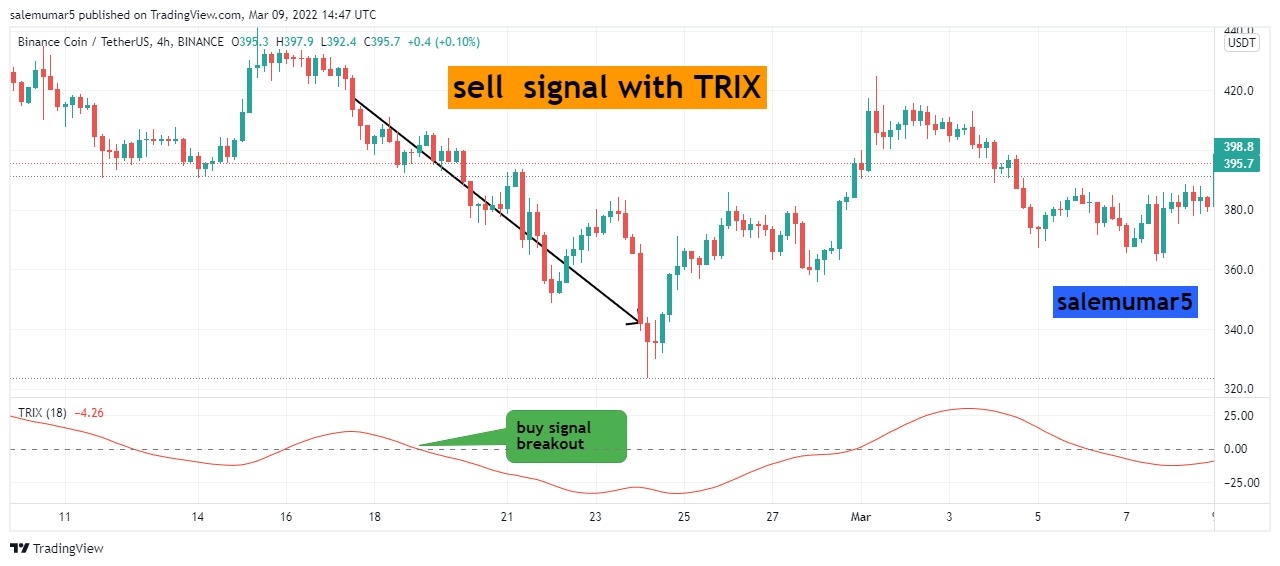
Sell and short position trade:
Here the chart below you can see the BNB/USDT with 4hrs chart its mainly attract the trix because time frame is large, though you can see the point where i enlightened the call out where the breakout and cross over has been occured from top to bottom and price continuously move downward and do maintain your trade with 1:4 will provide you good results.
QUESTION:4
4 By comparing the Trix indicator with the MACD indicator, show the usefulness of pairing it with the EMA indicator by highlighting the different signals of this combination. (screenshot required)
Combination of TRIX and EMA along MACD crossover
As you know the approach of EMA and MACD we will elongate them with TRIX first we need to understand the medium understanding between TRIX and EMA 9 these both indicators provides us the means of MACD and where you can judge the same market sentiment when you trade this TRIX and 9 EMA.
In TRIX and 9 EMA can make a buy trade when TRIX crosses moving Average from bottom to top and sell signal arise when TRIX crosses the EMA top to bottom this methodology is similar when you use MACD.
lets analyse them in chart below you can see the time frame is short term because this will provide good results in short term rather than long term using ,4hr time frame bnb/usdt pair.
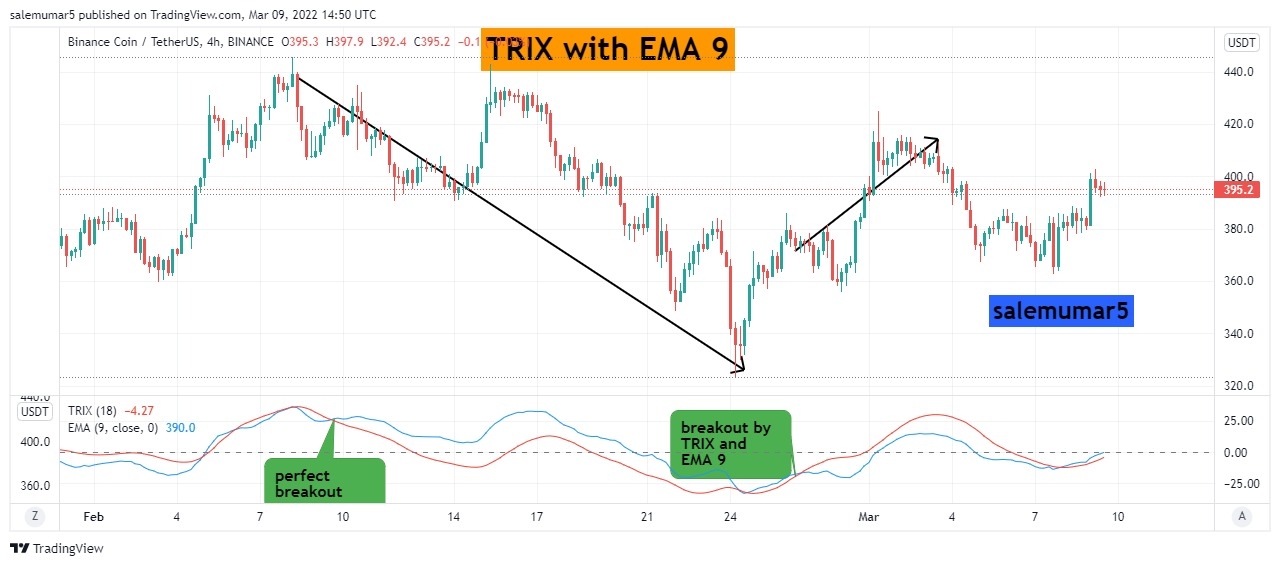
The chart above you can see the ema and trix makes good combination but i analyse one thing you should wait for the trix breakout with zero line when it confirm and you can see above already ema and trix gave breakout to Downward but price again took a correction but when trix break the zero line a perfect bearish zone starts.
The chart below you can see the TRIX AND EMA showing perfect result in market as far with MACD thkugh TRIX providing more better authentication and providing smooth adjustment of trades in market.
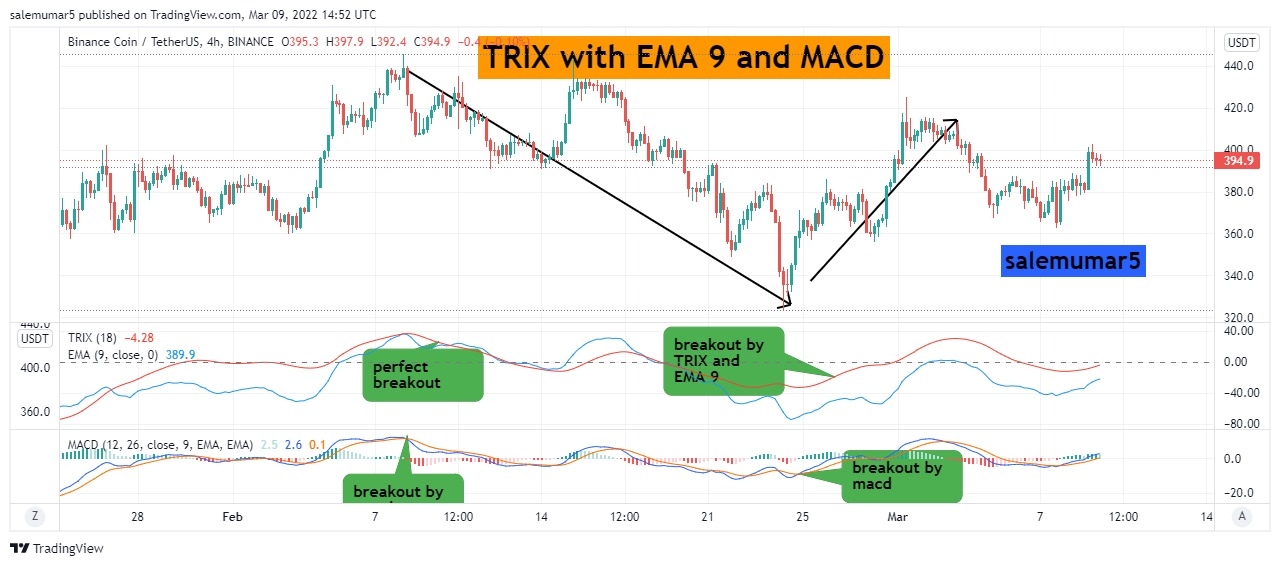
Here above i observed that trix only play one man show where the price obeys trix momentum and ignored both ema and macd signals thus you can not rely only on one indicator although here basic concept is to visualise is that the corresponding macd and trix ema9 maintain good relationship howbiet macd is quite lagging but providing the signals in good medium.
QUESTION:5
5 Interpret how the combination of zero line cutoff and divergences makes Trix operationally very strong.(screenshot required)
TRIX reliability with zero line and divergence
As far above in bearish and bullish nodes of marekt we identified the ZERO line reliability though here zero line cut off will be very significant aspect where the zero cut represent another important observation that when TRIX crosses zero line from bottom to top here its upward bullish signals held in top to bottom crossover a downtrend bearish signal obtained though if we identified this momentum properly ultimately using strong support and resistance levels can provide us better opportunity in market and strong divergence will be verified.
Here below you can see the zero line make a perfect cut off and price starts upward whilst a divergence has been established in upward zone though support level also correcting the price pressure and maintaining tremendous results for bullish cycle.
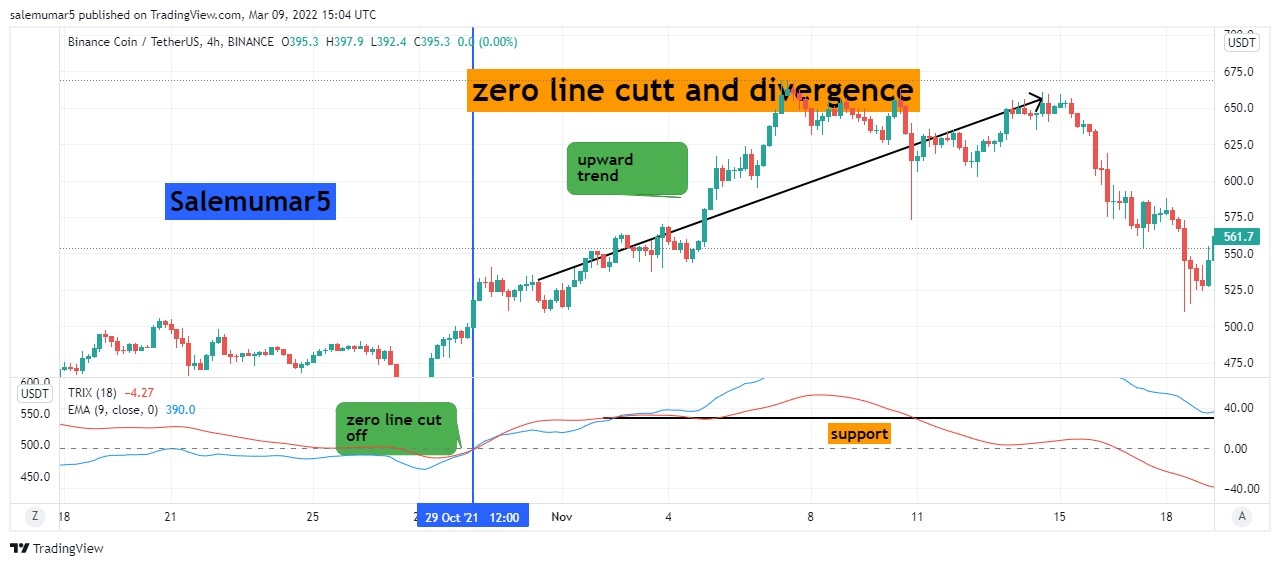
Though these divergence is a root of trading for every trader to maintain their trade more scalable reliable and better confidentiality where the strong signals extraction can be achieved lets elaborate a chart below showing strong zero line cut off divergence and representing a classical market structure.
QUESTION:6
6 Is it necessary to pair another indicator for this indicator to work better as a filter and help eliminate false signals? Give an example (indicator) to support your answer. (screenshot required)
TRIX with supporting Indicator
TRIX is not aloneness indicator where the support matter but every indicator needs parralel indicator to react in market because we are trading in cryptocurrency though it is very rare and implied that using different Indicator in parralel is universal and you will be safe from false signals and capturing right signals at right time.
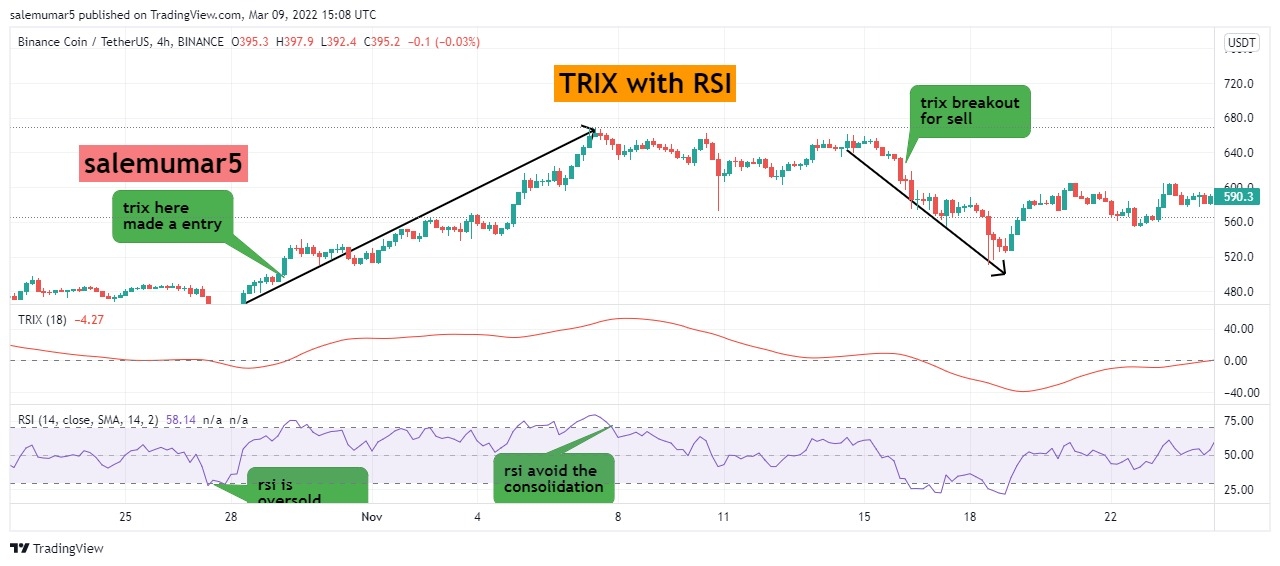
TRIX with RSI:
The chart below is BNB/USDT with 4hr time frame where you can see the Trix making little bit lagging for upward trend but rsi already confirm the trade and is in overbought position after hours trix make perfect confirmation to drive the price in upward direction and bull run confirmed. Similarly you can see a consolidation phase has been started and here the market fails trix but rsi confirms the oversold area and gave a signal and few hours later TRIX also affirm the trade for downward bearish cycle.
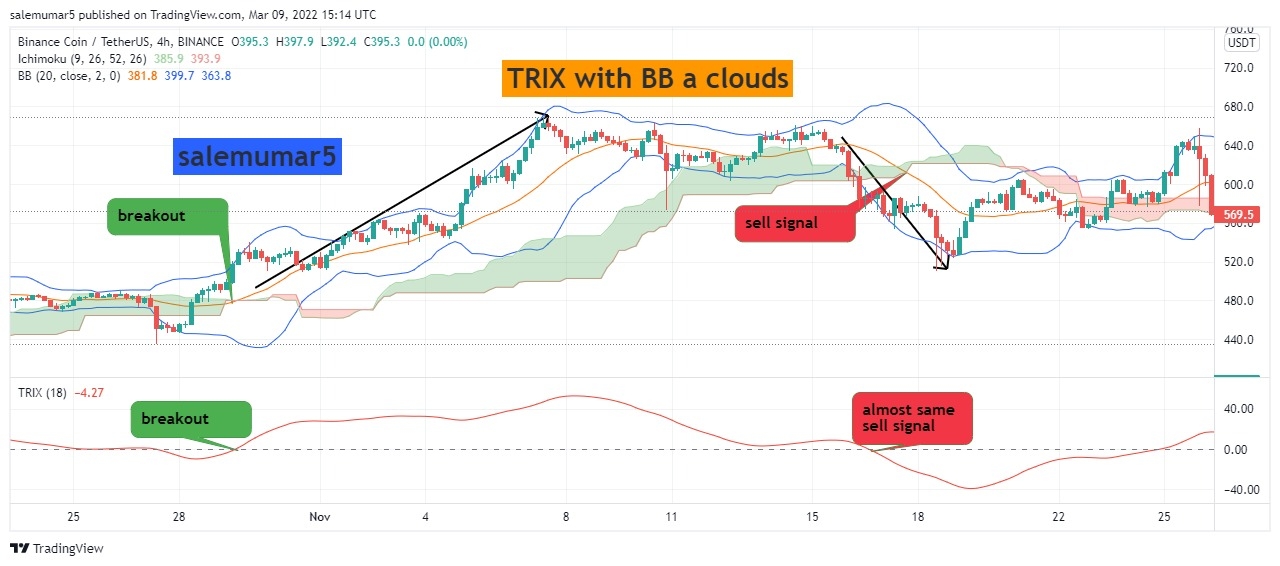
TRIX with ichimoku and BB:
The ichimoku and BB are perfect match of TRIX this strategy is so perfect that future analysis are also met in single trade, you can see below how breakout has been extracted by both indicators in perfect time frame base line is also above ichimoku candles are bullish and trix make a Breakout confirm upward trend seems, similarly the downward trend also occur first trix indicator signals us the downward motion but right after that bichi strategy also affirm us the trade.
Note You should must always need supportive indicators in your trade if you ain't believe you can check out my timeline which mistakes i have done relying on two Indicators and liquidate in this volatile market. Do use indicator in parralel not all Indicators are perfect yet.
QUESTION:7
7 List the pros and cons of the Trix indicator:
Pros and Cons
As far we had use and implemented this indicator though its quite smooth and good for trading, also i will ensures this Indicator with my different indicator and strategies howbiet every indicator having cons and drawbacks lets explore both of them.
Pros
1- The Trix indicator having strong fundamentals on oscillator.
2- TRIX also enhances your trade by giving string signals in short and long-term whilst it will be more beneficial in long-term.
3- The Trix Indicator having good relationship with ichimoku though this Indicator having strong collaboration with different Indicator.
4- Held in volatile market the trix will ensure you 70% positive divergence in market neglecting the fundamentals and news.
Cons:
1- EMA lines is considered to be lagging Indicator though this Indicator having a mixture of EMA's though lagging context has been observed in high volatile market.
2- The calculation is very complex though delay in signal is observed though alone using TRIX is not good.
Conclusion:
The TRIX Indicator is very important and healthy Indicator to drive out positive feedback from market and i feel using this Indicator is like gentleman Indicator having strong pressure with price momentum to capture the true signals in market.
Held using this Indicator with different indicator will definitely extract us strong signals in market as we discussed that every indicator having its pros and cons though might be a little lagging Indicator. Hence its a strong oscillator Indicator and helps to identify the direction with proper trend indications. Also in professors post we looked that the future trends are also captured though it will be good indicator for us to accumulate it with ichimoku to provide positive and fruitful opportunities in market.