[Crypto Trading With Linear Regression Indicator] || Crypto Academy / S5W5 || Homework Post for @ kouba01 || By @salmanwains
This is Season 5 Week 5 of Steemit Crypto Academy and I'm writing homework task about "Crypto Trading With Linear Regression Indicator" assigned by Professor @kouba01

Question# 1
Discuss your understanding of the principle of linear regression and its use as a trading indicator and show how it is calculated?
If you are often in the habit of making wrong trade entries either in the consolidation or phase or to place traders later to recognize that the trend to the opposite side you need to start using reliable indictors.
Linear regression indicator is one of those. The indicator is more often used in predictive markets and comprises of different variables the dependent variables and the independent variable to determine an outcome. The outcome in other words is the consequence of the relationship between dependent and independent variables.
The LR indicator when applied to the chart appears graphically as a single line that is found to be touching and crossing several points marked on It developing a relationship between the dependent variable on the y axis and independent variable on the x-axis.
From the relationship of the variables, we look for two things
1. If the variable is effective in predicting the motion of the market.
2. And the effect or the impact of a variable on the outcome.
With all the readings we are able to deduce the trend direction, trend strength and thus point of trend termination. It is used in similar fashion like the moving averages. The major advantage it ahs over moving average is it is more sensitive to changes on the market, sows less lags. It plots the ending values of linear regression line drawn on the specified candlesticks.
These ending values can be the closing values or the high values. In the moving averages we see that the plot data based on past action instead in linear aggression the indicator plots data based on where the linear aggression is expected to be and thus it moves responsively than a simple moving average.
A linear aggression line is drawn by taking the square of the end points and the points farther away from the line thus has more impact on the outcome.
Linear aggression is used to take trade signals during strong trends similar in pattern to a moving average. It also helps in determining overbought and oversold signals.
Calculation
It is calculated using the formula.
Y = A + Bx
- A is intercept between price and time = 0
- B is the slope of the line.
- x is the independent variable (Time).
- Y is the dependent variable which can be calculated by adding the values in the formula.
For example, if x=34, B=2.8, and A=0 then
Y = A + Bx
Y=0+2.8*34=95.2
This is one value of and many values like these make the regression line.

Question# 2
Show how to add the indicator to the graph ? How to configure the linear regression indicator and is it advisable to change its default settings? (Screenshot required) ?
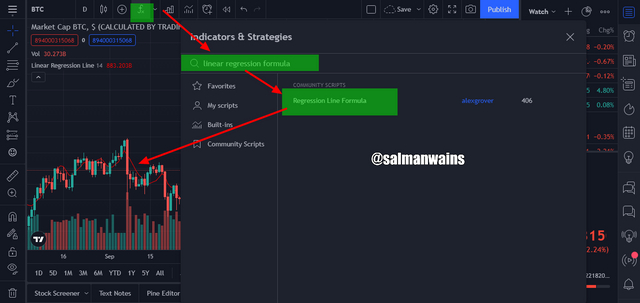
To add linear Regression indicator in the chart, create a free account on tradingview.com.
1. Go to the chart option and select any pair.
2. Click on the fx indicator icon on the top bar and search the name in the search bar.
3. Click on it to add it in the chart ( a single click add the indicator once a double add it twice therefore avoid multiple clicks).
In the indicator customization bar on the left side, we can see a settings icon by click on it we can change the style, and period of the indicator.
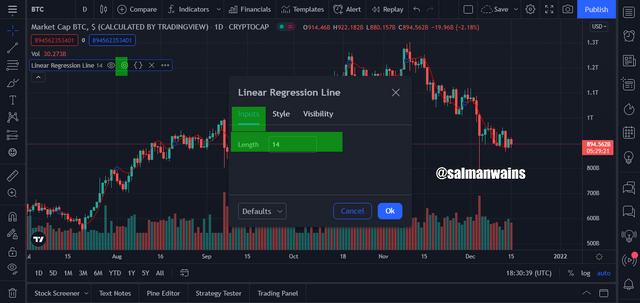
We can also change the thickness and appearance, color of the line.
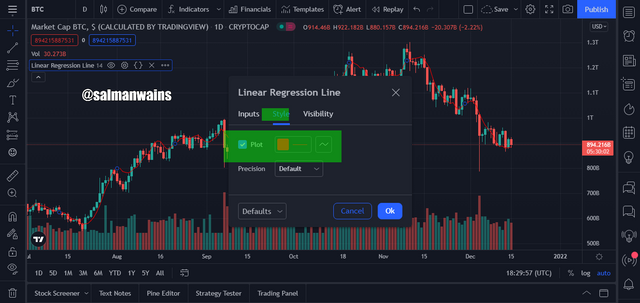
Many traders think that It is not advisable to change the default settings however changing the periods and length is completely on the trader. Long term traders often prefer longer periods to see only the high strength signals however scalpers shorter settings below we can see a chart with LR with 14 (red line) periods and 50 (blue line) periods respectively.
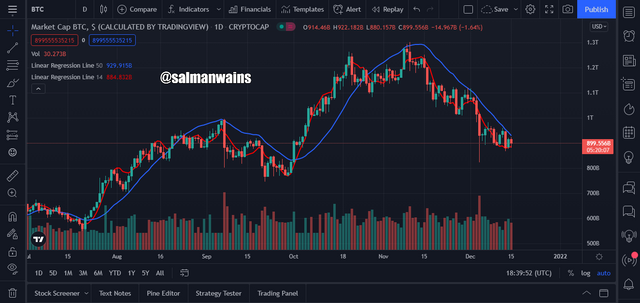
While the 14 periods lien touched ever signal the 50-line touched on the strong. There other traders who use ever large periods such as 60, 66, 72 etc.
Question# 3
How does this indicator allow us to highlight the direction of a trend and identify any signs of a change in the trend itself? (Screenshot required)?
As discussed earlier linear regression can be used in similar as that of a moving average thus when it moves parallel to the price action it denotes the direction of the trend. When the LR moves along with the price it is a sure signal of a trend. The price during this point will not break the LR indicator. During a reversal the LR indicator will have a change in its slope.
Thus, we can see the trend changing on the indicator. The price line then crosses the LR. As the price changes the direction so does the LR line and the indicator will move in the new direction.
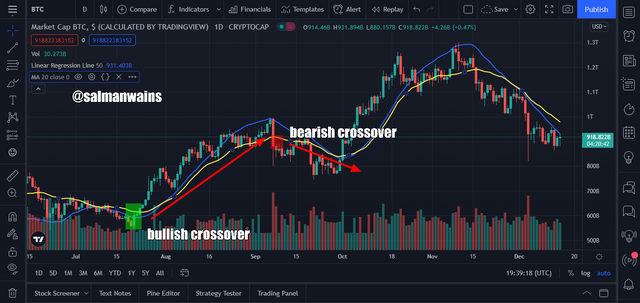
For example, in the BTC/USDT chart below we can see that the LR line moved along with the price action in an uptrend. And as the trend weakens to turn to the downward direction the slop of the LR changes and the price action crossed the LR from above and continued moving down.
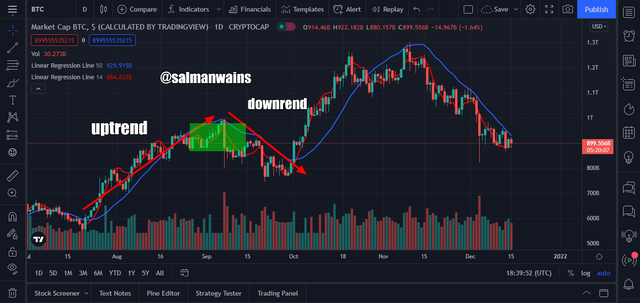
The direction of the LR line can be seen in direct relation with the trend and hence it moves up in uptrend and down in downtrend. When the is reversal there is a lower or upper crossover in addition to changes in the slope.
Question# 4
Based on the use of price crossing strategy with the indicator, how can one predict whether the trend will be bullish or bearish (screenshot required)?
Like in the moving averages the crossovers in the Lr indictor can help in identification of the trend.
In case of bullish crossovers, the bullish candle should touch the LR line from below and the crosses it moves above it. Thus, the bullish candle during crossover should be strong enough to support this crossover. This can also be an early indication of a buy signal.
In case of bearish trend prediction, the price action lien should touch the LR line from above to cross it and move below it. In case of a bearish trend prediction the bearish candle should be strong enough to cut the LR line. This can be an indication of the sell signal.
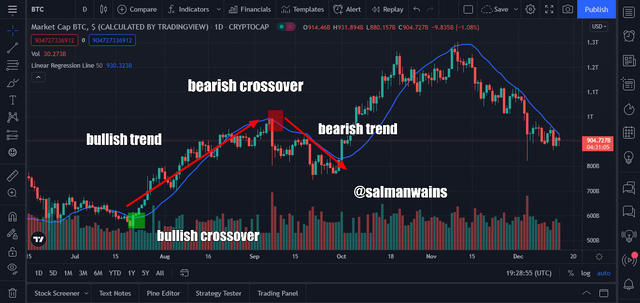
In the chart above we can see bullish and bearish crossovers.
Question# 5
Explain how the moving average indicator helps strengthen the signals determined by the linear regression indicator. (Screenshot required)?
LR indicator is a smoothed version of version of moving average as it is obtained by taking the square roots of the values involved it filters lags and is more responsive to changes in the market. The only problem is as it is more sensitive it may give false signals and these signals can be filtered by using the moving averages.
For example, in the chart below we see a setting of the moving average and the LR combined.
In the chart above the moving average helps in the confirmation of the bullish and bearish crossover ruling out the chances of the wrong buy and sell entries. In similar ways when the moving average and LR indicator it helps filter false signals due to sensitivity of the LR and further helps in confirmation of the signals.
Question# 6
Do you see the effectiveness of using the linear regression indicator in the style of CFD trading? Show the main differences between this indicator and the TSF indicator (screenshot required)?
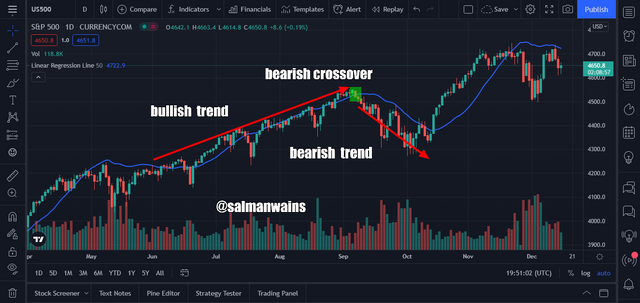
LR indicator is also successfully used in CFD-trading and is there also used to confirm trend direction and reversals. Her it also identifies the bullish and bearish crossovers identifying start and termination of the trends.
In the US500 chart below we can see the application of the LR indicator in the CFD markets. Similar to the crypto markets the LR indicator lien moved along with the price action when signifying trend continuation and strength of the trend in a direction and when the trend weakened its slop changes until we see a crossover.
The major differences between the TSF indicator and the Lr indicator.
| TSF | LR |
|---|---|
| In case of the TSF every bar regression is measured using a method called the least square fit method. | in case of the LR indicator the value of the dependent variable is calculated using the independent variable. |
| The ending value of the regression line is calculated using the slop. | the ending value of the regression does not involve slope in the calculation. |
| It is more commonly used by long term traders. | It is most commonly used by day traders and scalpers. |
| It is more responsive the LR to the price changes. | It is more responsive than the moving average but is less responsive than the TSF. |
Question# 7
List the advantages and disadvantages of the linear regression indicator?
Following are the advantages of the Linear regression indicator:
Pros:
- It is the smoothed version of the moving average.
- It produces less lags than moving averages.
- It is more sensitive and responsive to price actions.
- It is very easy to understand when plotted on the chart.
- It makes it easy to spot trend direction, strength and reversals.
- It is reliable to spot trade signals.
Cons:
- It is only reliable to be used in strong trends.
- In case of volatile markets, it produces a lot of false signals.
- You need to use other indicator to filter false signals and confirmation of trade signals such as the RSI or moving averages.
Conclusion:
Summarizing the whole post, we can say that Linear Regression indictor is based on dependent and independent variable to calculate the regression line which is then plotted graphically. It is very similar to moving average but is more sensitive and the values are squared. In addition to that the indicator is best applicable in short term trading in settings between 50 to 66.
Note :
All the Screenshots have been taken from the tradingview.com .
CC:
@kouba01
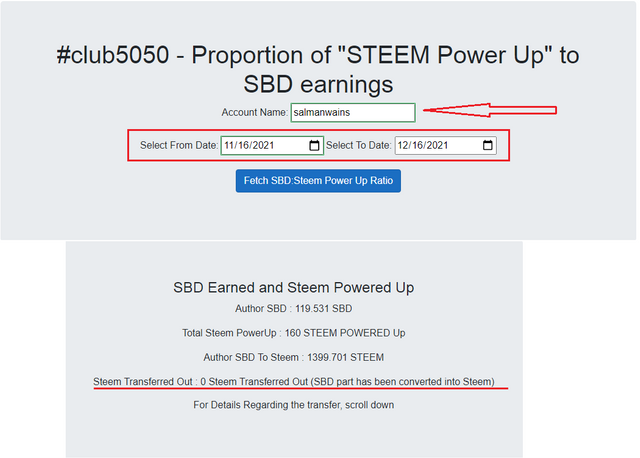
Club5050 Eligible