[Crypto Trading With SuperTrend Indicator] || Crypto Academy / S5W7 || Homework Post for @ kouba01|| By @salmanwains
This is Season 5 Week 7 of Steemit Crypto Academy and I'm writing homework task about "Crypto Trading With SuperTrend Indicator" assigned by Professor @kouba01

Question# 1
Show your understanding of the SuperTrend as a trading indicator and how it is calculated?
Traders who often us dynamic support and resistance levels to determine trends often use indicators like SuperTrend to identify trends of an asset. Like many indicators Supertrend indicator helps in analyzing market trends and further enhance our trading experience. An important market strategy is to place trading signals after the identification of the trend reversals.
It helps in visual identification of accurate trends and is based on average price of the asset. It appears as green and red bands around the price. The data for the SuperTrend is based both on the average price and the volatility of the asset involving the ATR.
The green band formed below the price indicates an uptrend and the red band above the price indicate a downtrend. The green band is thus called the lower band and red band is called the upper band.
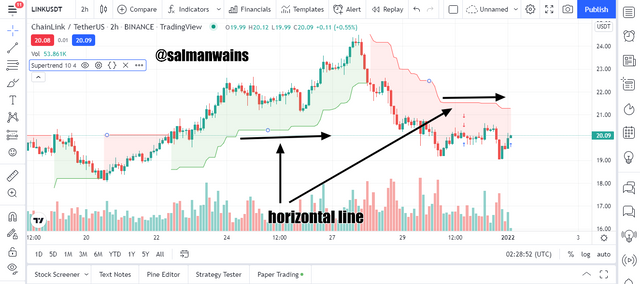
Graphically we thus see SuperTrend indicator never go in opposite direction of the trend so in case of divergence the indicator shows a horizontal line.
Calculation
The calculation of the Supertrend involves Average price, factor multiplier and ATR value.
Upper band= (RED line) = (High + Low) / 2 + factor multiplier × ATR.
Lower band= (Green Line) = ( High + Low) / 2 – factor Multiplier × ATR
ATR = [[ 13 × Prior ATR] + current TR]/2
Example
For example, a crypto asset has the following values in case of an uptrend.
High=141
Low=112
Multiplier= 3
ATR= 41
Lower band= (High + Low) / 2 – factor Multiplier × ATR
= (141+112)/2- 3x41
=253-123
=130
High=128
Low=156
Multiplier= 3
ATR= 73
Upper band= (High + Low) / 2 + factor multiplier × ATR
= (128+156)/2 + 3 x 73
= 361
Question# 2
What are the main parameters of the Supertrend indicator and How to configure them and is it advisable to change its default settings? (Screenshot required)?
There are two main parameters.
- Factor (multiplier)
- ATR length (number of periods)
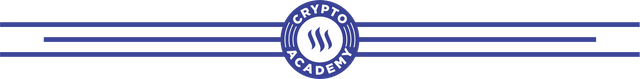
You can see them by clicking on the small settings option along with the indicator as shown in the screenshot below.
Here you can customize the Factor and the ATR which specifies the length or the number oof periods taken into consideration. To edit them you simply have to click on them and enter the desired digits.
Whereas ATR represents the length of period taken into consideration the Factor accounts for the volatility as we discussed earlier that these two factors affect the calculation of the ATR.
You can have different settings based on the type of your trading style and the asset in which you are trading. In the above screenshot it is clear that in trading view platform the default values for the factor are 3 and for the ATR it is 10.
When we decrease the Factor, the indicator behaves more sensitively and moves closer to the price action and the color changes with every small move the price makes. The smaller factors are ideal for lesser volatile assets such s the stocks.
The traders are able to see more reversals and buy and sell signals. But as it is a constant problem with every indicator that too sensitive settings increase the chances of false signals so smaller factors are not recommended for crypto because they are very volatile.
Similarly for more volatile assets it is recommended to use larger factors such as 4 or 5 but too great because it allows the trader to skip on potentially strong signals as the indicator moves away from the price action and does not respond to every change.
Question# 3
Based on the use of the SuperTend indicator, how can one predict whether the trend will be bullish or bearish (screenshot required)?
SuperTrend indicator when used with right settings based on the trading style and asset type can actually give predictive signals regarding the future trends. The information acquired from the indicator can thus be used to predict the trends.
There are visually two indications of a trend in the indicator the position of the line and the color of the band.
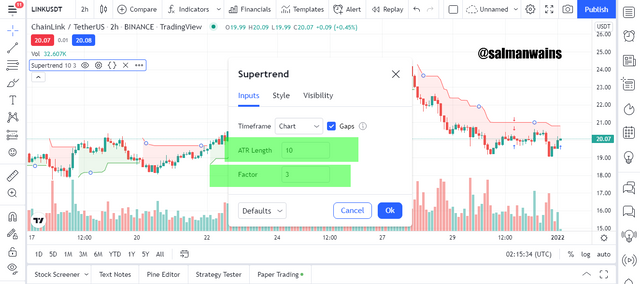
In case of the formation of a line that is formed below the price action which is covered by the green band we are in a bullish trend or an uptrend and the price is therefore expected to go higher and higher.
Thus an uptrend can be expected when the Uptrend line is covered in green band with a green line acting as a support as shown in the Screenshot below.
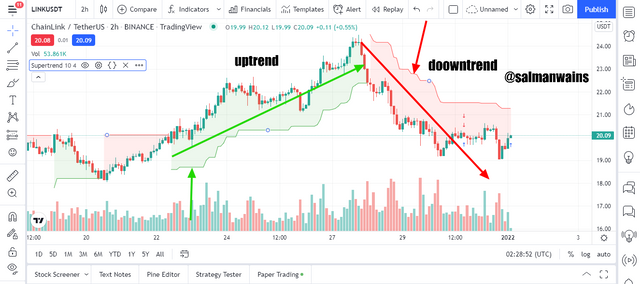
Similarly in case of the bearish trend the SuperTrend line is formed above the price action and the price action is covered in a red Band.
It is also noticeable that the direction of the Supetrend lines is also in harmony with the trend. The line moves higher and higher in case of an uptrend and it follows a downward slop in case of a downtrend. Sometimes wee also notice horizontal lines that indicate divergence and one should wait until the price action breaks this horizontal lien and follow a definitive trend.
Question# 4
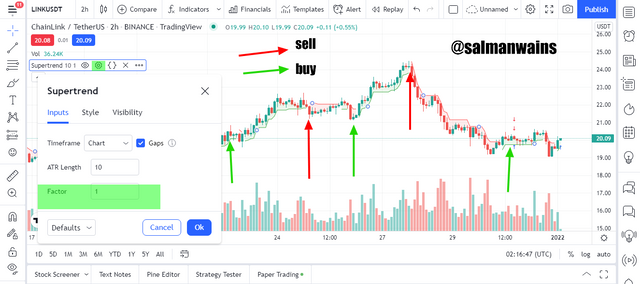
Explain how the Supertrend indicator is also used to understand sell / buy signals, by analyzing its different movements.(screenshot required)?
SuperTrend can also be used to place accurate buy and sell signals. To place buy and sell signals it is always recommended to wait for the start of a new trend. As we can use SuperTrend to predict trends we can see the price pull outs to place reliable buy and sell signals. We do not trade unless the indicator line is a slope. We do not trade horizontal lines.
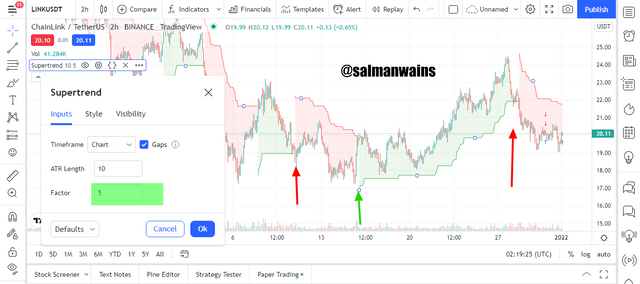
Buy signal
to place a buy signal, make sure that the trend is bearish and the price action is making lower highs and lows. We shall then see a weakening of the trend and finally the price should break the upper band to move above it. We wait until the color of the line changes to green and it moves below the price action.
We exit the trend once the start of the red line can be seen forming. We can also use the upper and lower band to lace take profit and stop loss signals.
Sell Signal
In case of sell signal the price should currently be bullish but it should be giving signals of reversal. finally should break the lower and the bearish candles could be seen forming after the formation of a upper band and red channel.
Too exit the trade you will look for a reversal and the formation of a lower band identifying the start oof an uptrend. The stoploss and take profit can be placed using the bands as shown.
Question# 5
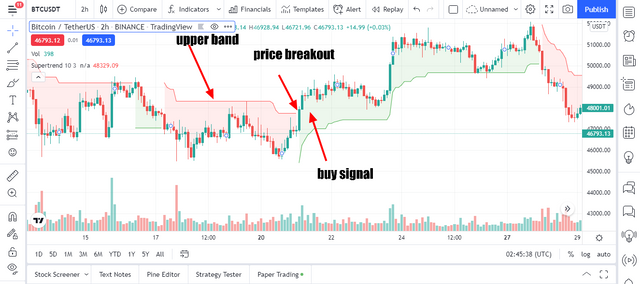
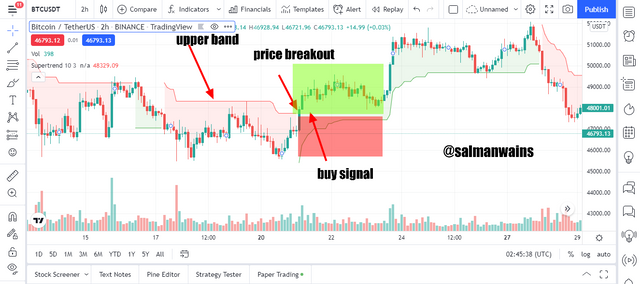
How can we determine breakout points using Supertrend and Donchian Channel indicators? Explain this based on a clear examples. (Screenshot required)?
Using the Donchian along with the Supertrend validates the breaking point and removes the chances of false predictions. We look for breakouts on Donchian and then compare them with the Supertrend indicator to finally acknowledge the breakout.
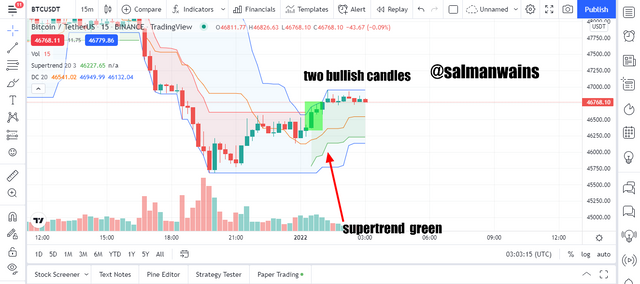
In case of a breakout indicating a buy signal we look for two consecutive bullish candles breaking the upper line of the Donchian channel and then channel and then compare to see if the Supertrend is also is in green and lower band indicating a bullish trend.
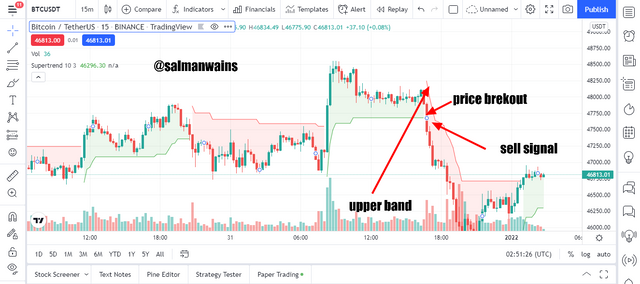
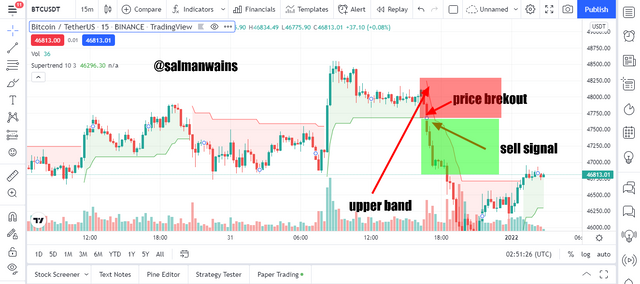
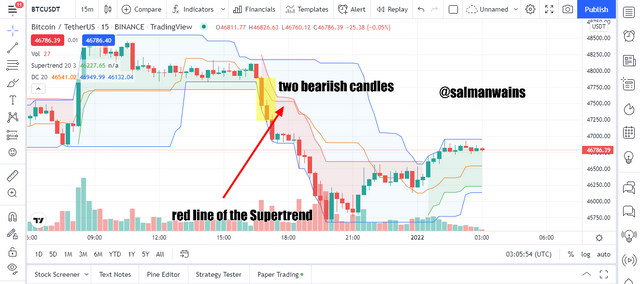
In case of a breakout for sell signal we should look for two bearish candles touching and cross the lower line of the Donchian indicator and then we should compare to see if the Supertrend is also showing a bearish trend with the formation of a red Upper band.
Question# 6
Do you see the effectiveness of combining two SuperTrend indicators (fast and slow) in crypto trading? Explain this based on a clear example. (Screenshot required)?
It is a common practice to use MA lines with different periods to observe their overlapping or free movement to predict breakouts and trend confirmations. Combining two Super trend one slow and fast would have a similar effect on the predictive analysis.
Just as we look to both Mas in case of double MA setup when placing a buy or sell order the case here will also follow suit and thus, we ill look for the alignment of both the indicators to place a signal.
To add a slow indictor we will use the default settings while a fast indicator as it will be more sensitive can be set to ATR 20 and Factor 1.
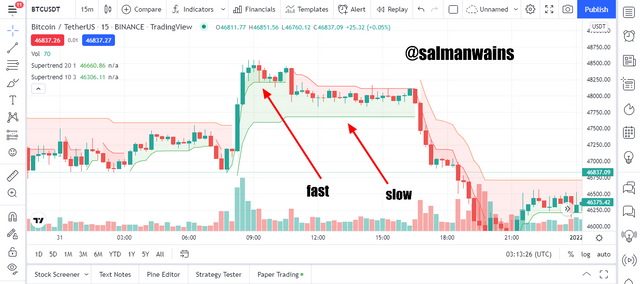
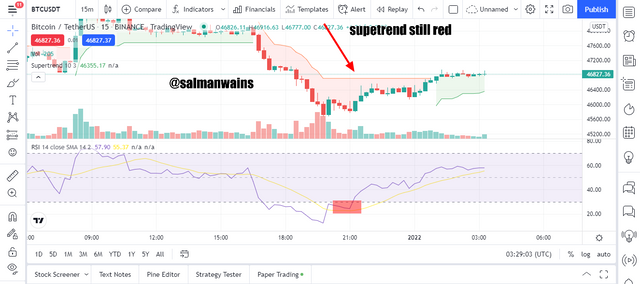
The importance and effectiveness of using two indicators with different sensitivities can be understood from the screenshot below. In the chart below we can see a contention between the two indicators when the bullish trend was weakening.
The slow indicator was still showing a horizontal yet green line but the fast indicator showed a downtrend. It is not the matter of which reading is more accurate yet the contention between the two showed that it may not be the right time place any bid and one should until both come in alight as they do later.
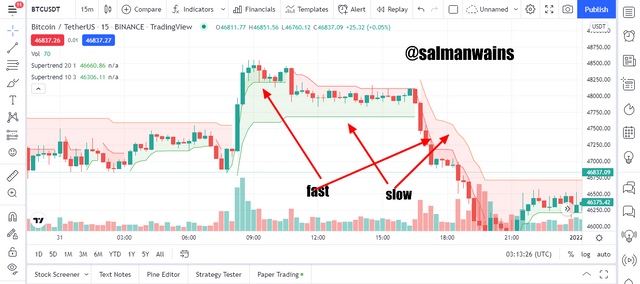
In contrary to above screenshot the two indicators can be seen to be moving parallel to each other signifying a strong bullish trend and sell signal. Thus the dual indicator setup helped in understanding and pinpointing more accurate and strong trends.
Another aspect is that the use of slow term indicator along with a fast helps in avoiding early exits but on the same side you may lose early signals waiting for the two indicators to align so you may be getting more or less the same margin on the trade.
Many traders therefore prefer to use two different indicators rather than using two Supertrend indicators.
Question# 7
Is there a need to pair another indicator to make this indicator work better as a filter and help get rid of false signals? Use a graphic to support your answer. (screenshot required)?
It is always advantageous to use a combination of indicators rather using a single. Because no indicator is 100% accurate a single indicator is more likely to show false signals that can be identified in time if we are using another indicator along.
In addition to that it is to be understood that we not only use a second indicator just to filter out the false signals but to also see the market from different perspectives. For example, if we use RSI along with Supertrend we will be able to place sell or buy orders by looking at trend, volatility and the momentum generated by the buying and selling pressure this would bring more accuracy in our analysis.
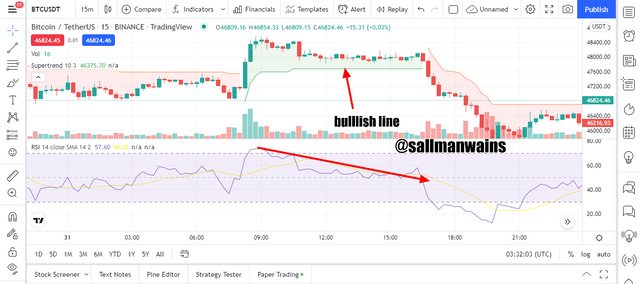
For example in the screenshot bellow we have coupled RSI and SuperTrend.
We generally would place a buy signal once the RSI is out of the oversold zone and bullish price candles can be seen forming. But now that we have Supertrend and RSI both we will do a comparative analysis. As in the screenshot below even if the RSI was out of the overbought zone we did not place the order until we confirmed a breakout on the Supertrend.
On the contrary in the case below the Super trend showed a green line even if the RSI was declining below. Supertrend was giving hope that a bullish trend can still be predicted but RSI confirmed of a bearish breakout soon.
Question# 8
List the advantages and disadvantages of the Supertrend indicator?
Following re the pros and cons of the SuperTrend indicator
Pros
- It is visually signaling and move in harmony with the price action.
- It is easy to understand and interpret.
- It can be used for different assets following the adjustments in its parameters.
- It takes into account both the average price and price volatility.
- Can be used in conjugation of other indicators to confirm signals.
Cons:
- It can show false and delayed signals since it is based on simple on chart data.
- It cannot show satisfactory indications in case of no trend in the market.
- You may need to acquire experience for the accurate settings of period and ATR based on your asset.
Conclusion:
To summarize the post Supertrend is an indicator that has two parameters the ATR and the factor. It used for the confirmation oof the trends, to find out the direction of the market, to indicate breakouts and place buy and sell signals. It is when used with Donchian indicator can help in accurate prediction of breakouts. Like many other indicators it is also suggestive to use it along with other indicator.
Note :
All the Screenshots have been taken from the tradingview.com platform.
CC:
@kouba01
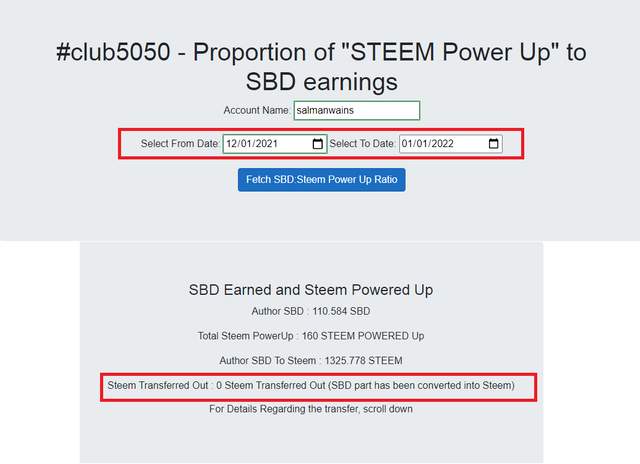
Club5050 Eligible