Crypto Academy Season 03 - Week 08 | Advanced Course - Trading Sharkfin Pattern for professor @cryptokraze
Hey steemians, in this post I will be submitting my homework task for professor @cryptokraze.


Q1) - What is your understanding of Sharkfin Patterns. Give Examples (Clear Charts Needed)
Sharkfin pattern: As the name suggests, it is a pattern in the market that looks like the fin of the shark. A sudden downtrend or uptrend followed by a sudden uptrend or downtrend can give rise to the sharkfin pattern.
What does the Sharkfin pattern reflects and looks like?
Sharkfin pattern is very useful to know about the reverse in trend at the early stage of the reversal when the Sharkfin pattern appears we can take confirmation from any another indicator (RSI) about the reversal and place out trade accordingly to get a profit.
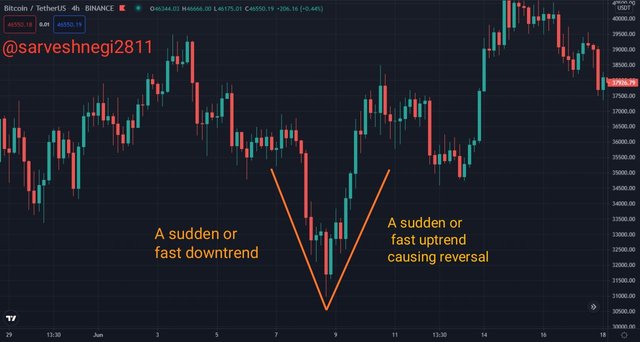
(1) "V" shape pattern: A "V " shape pattern is made when a fast or sudden downtrend is followed by a fast or sudden uptrend. It looks like a sharkfin and that was the reason for the name of this pattern.
In the example below or chart of BTC/USDT, you can see that a sudden or a fast downtrend occurs that gets followed by a sudden or fast uptrend causing a reverse in the trend.

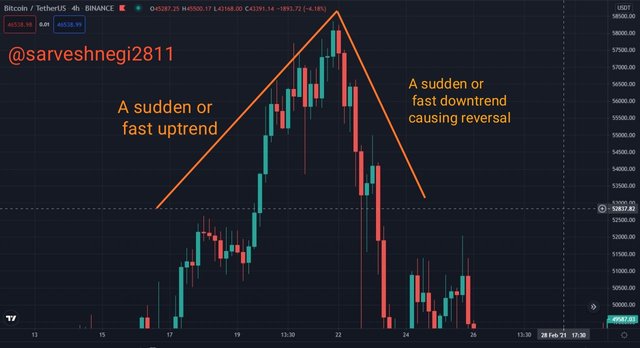
(2) Inverted "V" shape pattern: An inverted "V " shape pattern is made when a fast or sudden uptrend is followed by a fast or sudden downtrend. It looks like a sharkfin and that was the reason for the name of this pattern.
In the example below or chart of BTC/USDT, you can see that a sudden or a fast uptrend occurs that gets followed by a sudden or fast downtrend causing a reverse in the trend.
So I have shown you by the example both the patterns(V and inverted V) with the help of examples.
Q2) - Implement RSI indicator to spot sharkfin patterns. (Clear Charts Needed)
The professor has asked to use RSI or implement an RSI indicator to spot sharkfin patterns. So we must know about the RSI indicator first so that we can trade properly using the sharkfin pattern.
RSI is a momentum oscillator that tells us about the momentum of the price or how fast is the bidding happening for the asset in the market.
RSI has two bands, the upper band and the lower band. The upper band is at 70 and the lower band is at 30.
It has a default period of 14 periods, so every period you choose will get divided into 14 periods.
Now 2 condition occurs when we use RSI:
(1) Overbought: When an asset is being bought in mass is known as the overbought zone and RSI reflects a value of above 70 for this zone.
(2) Oversold: When an asset is being sold in mass is known as the oversold zone and RSI reflects a value of below 30* for this zone.
Now using RSI to spot sharkfin pattern
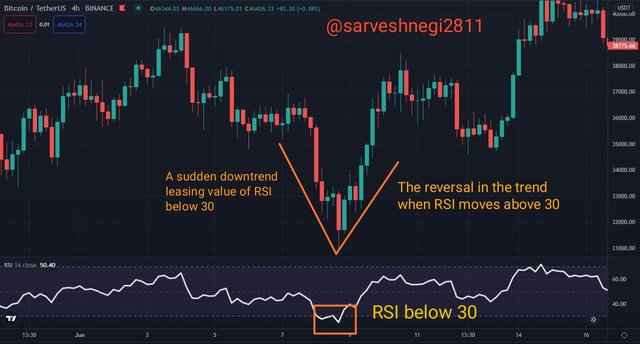
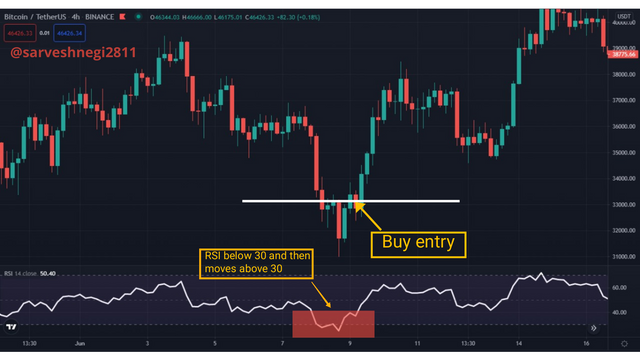
(1) For downtrend reversal or "V" pattern: There are 2 conditions that must be fulfilled to confirm a downtrend reversal and "V" pattern:
(a) The value of RSI must go below 30 or oversold zone.
(b) The value of RSI must move quickly above 30 to give rise to a downtrend reversal.
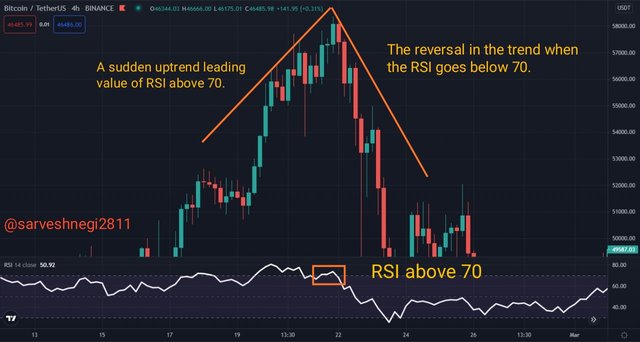
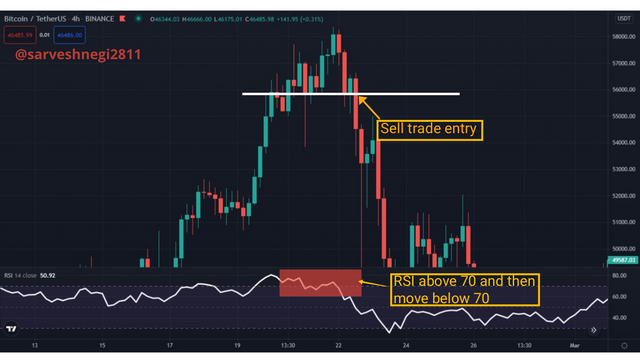
(2) For uptrend reversal or inverted "V" pattern: There are 2 conditions that must be fulfilled to confirm an uptrend reversal and an inverted "V" pattern:
(a) The value of RSI must go above 70 or overbought the zone.
(b) The value of RSI must move quickly below 70 to give rise to an uptrend reversal.
Q-3) Write the trade entry and exit criteria to trade sharkfin pattern (Clear Charts Needed)
We enter a market to trade and make a profit by selling our holdings or buying assets, everyone wants to make a profit and to make a profit, one can buy an asset when the price of the asset is low or sell his holdings when the price is high. This is obvious and a common thing that anyone knows but very few knows how and where to enter the market? So now I will be talking about trade entry criteria using sharkfin pattern.
Trade entry criteria
Steps to enter a buy trade are as follow:
(a) To get a confirmation about the reversal we must add RSI that is set to its defaults setting of the period of 14, the upper band at 70 and the lower band at 30.
(b) Wait for a sudden or fast downtrend that is followed by the inception of the fast uptrend that will cause a reversal in the trend giving rise to the "V" shape sharkfin pattern.
(c) Confirm the quick, sudden and fast downtrend by looking at RSI, the value of RSI must go below 30(lower band) and then reverses in an upward direction going above 30 giving rise to the "V" shaped sharkfin pattern.
(d) Place the buy entry when RSI clearly moves above 30(lower band).
Steps to enter a sell trade are as follow:
(a) To get a confirmation about the reversal we must add RSI that is set to its defaults setting of the period of 14, the upper band at 70 and the lower band at 30.
(b) Wait for a sudden or fast uptrend that is followed by the inception of the fast downtrend that will cause a reversal in the trend giving rise to the inverted "V" shape sharkfin pattern.
(3) Confirm the quick, sudden and fast uptrend by looking at RSI, the value of RSI must go above 700(upper band) and then reverses in the downward direction going below 70 giving rise to the inverted "V" shaped sharkfin pattern.
(d) Place the sell entry when RSI clearly moves below 70(upper band).
Trade exit criteria
After entering a market one should always know one's exit point otherwise one should suffer a loss of multiple folds or miss a profit that could have hit easily.
Steps for buy trade exit are as follow:
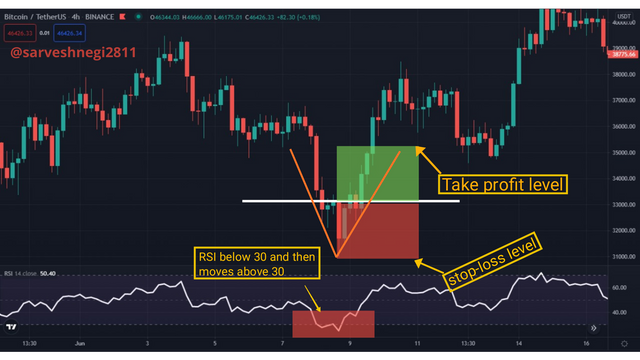
(a) We must place our stop loss to avoid the loss so that we don't suffer a loss if our trade goes in the wrong direction or our setup is invalid.
(b) The position of the stop loss must be below the swing low point of the "V" shape or sharkfin pattern.
(c) When the price reaches our stop loss levels we must exit the trade and understand that our setup was invalid.
(d) Take profit level must be placed too so that we can take profit if our trade goes in the direction we predicted.
(e) Take profit level must be greater than or equal to 1:1 (Risk to reward ratio), this ratio can vary from trader to trader.
(f) Exit the trade when our take profit level gets hits.
Steps for sell trade exit are as follow:
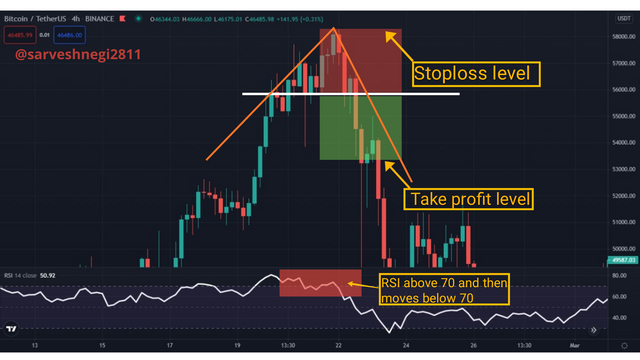
(a) We must place our stop loss to avoid the loss so that we don't suffer a loss if our trade goes in the wrong direction or our setup is invalid.
(b) The position of the stop loss must be above the swing high point of the inverted "V" shape or sharkfin pattern.
(c) When the price reaches our stop loss levels we must exit the trade and understand that our setup was invalid.
(d) Take profit level must be placed too so that we can take profit if our trade goes in the direction we predicted.
(e) Take profit level must be greater than or equal to 1:1 (Risk to reward ratio), this ratio can vary from trader to trader.
(f) Exit the trade when our take profit level gets hits.
Q-4) Place at least 2 trades based on sharkfin pattern strategy (Need to actually place trades in demo account along with Clear Charts)
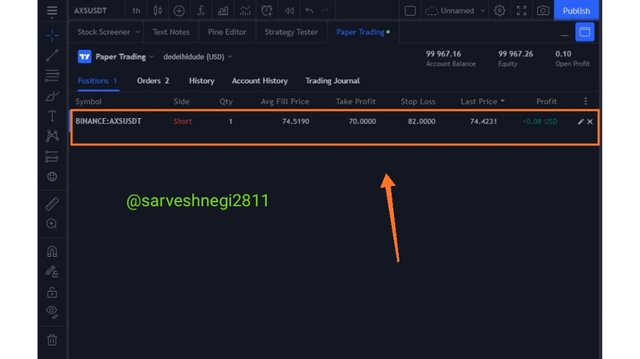
(1) First demo trade using Sharkfin pattern in conjunction with RSI:
I have used a time frame of 1 hr and the crypto asset pair I used is AXS/USD. I have executed a sell trade.
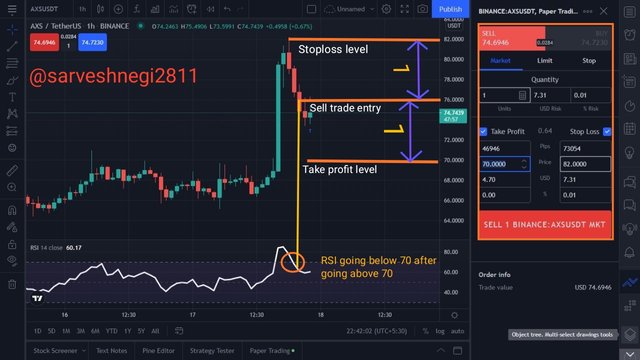
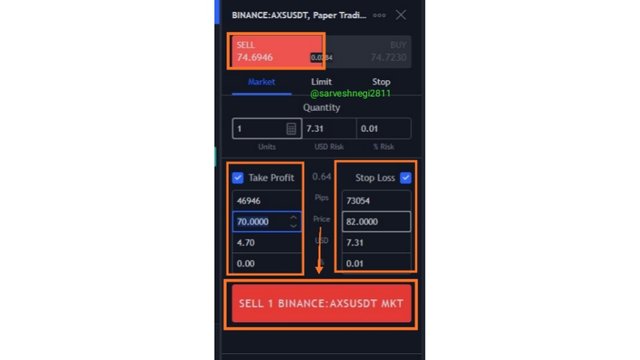
Details of my trade:
Sell trade entry: $76
Take profit level: $70
Stop loss level: $82
I have set my reward risk ratio to 1:1, as tou can see in the chart above.
76-70= 6
82-76 = 6
You can see the ratio is set to 1:1.
(2) Second demo trade using Sharkfin pattern in conjunction with RSI
I have used a time frame of 45 min and the crypto asset pair I used is AVAX/USDT. I have executed a sell trade.
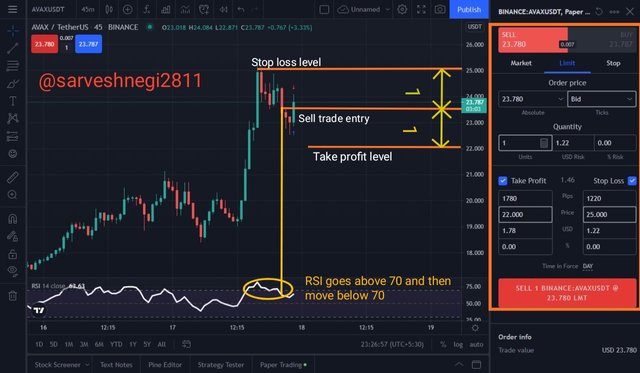
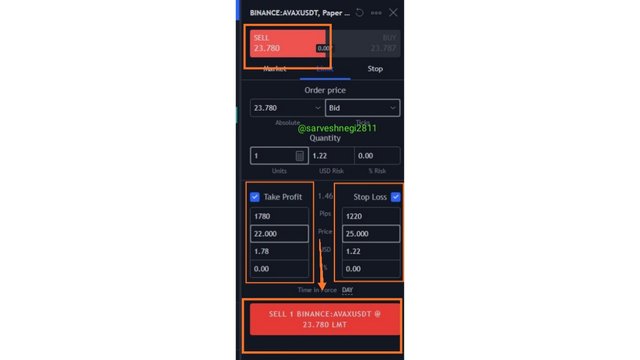
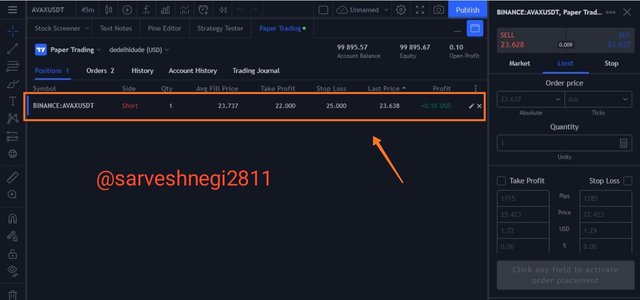
Details of my trade:
Sell trade entry: $23.5
Take profit level: $22
Stop loss level: $25
I have set my reward risk ratio to 1:1, as tou can see in the chart above.
25-23.5= 1.5
23.5-22 = 1.5
You can see the ratio is set to 1:1.
Conclusion
In a nutshell, this is a very good technique to spot or trade reversal, but it comes with the expense of confirming it with the other indicator and that is RSI, if you can spot the reversal early, you can enter the market and leave the market by making a profit, for all that you must have a lot of practice and a good knowledge of RSI indicator as well as Sharkfin pattern.
Luckily I was able to spot the reversals in the market and able to place real trades in the demo account and I have given you the proof of it.
Note: There are some points that I have used frok my previous homework task, link of the Previous task is here.
That was all from my side
Thank you
For the attention of professor @cryptokraze.
You have been upvoted by @sapwood, a Country Representative from INDIA. We are voting with the Steemit Community Curator @steemcurator07 account to support the newcomers coming into Steemit.
Engagement is essential to foster a sense of community. Therefore we would request our members to visit each other's posts and make insightful comments.
Thank you