Crypto Academy Season 6 Week 2 : Crypto Trading with Moving Average
Hello dear steemians,
 Image designed in Canva | by @shemul21
 Welcome to this trading season of Steemit Crypto Academy. Today I’m going to share my knowledge and experience in crypto trading. This is my 1st lecture as a crypto professor. Hope you'll enjoy and learn through this lesson. Let's start.

The moving average is one kind of technical indicator which is mostly used in the world. It helps traders to know the sentiment of the market. In crypto trading, the price continues its movement according to the direction of trends. Moving average plays a vital role to identify the price. In crypto trading, technical analysis is the most essential tool because it helps traders to make sure the price direction. Nowadays traders can get access to a wide range of technical indicators and the moving average is one of the major ones. In this lecture, we'll discuss about the nuts and bolts of moving average. It may help you to change the way you take entry in trade.
The moving average shows us the average price of specified recent candles. It is a very effective indicator. Moving average is also used to help highlight trends, spot trend reversals, and provide trade signals. It helps us to know the trend without any information overflow. We can get a basic concept about what average traders are doing in the market.
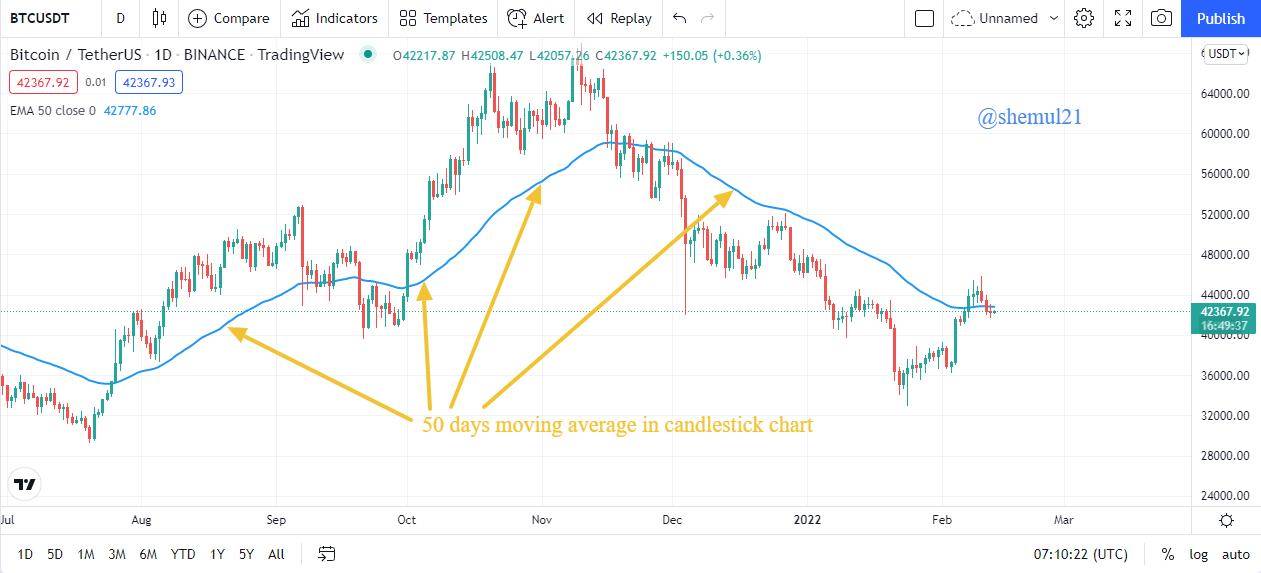
Image Source Tradingview
For example, if any crypto asset's price is above the 50-day moving average, it indicates that buyers are more active than sellers in the market. In this situation, if you want to trade on this crypto asset then you can consider it as a buying opportunity. In a candlestick chart, The moving average is represented with the price in the form of a dynamic line that changes position over time. Making trades with moving averages necessitates a deep understanding of the indicator, particularly its calculation method.
.png)

Although the moving average calculates the average price of a recent number of candles, other factors are taken into consideration when calculating the value. The most effective moving averages (according to the method of calculation) are:
- Simple Moving Average
- Exponential Moving Average
- Weighted Moving Average
Now let's talk about these three types of moving average.
Simple Moving Average(SMA): The simple moving average (SMA) is a method for calculating the average price of a cryptocurrency for a set of data. The basic moving average only displays the average price, whereas the simple moving average displays all of the data as a dynamic line. The simple moving average takes all prices into consideration equally, enables investors to determine the true average price. Furthermore, the SMA indicator shifts its position whenever a new candle appears. The formula of the simple moving average is given below:
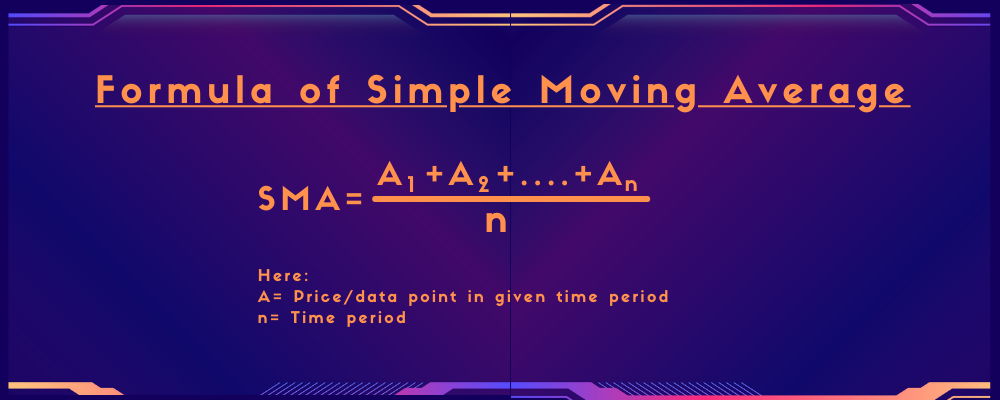 Image designed in Canva | by @shemul21
 Exponential Moving Average(EMA): EMAs and SMAs are similar in that they both track the direction of a trend. EMA, on the other hand, uses more complicated calculations to give more weight to the most recent price changes. As a result, the EMA gives a more accurate price prediction in price reversals and sudden price fluctuations. EMAs are ideal for traders who trade in the short term. Furthermore, the best method is to combine the SMA and EMA to find both short- and long-term price directions at the same time. The formula of Exponential Moving Average is given below:
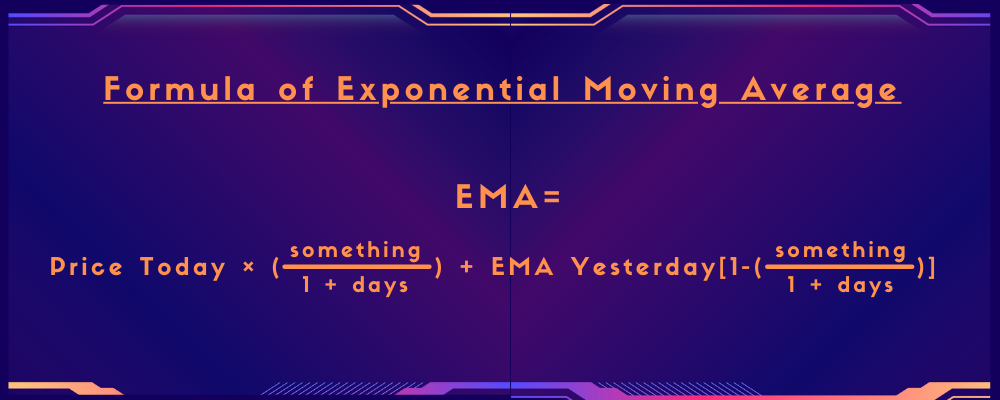 Image designed in Canva | by @shemul21
 Weighted Moving Average(WMA): The Weighted Moving Average (WMA) is a statistical measure that gives greater weight to the most recent prices (data points) and less weight to the previous data. The WMA multiplies the price of each bar by a weighting factor in order to concentrate on the most recent data. Eventually, the sum of the weights will equal one, or one hundred percent. The WMA algorithm is supposed to be more descriptive when it comes to the frequency of concurrency when compared to the SMA algorithm. The fact is that all the numbers on the SMA are given equal importance. The formula of the Weighted Moving Average is given below:
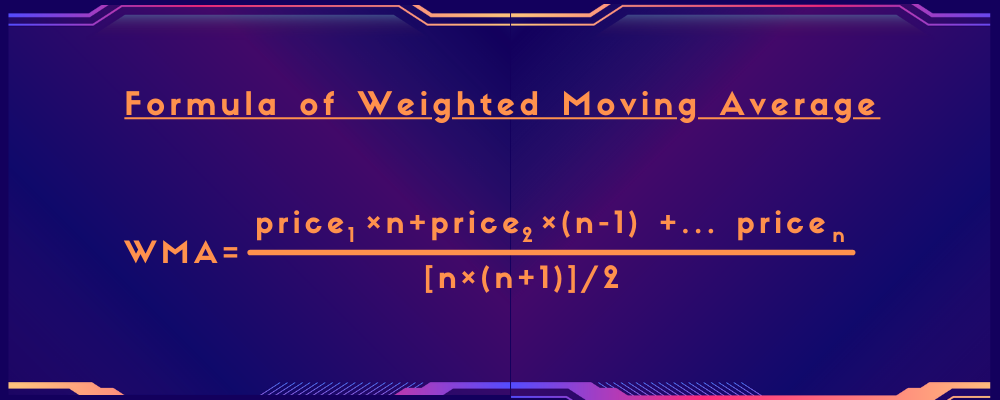 Image designed in Canva | by @shemul21

Understanding the differences between EMA, SMA, and WMA is critical. As a result, investors will have a better understanding of which indicator to use and why.
The differences between EMA, SMA, and WMA are highlighted in the table below:
| SMA | EMA | WMA |
|---|---|---|
| The average price over a period and the number of periods are used in the SMA. | The EMA calculates using today's value and smoothing. | The most recent price is used first by WMA. |
| SMA depicts the average value over a period of time. | Recent data is given priority by the EMA | WMA emphasizes the importance of reducing recent data. |
| Suitable for detecting long-term trends | Short-term trading and price reversals are ideal. | When recent data is more valuable, this is a good option. |
| SMA with a higher value is more reliable. | The EMA with a lower value is more reliable. | WMAs with higher and lower values are both reliable. |

Not only moving average is the most widely utilized indicator in the world, but it is also available for free on the majority of trading platforms. Furthermore, by changing the timeframe and numerical method, you can combine multiple MAs into a single one. Let's plot the 50-day exponential moving average, the 50-day simple moving average, and the 50-day Weighted moving average together on a Bitcoin chart and compare them:
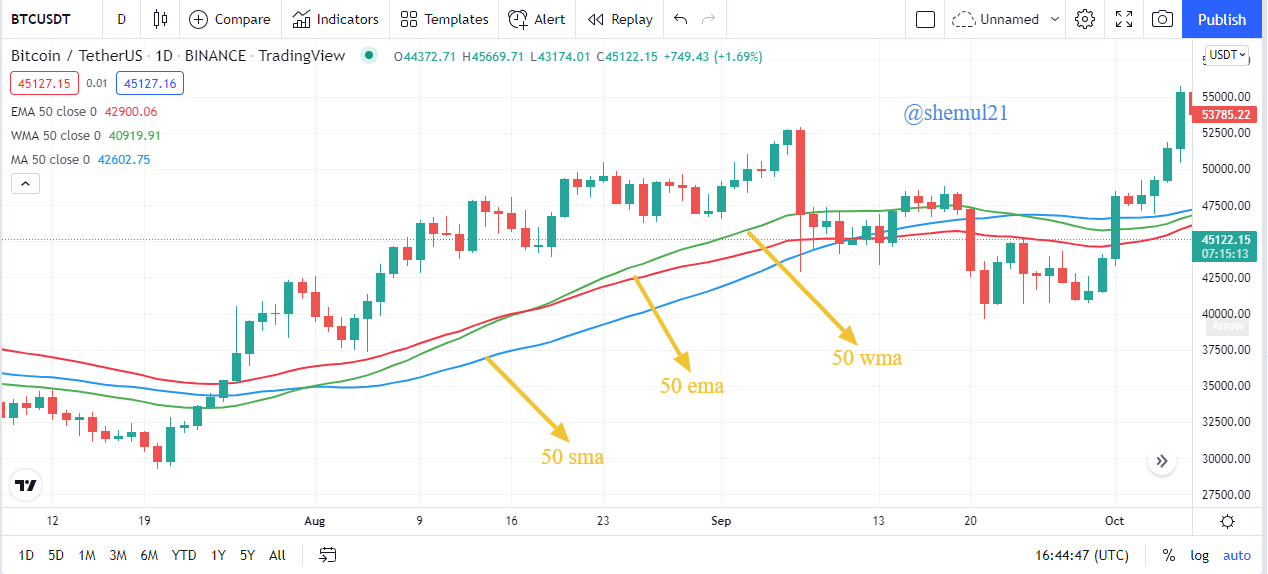 Image Source Tradingview
 The above image demonstrates that the 50 WMA is more closely associated with the price than the EMA and SMA. The 50-day exponential moving average, on the other hand, serves as the most effective dynamic support level in the bullish trend.
Let's move on to chart-reading techniques that make use of the MA. In this case, we'll use two moving averages: the simple moving average (100 sma) and the exponential moving average (20 ema).
The moving average (MA) serves as dynamic support and resistance level in a trending market. We can therefore open an immediate position if the price moves closer to the moving average and demonstrates a rejection of the trend in the process.
Consider the following illustration:
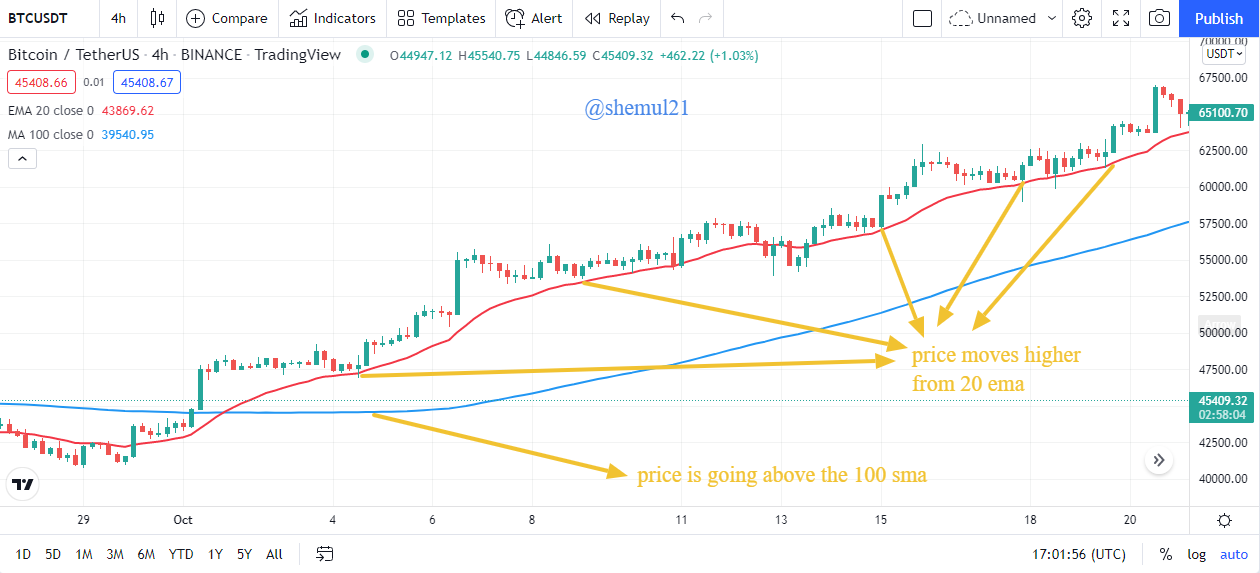 Image Source Tradingview
 The above screenshot shows that there is a clear uptrend in which the price is trading above the 100 SMA, indicating that long-term buyers are actively participating in the market. The price, on the other hand, is below the dynamic 20 EMA, which means that every bearish rejection from the 20 EMA pushes the price higher in the meantime. The 20 EMA represents the activity of short-term traders in this case, and in a bullish trend, every rejection from the 20 EMA indicates a potential buying point in the future.
In a volatile market, however, it is difficult to follow the trend because the price does not follow a specific direction at all times. In order to demonstrate their effectiveness in a volatile market, consider the following two moving averages:
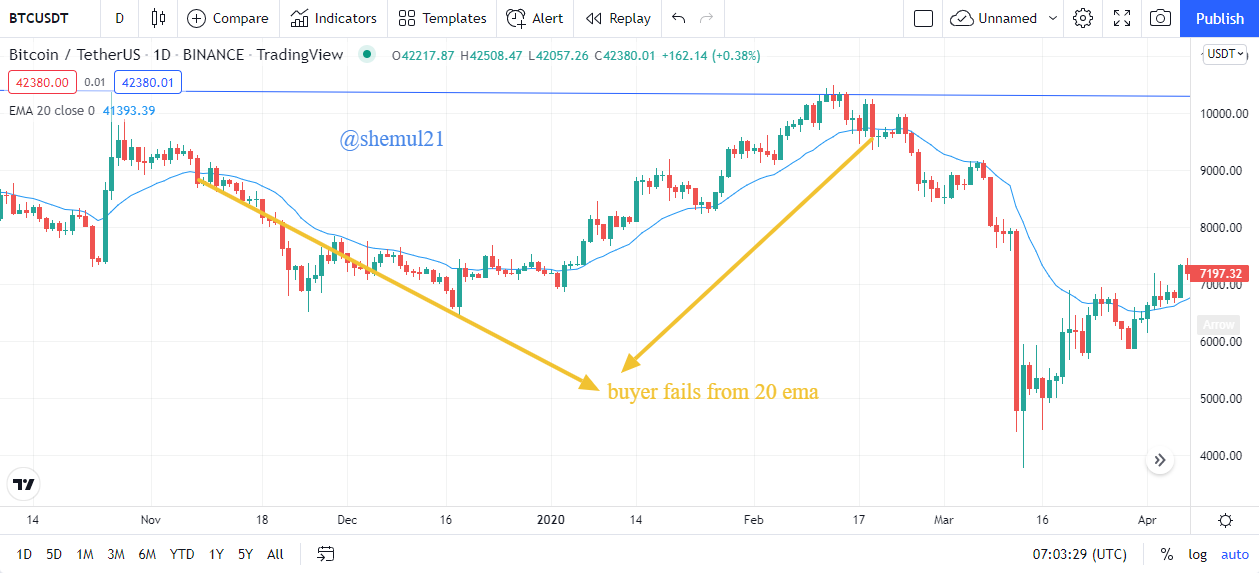
Image Source Tradingview
We can see how the price slides down to the dynamic 20 EMA but tries to convince higher, despite the fact that the price has already shown a bullish candle close to the dynamic 20 EMA in this instance. Selling pressure below the 20-day exponential moving average but above the 100-day simple moving average indicates that the price direction is indecisive, and traders require more confirmation before entering a trade.
It is also possible to identify the price reversal point using the moving average and support/resistance levels on a chart using this technique. Due to a "gravitational force" known as reversion, as the difference between the price and the dynamic 20 EMA expands, the price and the dynamic 20 EMA will strive to close the gap. It is extremely that the price will fall back to its mean once it has reached an important support or resistance level.
Consider the following illustration:
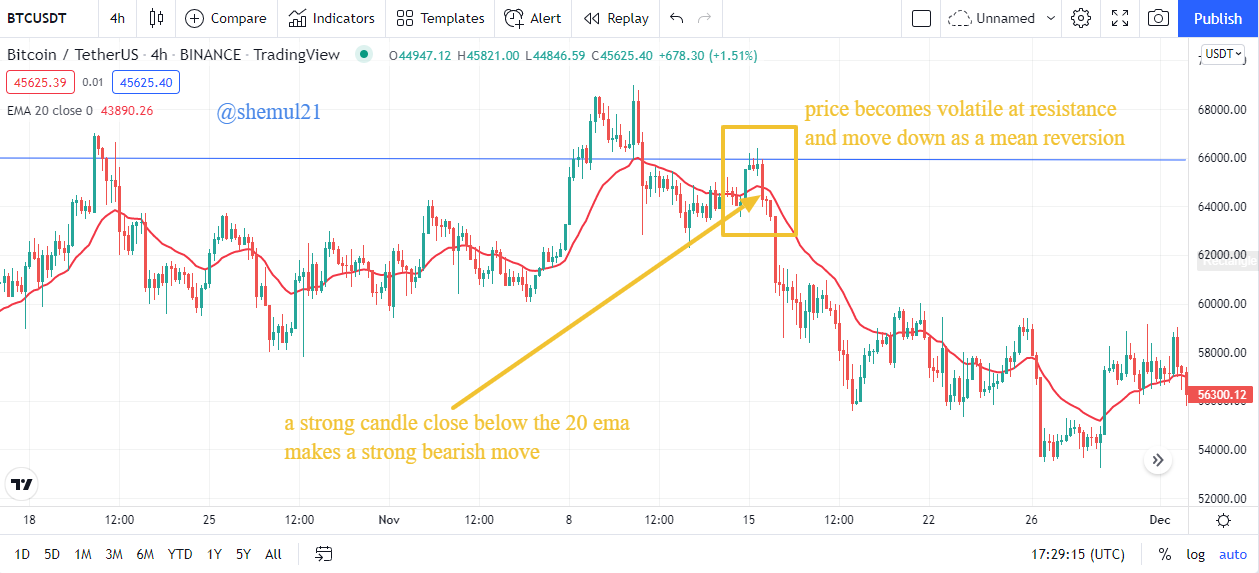 Image Source Tradingview
 The above screenshot shows a horizontal resistance level where the price increases by widening the gap between the price and the dynamic 20-day exponential moving average (EMA). Later on, the price begins to fluctuate and eventually moves downward as a result of mean reversion. Furthermore, a bearish candle that closes below the 20 EMA pushes the price lower, resulting in significant bearish pressure.
The preceding section explains how to enter a trade using the moving average in both volatile and nonvolatile market conditions with a reversal entry in both volatile and nonvolatile markets. Make sure that you use a high risk-to-reward ratio in order to minimize the unavoidable risk.

The MA crossover system differs from a standard moving average system in that it combines two moving averages instead of the usual single moving average. A good example of this would be to combine a 50-day exponential moving average with a 100-day exponential moving average. The shorter moving average (in this case, 50 days) is also referred to as the faster-moving average because it moves more quickly. The slower moving average is the longer moving average (100-day moving average), which is referred to as the longer moving average. Because the shorter moving average requires a smaller number of data points to calculate the average, it tends to be more closely tied to the current market price and, as a result, reacts to changes in price more quickly. A longer moving average requires more data points to calculate the average, and as a result, it tends to be further away from the current market price than a shorter moving average. As a result, the reactions are more subtle.
Here is a chart of the Bitcoin that shows how the two moving averages line up when they are loaded onto a daily candlestick chart.
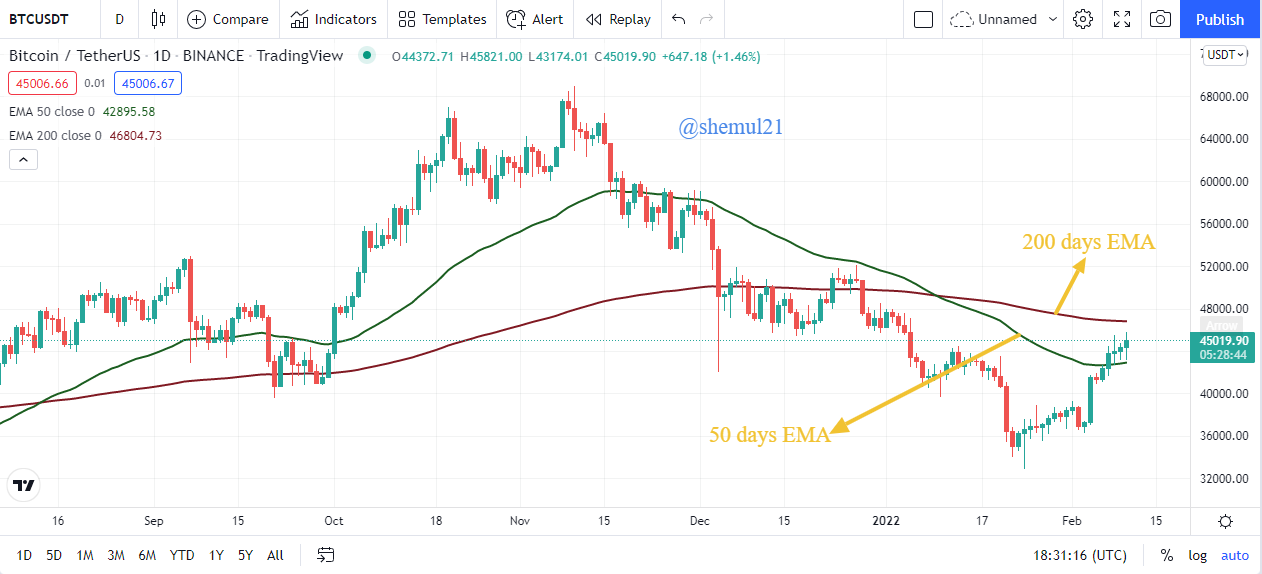 Image Source Tradingview
 We can see, the green 50 day EMA line is pretty close to the current market price (because it reacts more quickly) than the red 200 days EMA line (because it reacts slower). Traders have been using the crossover system in order to smooth out the entry and exit points. The trader receives significantly fewer signals as a result of this process, but the probability of the trade being profitable is quite high.
The following are the rules for entering and exiting the crossover system:
When the short-term moving averages exceed the long-term moving averages, buy (new long position) the crypto. Continue to hold your position as long as this condition is met.
When the short-term moving average becomes less than the longer-term moving average, exit the long position.
To demonstrate the MA crossover system, we will use a bitcoin price chart with 50 ema and 200 ema as the moving averages.
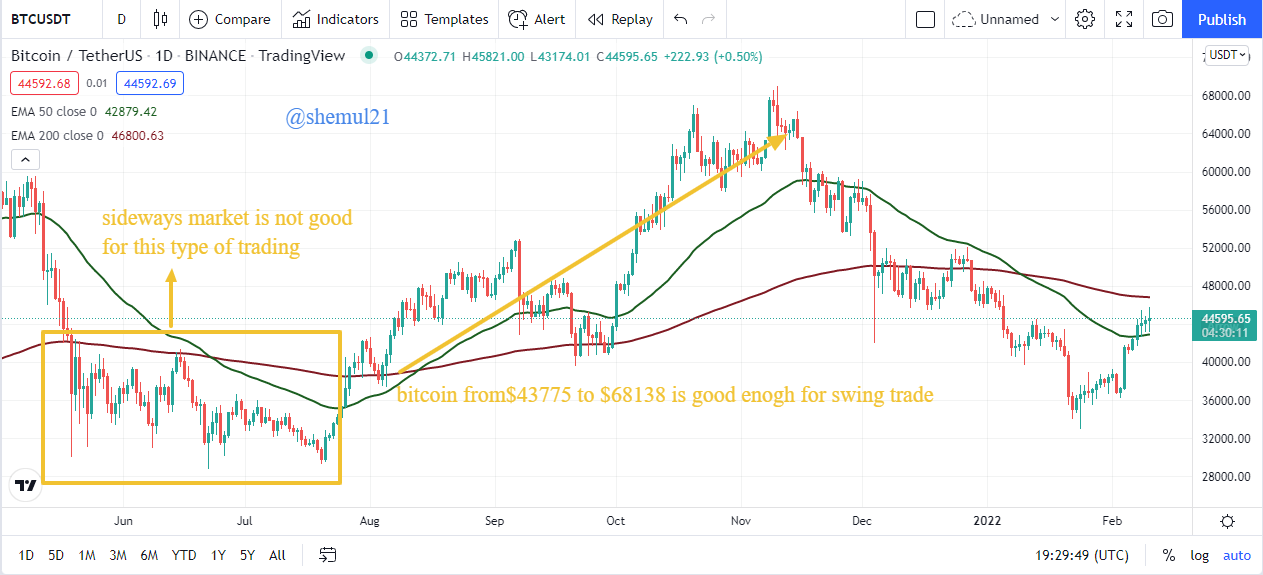 Image Source Tradingview
 This crossover technic doesn't allow for a sidewise market. By using this method we will get a lot of buys and sell signals which are not profitable. In order to create an MA crossover system, a trader can use any combination of indicators. The following are some of the most popular swing trading combinations:
- 9 day EMA with 21 days EMA (short term trades - up to few trading sessions)
- 25 day EMA with 50 days EMA (midterm trade - up to few weeks)
- 50 day EMA with 100 Day EMA (long term trades - up to few months)
- 100 day EMA with 200 days EMA ( long-term trades - over a year or more)
Always keep in mind that the longer the time frame, the fewer the number of trading signals. Of course, the MA crossover system can also be used for intraday trading, as previously stated. In order to identify intraday opportunities, one could, for example, use the 15 x 30 minutes crossover strategy. A 5 x 10-minute crossover would be appropriate for a more aggressive trader.
Here is an illustration of a buy and sell signal for an intraday trader in a 5min chart of ETH/USDT.
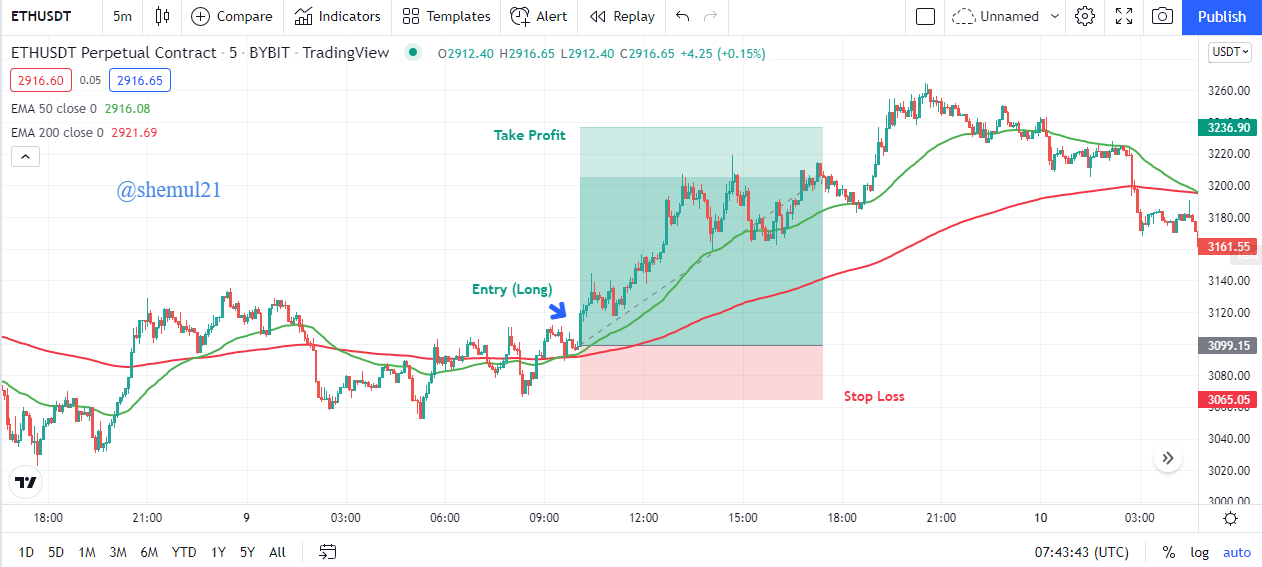 Image Source Tradingview
 If you've ever been in the markets, you've probably heard the expression "The trend is your friend." Moving averages, on the other hand, assist you in identifying this companion.
Remember that moving averages are a trend-following system, which means that as long as there is a trend, the moving averages perform admirably. It makes no difference which time frame you use or which cross-over combination you use; everything is the same.

The preceding section describes how well the moving average assists traders in determining the direction of the market. Because of its dependability and effectiveness, investors from all over the world are able to make use of it. Although this indicator has many advantages, it also has some significant drawbacks that can end up causing it to give incorrect signals:
Because the moving average does not require into consideration data that occurs outside of the average period,
The use of an unadjusted moving average can result in forecasts that are inaccurate.
A moving average is considered a lagging indicator in statistical analysis. Therefore, signals from the MA are frequently received too late to alert a trader to a shift in the trend direction.
With the implementation of new data, the average value is continuously revised over time, and the predicted value is also continuously revised.
The fundamental principle of the moving average method is that it eliminates various time series of changes and other changes through the use of the moving average, thereby uncovering the long-term trend of time series.
When determining the period of the moving average, extreme caution should be exercised. There are no strict guidelines for selecting a time period, and each individual must depend on his or her own judgment.

Market efficiency is not perfect in the cryptocurrency industry. High-frequency trading, on the other hand, offers numerous opportunities for profit. Before investing in a crypto asset, it is critical to determine the market trend, as the trending market provides the best returns. The trend of the market can be accurately predicted using the moving average. Technological analysis continues to improve as the blockchain industry expands and new use cases and applications are developed. Indicators like moving averages, oscillators, and volumes, which are extremely profitable, have no substitutes. However, a successful trader uses a variety of trading tools to predict the direction of the market.

Explain Your Understanding of Moving Average.
What Are The Different Types of Moving Average? Differentiate Between Them.
Identify Entry and Exit Points Using Moving Average. (Demonstrate with Screenshots)
What do you understand by Crossover? Explain in Your Own Words.
Explain The Limitations of Moving Average.
Conclusion.

Your Homework Posts must be submitted to the Steemit Crypto Academy community.
You must include all of the details in your own words, without using someone else's words. Your content should be unique, even if the concept is similar.
Your homework posts must contain at least 600 words.
Plagiarism is strictly prohibited throughout the Steemit platform, and you will not be granted any benefits if you do so.
All screenshots and images should be fully referenced, and the images that are referenced should not be copylefted. Also, every screenshot should have your user name as a watermark.
Among the first five tags, include #shemul21-s6week2 #cryptoacademy and your country tag. You can also use relevant hashtags.
Only people who actively and successfully participate in #club5050 or above ( #club775, #club100 ) will be eligible to receive rewards for the Steemit Crypto Academy homework tasks, according to new rules changes.
Your homework Title should be [ Crypto Trading with Moving Average ]-Steemit Crypto Academy | S6W2 | Homework Post for @shemul21
The homework task will run until 19th February'2022, Time- 11:59 PM UTC.
You can participate in this Task if you have a reputation of 60 or higher and a minimum SP of 250. (You should not have experienced any power-downs in the previous 30 days, and your effective SP should not be delegated-in SP.) You will also be ineligible to participate in this Task if you have used any vote-buying services to improve your reputation.
If you haven't received your homework score within 48 hours, you can leave a link in the comments section. Otherwise, don't leave a link to your post here.
If you have any questions about my lesson, feel free to ask me in the comments section.

CC:
Very interesting topic. I hope to participate in this work.
Excelente conferencia esperó llegar pronto a nivel 60 para realizar esta tarea.
Sir i am currently in powerdown phase due to some unavoidable circumstances, i just wanted to post crypto academy posts. I wanted to know if i am eligible for posting crypto posts if i cancel the powerdown today.
@shemul21
I will be waiting for your reply.
You should not have experienced any power-downs in the previous 30 days. Thanks.
It's really heartbreaking that I can't attend this lecture.
You are very close to the required reputation. Try to post in other communities to achieve the requirement. You may post related to finance, business, or crypto topic with the proper hashtag( #fbcrypto #finance #business #crypto) . That could get you a curation from our curation team. Thanks.
Actually, I am posting diaries nowadays. But I will also try to post related to the topics as you have mentioned.
Thank You for your suggestion.
Participa en los protocolos de contenido de la comunidad, si te eligen podras subir la reputacion
What kind of protocols? Can You please explain me.
Cada comunidad tiene protocolo de contenidos, en donde en un dia se habla sobre un tema especifico, los mejores post son elegidos diariamente para que programa booming los apoye con un pequeño voto
Thanks a lot for your suggestion
Very insightful lecture
I will submit soonest
Thanks
Very educative lesson. Thank you prof @shemul21
You are welcome 🙂
Oh, ha sido una conferencia increíble. Intentaré enviar mi Entrada lo antes posible. GRACIAS.
You are welcome.
Hello dear professor @shemul21, it’s past’s 48hrs now and my homework haven’t been scored yet.
Here is a link to my homework post
https://steemit.com/hive-108451/@zology69/crypto-trading-with-moving-average-steemit-crypto-academy-or-s6w2-or-homework-post-for-professor-shemul21
Professor, on question number 1, do we have to explain all Moving Average indicators (SMA, EMA, WMA)
No it's not mandatory, you may explain those in question 2.
Hello prof @shemul21 and @steemcurator02 I want to remind you that my homework for this lecture is 5days old already. It has been marked but it hasn’t been upvoted