Candlestick Patterns | Steemit Crypto Academy Season 4 | Homework Post for professor @reminiscence01 Task 10 |
Hello everyone, I will first of all like to thank professor @reminiscence01 for giving as this wonderful lecture on a great topic is Japanese candlestick chart and I will here today to complete my assignment and my answers are shown below.
1a) Explain the Japanese candlestick chart? (Original screenshot required).
b) In your own words, explain why the Japanese Candlestick chart is the most used in the financial market.
c) Describe a bullish and a bearish candle. Also, explain its anatomy. (Original screenshot required)
Explain the Japanese candlestick chart? (Original screenshot required).
The Japanese candlestick chart is used by trader to determine possible price movement based on past patterns, and it has being in the system for quite a number of years, and it helps traders to know much more about it.
The Japanese candlestick chart was developed by a munehisa Homma, a Japanese rice trader, during routine trading, and he later discovered that the rice market been controlled by the traders and still acknowledging the effect of demand and supply on the price of rice.
He established the Japanese candlestick to solve the problem of price movement and so help people to know when to sell and when to buy crypto that time and this invention help the trader and that was why the invention of the Japanese candlestick chart was successful.
The Japanese candlestick chart plays an important in cryptocurrency trading, it is able to help traders or investors to differentiate between a buying positions and that of selling positions and when to invest your fund into cryptocurrency and also help people to develop interest into cryptocurrency.
The Japanese candlestick chart is made up of four major component which is the opening price, closing price, the highest price and final price and with the help of those components one can determine when to hold your cryptocurrency or make a sell it.
In your own words, explain why the Japanese Candlestick chart is the most used in the financial market.
The Japanese candlestick chart plays an important role in the financial market, because it’s very easy to read and understand a lot more about crypto, and it helps we the users and investors to know when to sell and when to buy and when one can be able to know well, on when the price of the market is going to fall, or it’s going to rise and he or she will be able to keep his assets in a safer place, with this it will help one make a great choice about it.
The Japanese Candlestick Chart helps a user to know how a particular cryptocurrency future is going to look in the process of that a user can come out with a good decision and be able to buy or sell cryptocurrency his or cryptocurrency assets the Japanese candlestick chart play an important role in the financial market.
Describe a bullish and a bearish candle. Also, explain its anatomy. (Original screenshot required)
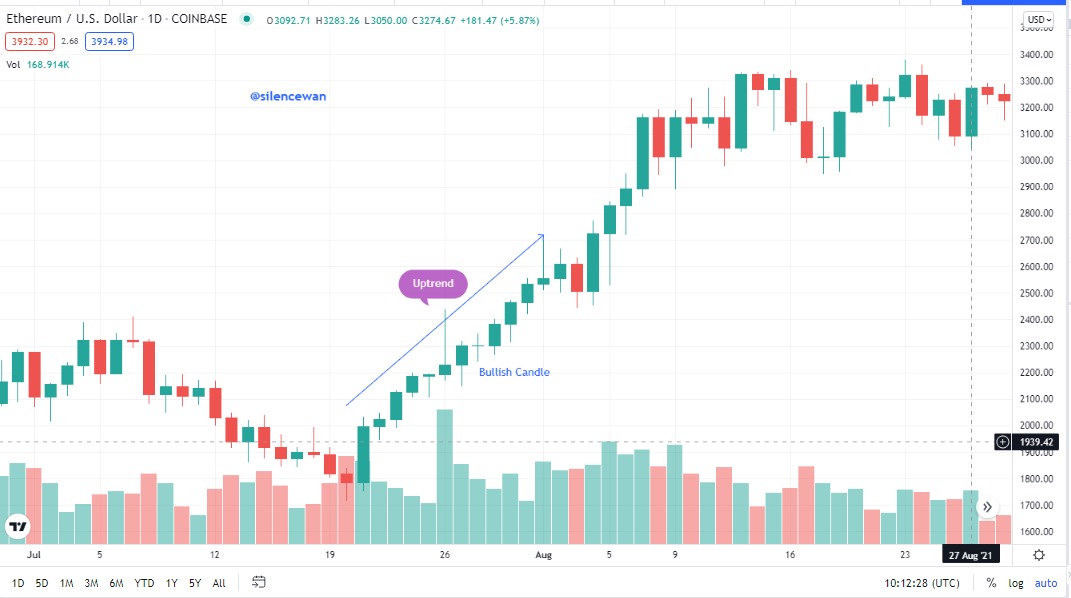
BULLISH JAPANESE CANDLESTICK
The bullish Japanese candlestick tells the traders that the market is about to enter an uptrend after the decrease in the market price and the a reversal pattern indicates that the market price in the uptrend may be about to come back into an uptrend and the bullish Japanese colors is always green and purple which means that the closing price is great than the opening prices and when the price market is green it means that it’s good to buy and if the color is green or white is a bullish and it means the market price is growing at specific period of time.
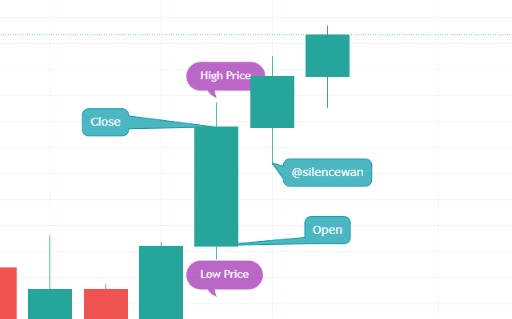
Categories of the bullish Japanese candlestick
Open price
it’s the beginning of price movement and it marked the beginning of the price movement over a period of time
Close price
indicate the last part of price movement and it mark at the end of the price movement over a period of time
Low price
indicate the lowest price movement and it marks the lowest price movement over a period of time
High price
indicate he highest price movement and it marks the highest price movement over a period of time.
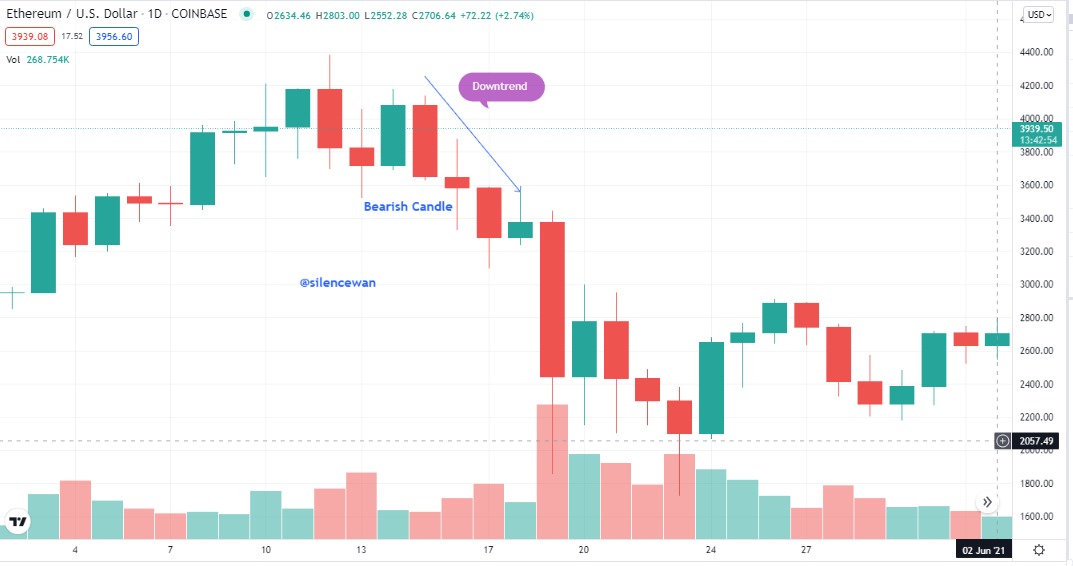
BEARISH JAPANESE CANDLESTICK CHART
Bearish Japanese Candlestick tells a trader that the market is about to enter downtrend after an increase in the price of market in the bearish Japanese candlestick in most cases the trader used black or red and if it’s black or red it’s bearish and reflects a downward price direction with a specific period of time
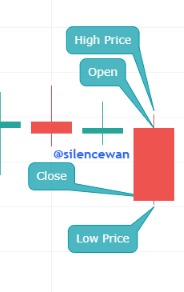
There are four main component of the bearish Japanese Candlestick chart
Open price
indicate the starting point of the price movement and it marks the beginning of the price movement over a period of time
Close price
it indicate the lasted point in price movement and it marks the end of the price movement over a period of time
Low price
it indicate the lowest price movement and it marks the lowest price movement over a period of time
High price
it indicate the highest point in the price movement and it marks the lowest price movement over a period of time.
Conclusion
The Japanese Candlestick chart has really help those trader especially those who are into cryptocurrency in has really impacted their life and it has help to know more about crypto
I will like to thanks professor@reminiscence01 for giving us this wonderful lecture.
All the graphs were taken from tradingview