Steemit Crypto Academy | Course 4 By @stream4u | Support <----> Resistance | What is Technical Indicator? | Overview Of TradingView | 200 Moving Average.

Hello All,
My self @stream4u, I am from India and one of your crypto professors, welcome you all to my class.
This is my fourth lecture on Technical study. In this course, we will learn "How Support Can Become Resistance & Resistance Become Support", what is a "Technical Indicator", how and what kind of help we can get from the technical indicators, some basic about "TradingView" and how it will help us in Trading and Investment, and one of a powerful Indicator "200 Moving Average".
Till now we have learned some basics about technical concepts, how to read candles, how to read candle charts, what are the chart patterns, how different time frames for candles can be set in the chats, basic concepts of Support and Resistance, continuation and reversal pattern, double top and double bottom.
Now we will learn about Technical Indicators.
It's a humble request to all interested, first understand the course then please read the homework task 2-3 times, make a homework task that includes all requested topics, the post has to be covered all topics and only on the mentioned points/topics. Make sure the information available in your post is not taken from other sources.
Let's begin our 4th class.
In previous sessions, we come to know about how we can find Support & Resistance then how we can set patience and wait for the assets price to come to the support level again.
We have also seen that how Resistance can find on the chart and take exit entry.
Now, we have also seen that sometimes when assets become strong as buyers take commend on assets than the seller, then it is possible that the assets price can break resistance. Here, if you wait for the support level then might be you will miss the big bull rally. In such a situation, the below concept can help us in the trading and investing which called How Support Can Become Resistance & Resistance Become Support.
Support Can Become Resistance & Resistance Become Support, while trading or Investing in this concept, you will need to be very sharp and drawing lines at Support and Resistance can help you to identify the price level where you can go for a buy.
- Resistance Not always a resistance, in a bullish market Resistance can act as a Support.
- Support Not always support, in bearish market Support can act as a Resistance.
How to Perform Trading?
When you see the assets price breaks the Resistance and keep going up for the next couple of days, Don't Be Hurry(as a part of breakout trader, you can enter but you will have to be entered at the same time when it breaks resistance).
When Assets price keeps going up, you may have already drawn a line at Resistance which assets have already broken and now the assets price is above resistance, if not then just draw a line where the Resistance was, then just wait and have patience.
After the next few days if you see assets price come down to the same line where the Resistance was, Here, Don't Wait For The Support, now the Resistance will act as Support and take assets to price up again. The previous Support will be now your 1st Stoploss, this is how we need to also move with the market.
To explain the above information on the Chart, below is the one wherein we can see everything like how Support can react as Resistance and Resistance can react as Support, then how we can also move one step with Market.
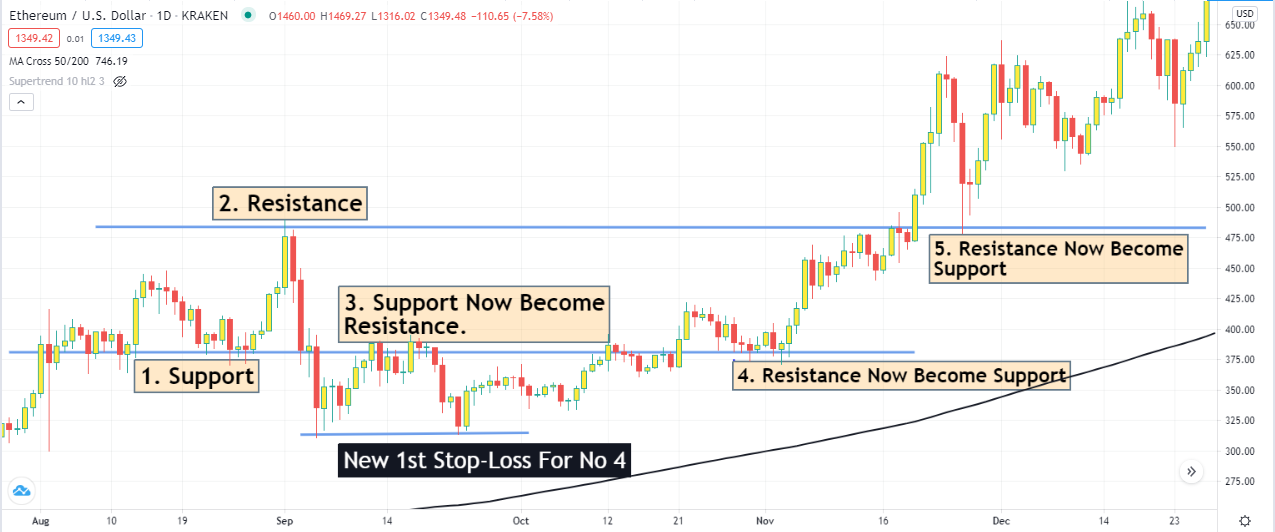
In the above image, I have explained with the numbers, how we can read the chart and move with the market. In this we can see how support can become resistance and resistance can become support then we can go for buy with the proper stop loss (In the above image, I have shown 1st stop-loss for example how our trade moves should be according to the market move, but for a safe trade 2nd or 3rd Stoploss is suggested).
This Pattern can be seen mostly in the candle chart 5 Minutes, 15 Minutes, 30 minutes, 1 Day.
| Homework Task(Topic 1): What Is The Meaning Of Support Can Become Resistance & Resistance Become Support, When and Where set Buy trade, Chart Example? |
Let's make it simple, from the name of Indicator we can say, something that is indicating to us, but the question is what it is indicating?
In Investment and Trading, only two things happen which are BUY and SELL, but it is very important for us to know where we should buy and sell.
Only looking at the assets and their prices will not help to understand where we can go for buy and sell.
Till last course we have seen how to we can check the history of the asset and accordingly make future plans. But I would like to tell you that, some experts have collected all these historical data and based on it they have already implemented some Indicators which we can now directly apply to our trading chart and those indicators will indicate to us in real-time for buy and sell.
So, Technical Indicators perform a very critical role in real-time while we are trading, Investing and they provide clear signals/indications/directions on our trading chart for entry and exit.
Based on a mathematical which is coded in Indicators they calculate and react as per the price changes in the market.
There are more than 100 or 200 technical indicators are available in trading but applying all in a chart can only create confusion. So only apply only those which you can understand better and have a good success rate from it.
Don't apply any Indicator just because others are using it. Different types of people and as per their expertise, they apply different indicators on their chart. We just need a couple of which we can understand properly.
There are very few exchanges that can provide these all indicators on their platform, but most of the exchanges only give a couple of indicators.
Hence, for a better, understanding of Indicators and how to apply them, we will learn Overview Of TradingView.
| Homework Task(Topic 2): What Is A Technical Indicator? (You can explore it as much as you can, like explain its role, show anyone technical indicator from your chart and name of that Indicator.?) |
Not sure if everyone is aware of TradingView or ready to adopt this new platform, but if you ask me to have more than 3 years of experience I can strongly suggest and recommend using the TradingView platform, based on its chart platform you can take a trade in your exchanges where you have an account.
What Is TradingView?
TradingView is a charting platform site that provides real time charts from all over the world market includes stocks, forex, crypto.
In crypto, as we know different exchanges show different prices, so In tradingview, you will get the price from the same crypto exchange that you referring.
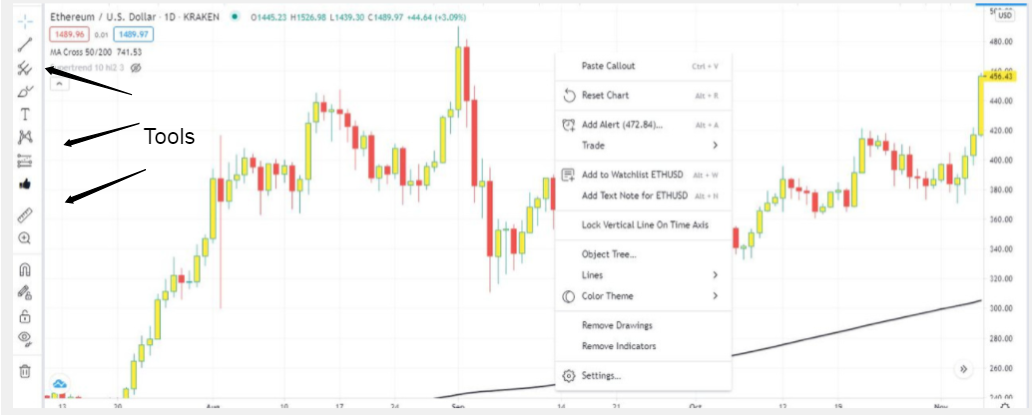
TradingView provides better visuals on charts, even with a free account you will get access to all tools and can add few indicators. Right-click on charts gives more options.
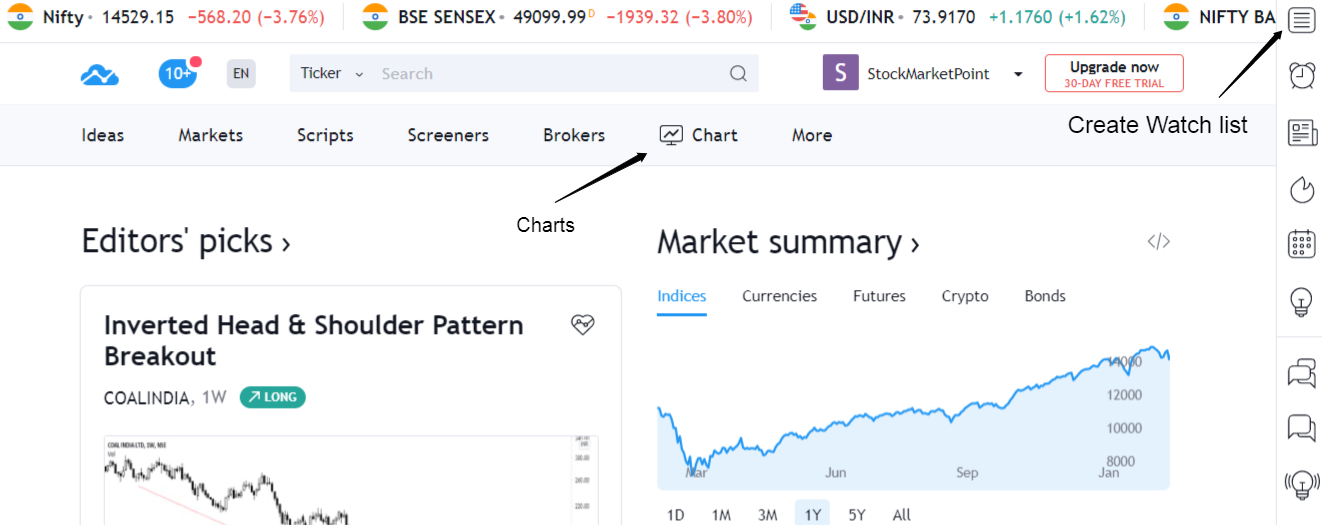
You can create your watchlist on TradingView and can monitor the assets.
Why I have explained about TradingView? Because now next we will be going to learn two strong Technical Indicator and I am not sure if one of is available on your chart platform or not. So, if it is not available on your chart platform, I will suggest to start using TradingView. (I will be not receiving any referral bonuses :) :))
| Homework Task(Topic 3): Provide your view and explore TradingView. |
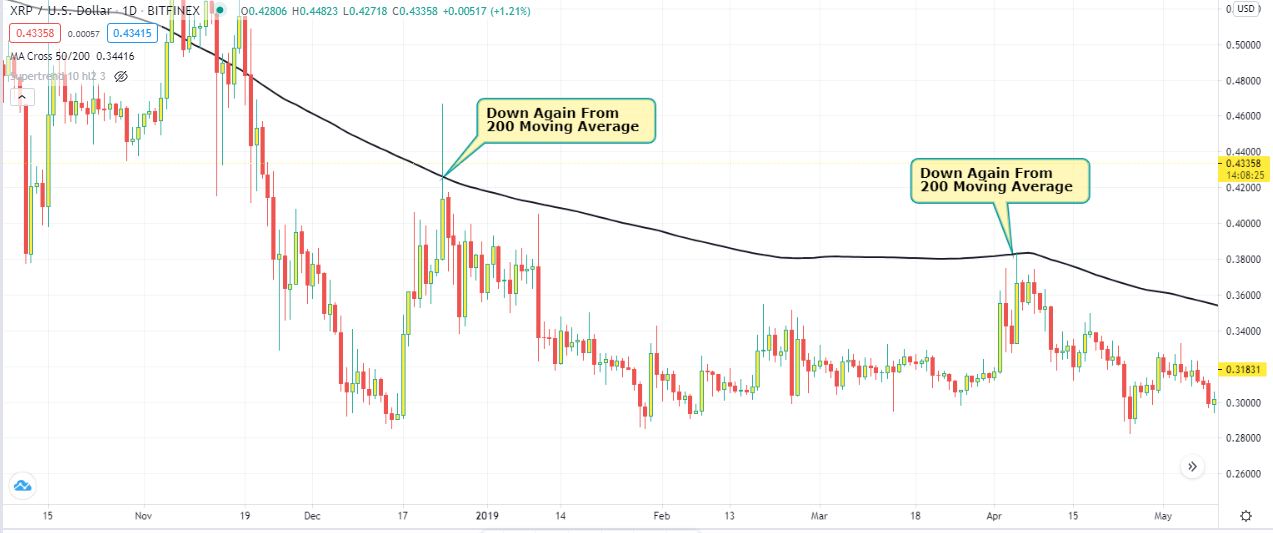
200 Moving Average is one of the very strong indicators and can be used to identify long term assets that can give you a good return after a certain period of time.
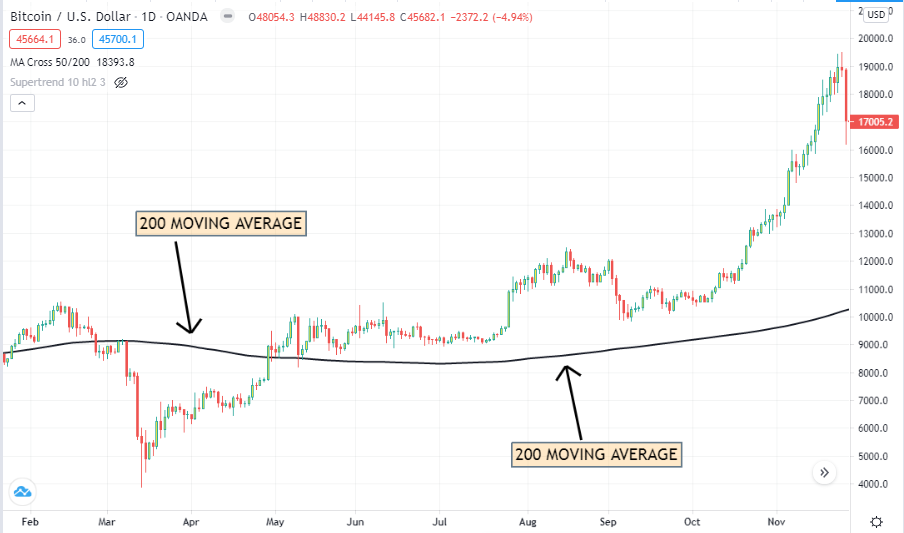
Technically, the 200 Moving Average is a simple line that shows the average closing price for the past 200 days.
Below are the points that can be seen in how the assets price reacted to the 200 Moving Average.
If the assets price is coming towards the 200 Moving Average from its down, then either assets price go down again or cross the 200 Moving Average line up the side.
If the assets price is coming towards the 200 Moving Average from its above, then either assets price go up again or cross the 200 Moving Average line downside.
To explain this, I will show you the most recent example, on 22nd Feb 2021, there was a big fall that happened within a day. Check below how Ethereum performed on that day, you can also check EOS.
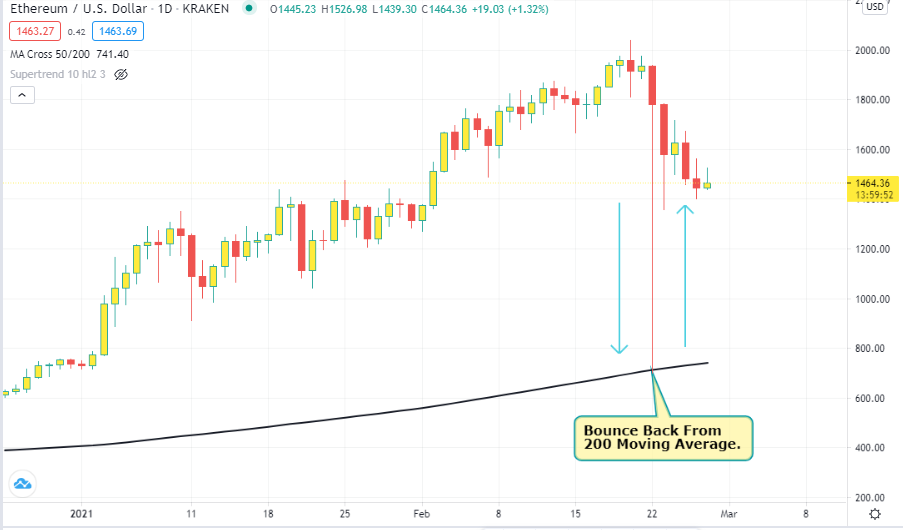
Here, we can see after a big fall how accurate the price react at 200 Moving Average and price bounce backed.
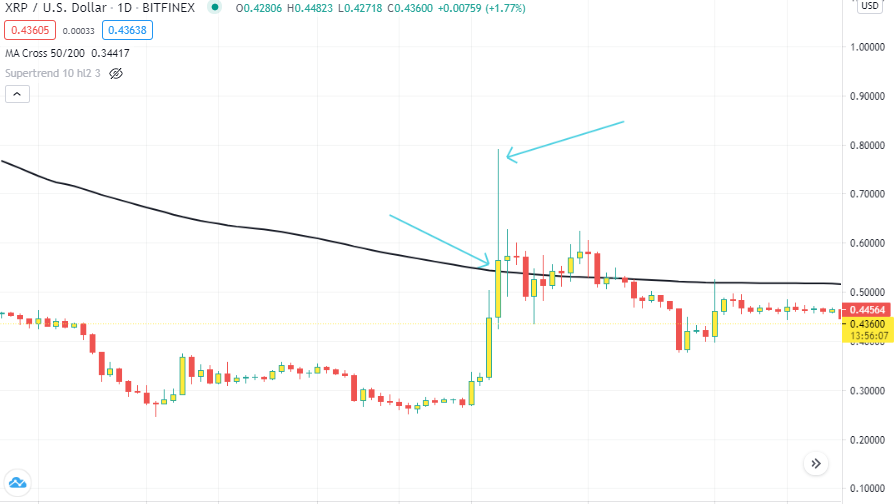
- If the assets price is coming towards the 200 Moving Average from its down and successfully crossed the 200 Moving Average line at the upside, the majority of chances for big upside for a day.
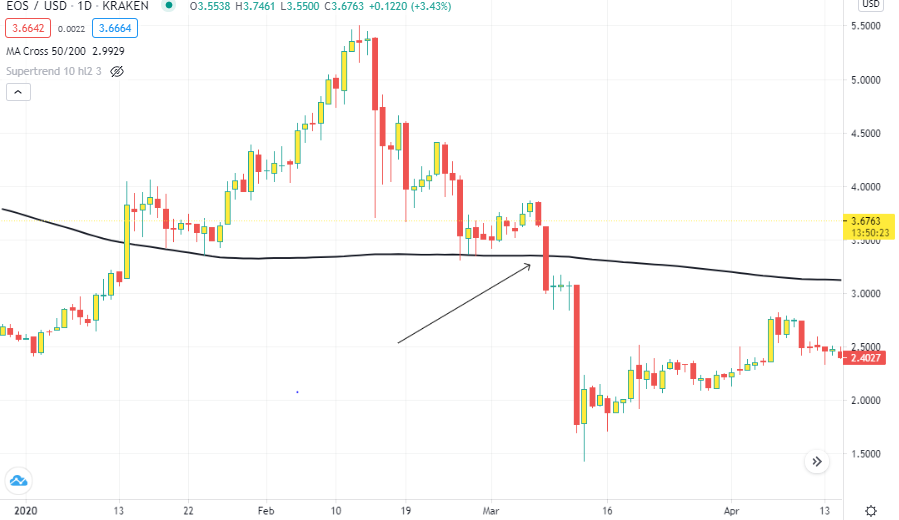
- If the assets price is coming towards the 200 Moving Average from its upside and successfully crossed the 200 Moving Average line at the downside, the majority of chances for big downside for a day.
Based on the above points we can see their many types of trade we can take with the help of 200 200 Moving Average.
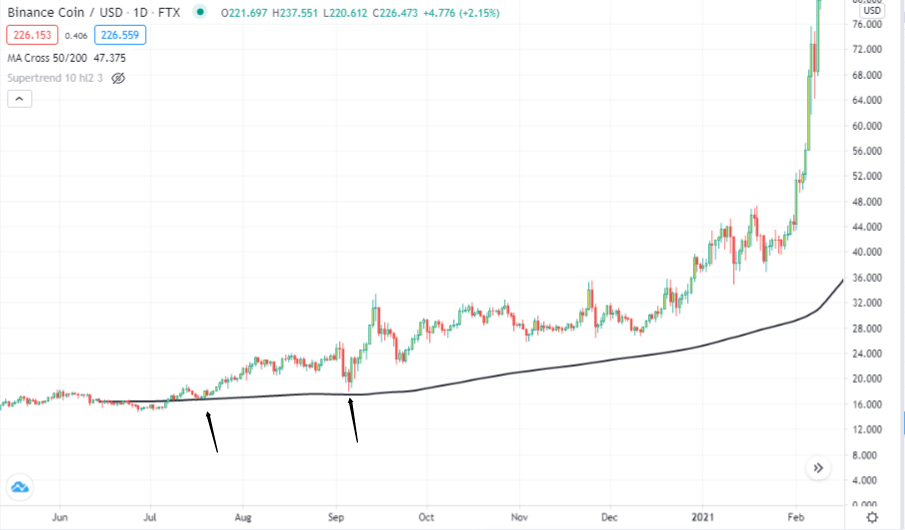
The Assets which are above the 200 Moving Average and following to the same trend, those assets can be stronger for a long hold, check below example
Similar to the 200 Moving Average, there is more Moving Average available with different Time Frame like 25 days, 50 days, 100 days. However, the 200 Moving Average used to find long-term holding assets and for safe capital.
| Homework Task(Topic 4): What is 200 Moving Average, how and when we can trade/invest with the help of 200 Moving Average? Show different price reactions towards 200 Moving Average |
We will stop here and Thank You for attending this course. If it possible for you then I would like to know your view on this course in the comment section.
Regarding the Technical concept, if we check on articles or any Book so you may find a very wast explanation but the meaning will be the same. Based on my experience I have tried to make it as simple as possible which you can understand very quickly, you just need to try hard on a chart if it is something new for you and just started because of this course. But once you got hands-on experience on the chart then you can find it easily in just one view.
If you have any concerns, doubts, questions on this topic, you can ask me in the comment section and I will try my best to address them.
If you like to give me any feedback then that also you can give it from the comment section and I will try to work on that for the next course.
Tomorrow we will publish the Summary Of Homework Task 3, kindly check so that if it requires then accordingly you can improve your next post.
The Next Course will be more interesting as I will be explaining one more powerful Indicator which I am using for the last 3 years and then how to manage the capital and our Portfolio.
The homework task is already given in the above Course post :) :) check the Course post again if you did not find it.
You no need to refer to any other sources, copy-paste as you know PLAGIARISM isn't supported. You just need to see graphs to find a related pattern and then explain it, simple.
If your Homework task 4 post does not get reviewed by me within 24 hours after you published it, please comment me below on this post.
NOTE: All images should be based on charts that you refer and images/candle charts should be taken on your own.
As we all are in Steemit Crypto Academy, so It will be great if you use screenshots for Cryptocurrency assets/coins.
RULES
IMPORTANT:- All homework posts should be posted in the community Steemit Crypto Academy .
For Homework Task 4, add tag #crypto200, #stream4u-week4 in the first 2 tags. Also, tag @stream4u somewhere in a post.
(still, peoples are tagging incorrectly due to which posts are getting missed from review.)PLAGIARISM Will Not Accepted, hence make sure content in the post not copied and pasted from certain sources.
Submit Homework Task Post from 1st March 2021 To 7 March 2021.
Post Require a minimum of 300 words. Tips On a minimum of 300 words!
All screenshots of the Candlestick Charts should be taken on your own. You will get an extra Grade if you explore homework task as much as possible with your own words, the screenshot is from your own chart, properly defined pattern, and images not from a Google.
The post which has all mentioned topics will be considered as Completed.
(For any concerns, doubts, questions on homework task, you can ask me in the comment section below.)
Thank You.
@stream4u
Crypto Professors : Steemit Crypto Academy
Here is my submission Pls check
https://steemit.com/hive-108451/@lavanyalakshman/steemit-crypto-academy-or-course-4-by-stream4u-or-support-resistance-or-what-is-technical-indicator-or-overview-of-tradingview
This Post Has Been Shared On Twitter
Thanks so much @stream4u!
I was wondering if I could translate your publications into Spanish, I'll give you all the credits and the idea is to have a greater reach of people, even a little bit =)
Thank you, you can also Resteem it.
Perfect, but can I translate them?
Yes, you can, but change the heading as this post is mainly created for Steemit Crypto Academy and make sure to give the proper source as you know the Steemit posting guidelines.
Hello @stream4u, I congratulate you on this wonderful topic in the fourth week, I would like to know the intent of the following question Does it mean by how to use it or what? thanks
I have corrected it with simple, maybe it will help now or you can let me know if still question looks confused.
Actually, in this course, I have taken very few and simple questions on this task. I felt that maybe my list of questions looks scary, so tried to go for a simple and thank you for your comment. Let me know how it is now?
It s clear now, thank you
Gracias profesor @stream4u, excelente clase, el curso me ha gustado mucho, espero cumplir a tiempo con la tarea y con el uso de tradingView. Saludos.
Gracias profesor @stream4u
Interesante clase ,he estado ocupando y aprendiendo de tradingvieu y es una obra de arte ver como se mueven las velas , graficos y todo tipo de indicadores,realmente es una muy buena herramienta de largo aliento.
Gracias ¡¡¡
I read your post and upvote your post with resteem.
sir can i write it long because ts not something that can be explained in just few paragraphs so i want to ask can i write long post is it okay
Hi,
You can explore homework task as much as possible, but make sure the information that you will mention is only related to the mentioned 4 topics.
Hello. I just signed up for an account on Tradingview and am exploring all of your options. And lete me say taht is wonderful. But I'm affraid I don't know how to place the 200 Moving Average indicator on my chart. well not like you in your class captures.
Could you tell me the procedure, please?
And, Do you know if Poloniex has this indicator?
Thanks a lot.
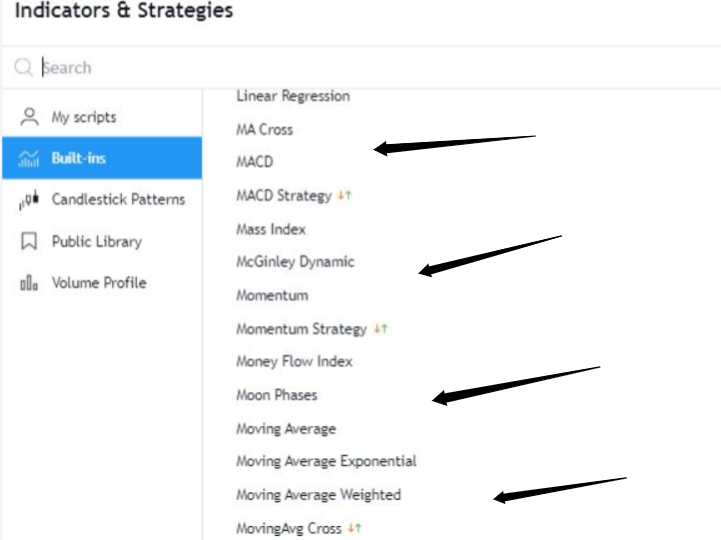
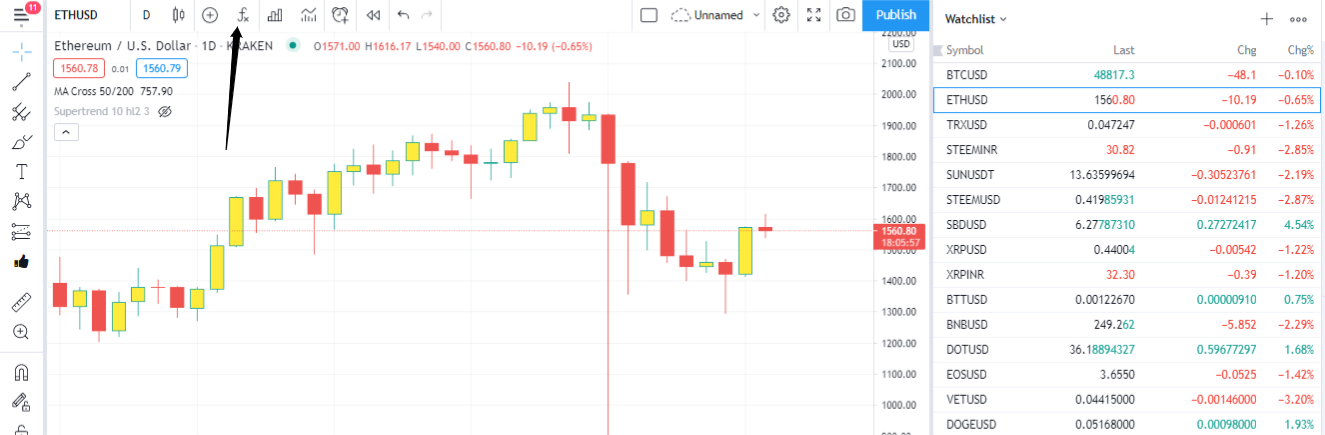
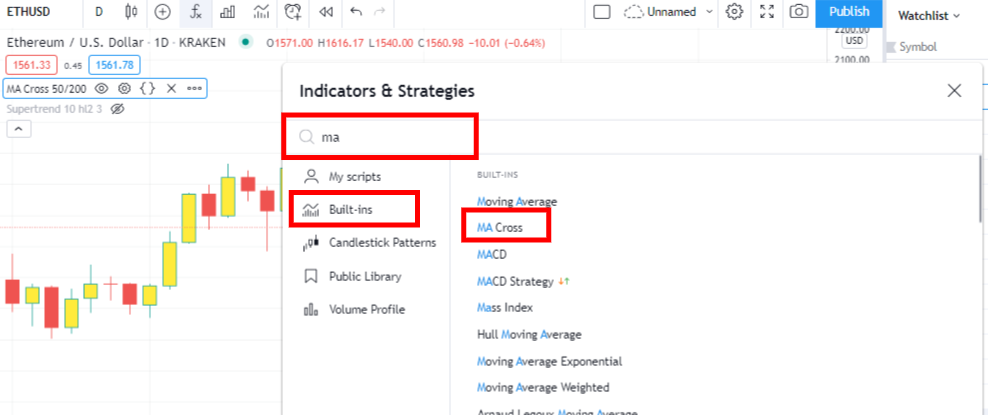
Click On Fx
Just type in Search box ma and select MA Cross, after select it will get applied on the chart.
Click on Setting and uncheck the first one which 50 days.
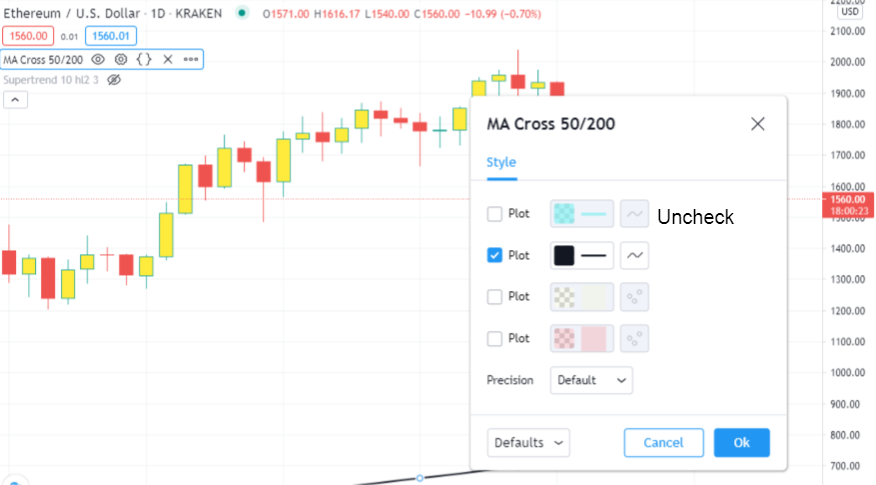
Now 200 Moving Average indicator applied n your chart.
Thank You so much
Dear professor @stream4u. Thanks for the great lecture and I will like to let you know I've worked on the task and the link to the task solution follows;
https://steemit.com/hive-108451/@fredquantum/steemit-crypto-academy-week-4-task-or-by-stream4u-or-support-resistance-or-what-is-technical-indicator-or-overview-of
Thank you so much for the teaching once again.