Steemit Crypto Academy | Course By @stream4u - Technical Indicator: Pivot Points.

Hello All,
Welcome to Steemit Crypto Academy Season 2, My self @stream4u, I am from India, and one of your crypto professors welcomes you all to my class.
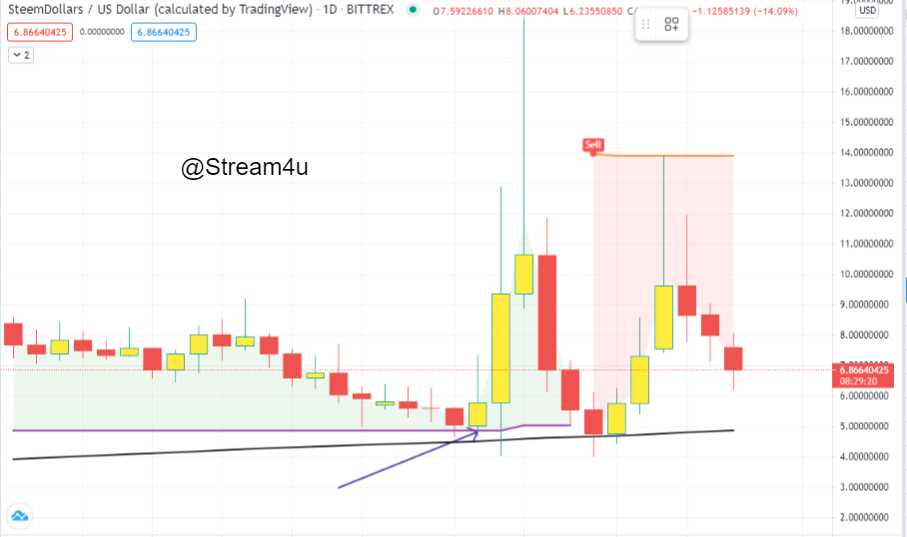
Hope you really enjoyed the last lecture that is Reverse Strategy. Just after our last course many of you have seen the Bullish Reverse Strategy and it worked very well, for example, we can see the SBD chart.
Now, In this week, we will learn one technical indicator that is Pivot Points. This indicator is one of the great that helps us to identify the market trend.
I am using this indicator since 2018. Initially, I use this indicator in Indian Stock Market. When I come into Commodity, Forex and Crypto then I started to use it in these markets when I do Intraday trading.
This indicator helps very well but we have to be very sharp and keep our eyes on a chart because the pivot points support and resistance levels at very strong and we should not miss the level to book profit or open a trade.
So let's begin our class.
NOTE: It will be good if you comment homework task link only if it is not reviewed within 24 hours after you published it.

Pivot Points is a technical indicator and its analysis uses the previous period of High, Low, and close levels to identify the future High Level which is Resistance, and future Low Level which is Support.
The traders use the previous period of High, Low, close levels and calculate the possible Pivot Points on their current Trading Day.
Previously this can be done by manual work and checking each level, but now in an advanced system, we can apply this indicator direly on a chart, and it will show all Pivot Points.
There are formulas on which the Pivot Points get calculated, but as I said now in an advanced system we no need to do that mathematical calculation and we can directly apply it on our chart, but still, as a part of learning, we will understand what the calculation is for Pivot Points.
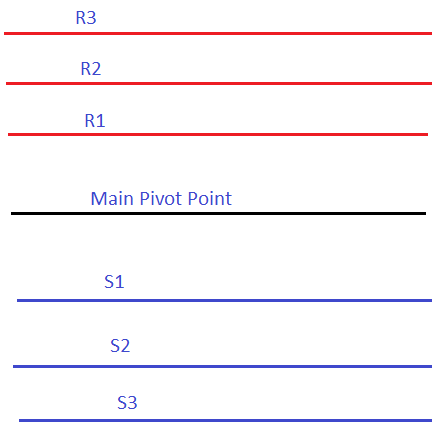
As I said the Pivot Points are calculated as per the high, low, and close levels of the last trading session, so in this, we found below levels of Pivot Points on our Chart.
| This is the middle and main pivot point on the chart. | |
| This is the first pivot level below the main pivot point. | |
| This is the second pivot level below the main pivot point and below S1. | |
| This is the third pivot level below the main pivot and below S2. | |
| TThis is the first pivot level above the main pivot level. | |
| This is the second pivot level above the main pivot point and above R1 | |
| This is the third pivot level above the main pivot point and above R2 |
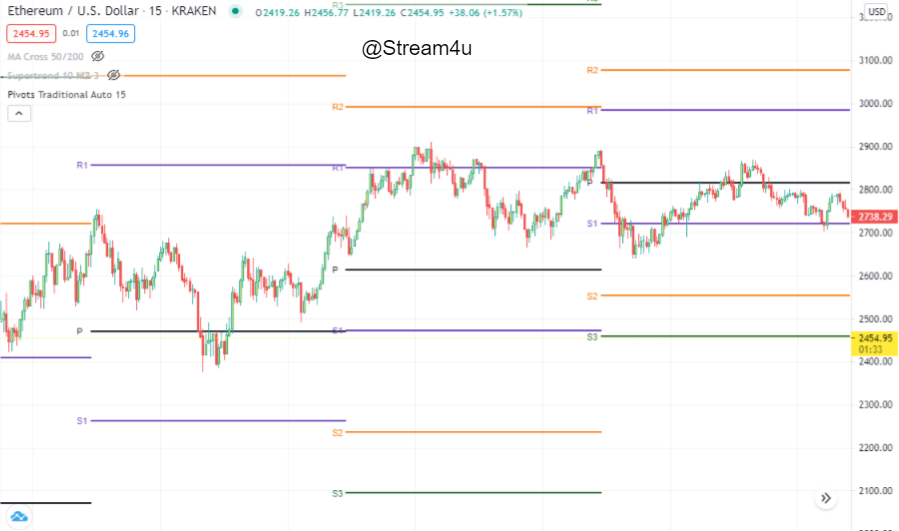
Once you add the Pivot Points on your chart, you will see lines on your chart that represents the level of S1, S2, S3, R1, R2, R3, and the Main Pivot Level (PP), just like below.
Now, just for the knowledge, we will see how these Pivot levels get calculated.
| Daily High + Daily Low + Close / 3. | |
| 2 x Pivot Point – Daily High. | |
| Pivot Point – Daily High – Daily Low. | |
| Daily Low – 2 x Daily High – Pivot Point. | |
| 2 x Pivot Point – Daily Low. | |
| Pivot Point + Daily High – Daily Low | |
| Daily High + 2 x Pivot Point – Daily Low |
The above is the basic calculation of Pivot Point Levels. Additionally, there are different kinds of pivot points available that are Fibonacci pivot points, Woodie’s pivot point, Demark Pivot Points, and Camarilla Pivot Points, I will leave these types of pivot points for your own study and research.
Main Pivot Level (PP):- The PP shows the Market direction. Price above PP will consider Bullish sign and Price Below PP will be considered as Bearish Sign.
Support 1 (S1):- The S1 represents the first level of support where it is possible that the price will move reverse and the market trend change to Bullish. This level is an oversold zone where buying may start. However, if this level break then more bearish is possible.
Support 2 (S2):- The S2 represents the second level of support where it is possible that the price will move reverse and the market trend change to Bullish. This level is an oversold zone where buying may start. However, if this level break then more bearish is possible.
Support 3 (S3):- The S3 represents the third level of support where it is possible that the price will move reverse and the market trend change to Bullish. This level is an oversold zone where buying may start. However, if this level break then more bearish is possible.
Resistance 1 (R1):- The R1 represents the first level of resistance where it is possible that the price will move reverse and the market trend change to bearish, this level is an overbought zone where selling may start. However, if this level breaks then more bullish possible.
Resistance 2 (R2):- The R2 represents the second level of resistance where it is possible that the price will move reverse and the market trend change to bearish, this level is an overbought zone where selling may start. However, if this level breaks then more bullish possible.
Resistance 3 (R3):- The R3 represents the third level of resistance where it is possible that the price will move reverse and the market trend change to bearish, this level is an overbought zone where selling may start. However, if this level breaks then more bullish possible.
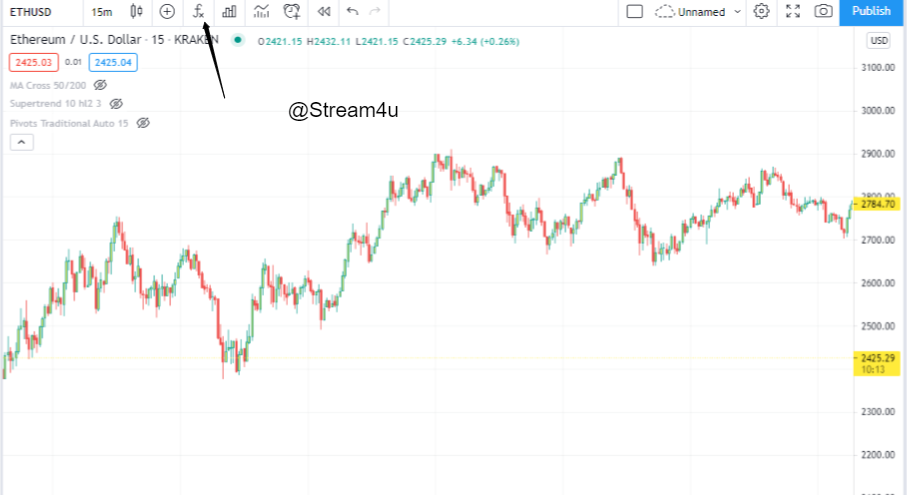
As I used TradingView so I will be using the same platform to demonstrate how to add Pivot Points on a chart and how to configure it.
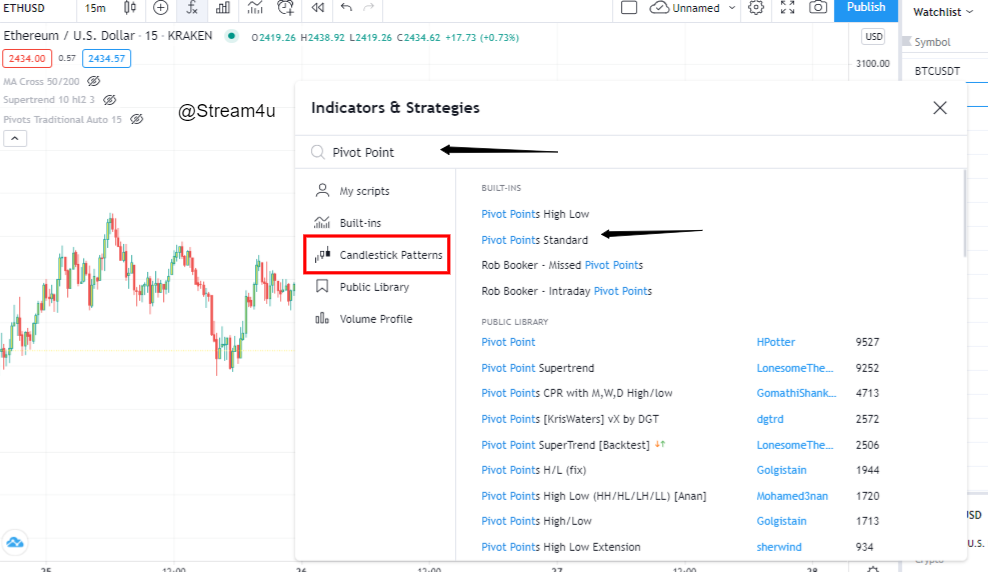
- This is our Candlestick Chart and then click to the fx that is Indicators and Strategies. (Shown by Arrow)
- Under Candlestick Pattern search for Pivot Points. There are many you will see, but select Pivot Points Standard. Once you select it, it will apply to your chart.
- After apply Pivot Points on a chart, it will look like this.
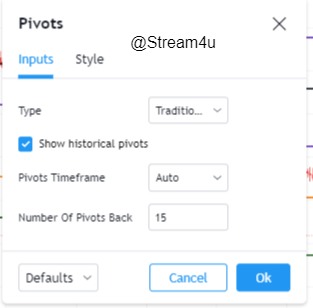
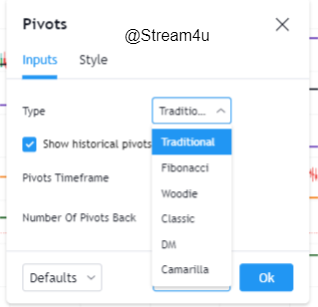
Under the Type, we can see there are a lot of options as mentioned above like Fibonacci pivot points, Woodie’s pivot point, Demark Pivot Points, and Camarilla Pivot Points, but we will keep as Traditional.
The timeFrame will be Auto.
The number of Pivot will be 15.
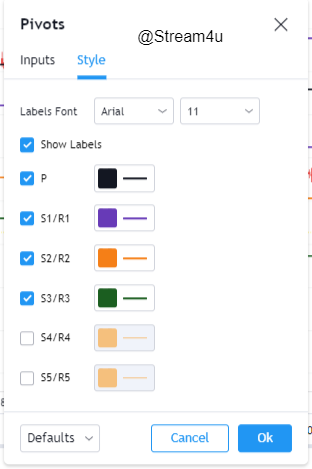
Under the style, you will see additional S4/R4, S5/R5 which we will uncheck as we will only use till S3/R3. You can give any color for your understanding, the most common color for R1, R2, R3 is RED because its represent resistance level, and Green or any color you can give for S1, S2, S3. In Trading View the color for S1 will also apply to the R1, similar to other levels too.
For the main Pivot Point, you can give the color Black.
To Trade with the Pivot Point, we need to understand that there will be two possiblity at each level of Pivot level.
When Price reaches the pivot lines it will act as Support OR Resistance OR Breakout.
As a part of trading whenever we open our position with Pivot point we should use Stoploss.
Now let see how the Pivot points help to understand the market trend.
Example 1:-
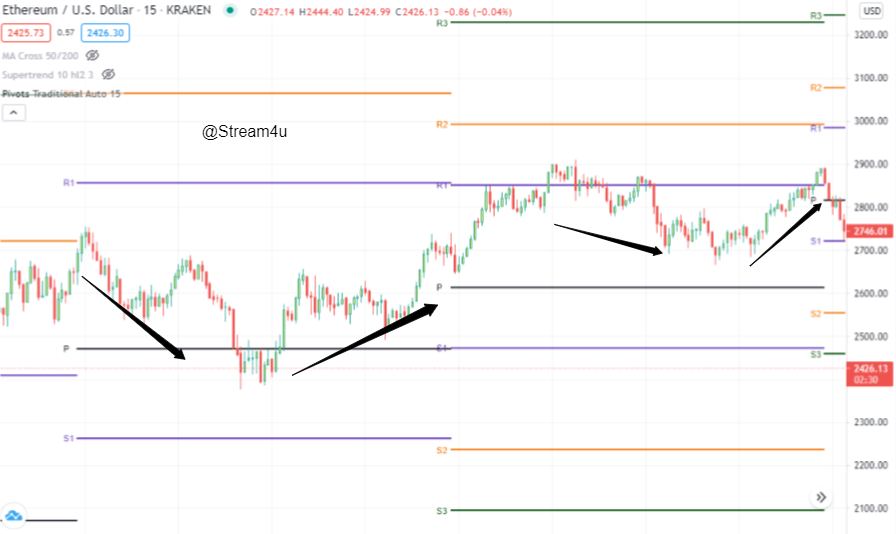
This is a 15-minute candlestick chart and covers 2 days trend.
As mentioned above The PP shows the Market direction. Price above PP will consider Bullish sign and Price Below PP will be considered as Bearish Sign., in the above image we can see the first market start above the main pivot level and remain up side, also continue the same for next day too.
We also see that the price comes towards the main pivot level from the up side and then reverses back and continues to the bullish trend. It was revered from the main pivot level which becomes the first level of support S1 for the next day.
We can also see on the next day chart that prices react to the R1 which is our first resistance level and prices come down from this level.
Here either you can open a trade when the price above the main pivot level OR you can wait to see if the price come toward the main pivot level, see how it react whether it gives breakout or become bullish, then accordingly open a trade and the stop loss will be S1 level.
Example 2:-
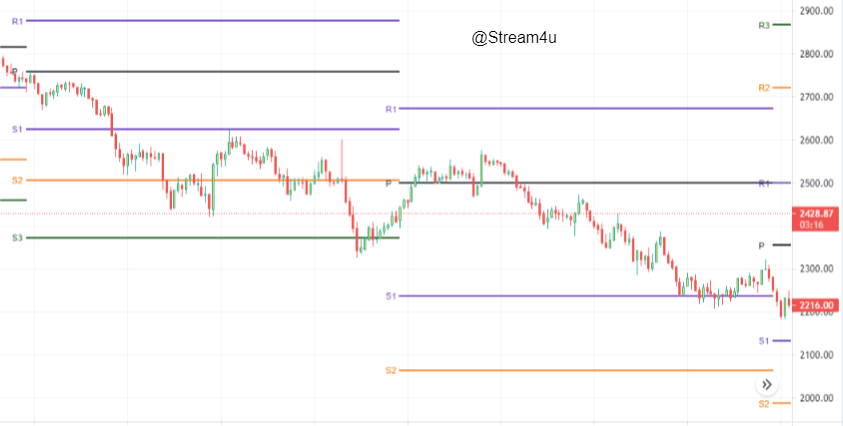
This is a 15-minute candlestick chart and covers 2 days trend.
In the above image, we can see that the Price was started below the main pivot point which already indicated us a bearish trend and remains the same for the next day too.
On the first day of the chart, there was a reverse trend see from the S2 but Pivot level act as resistance and the price does not give a breakout to the Pivot level hence trend remains bearish.
Here either you can open a short trade when the price below the main pivot level OR you can wait to see if the price come toward the main pivot level, see how it react whether it gives breakout or become bearish again, then accordingly open a short trade and the stop loss will be R1 level.
In the Pivot Point Reverse Trading, we will see how the price reacts at the level of R1, R2, R3, and S1, S2, S3.
Now, we will know that the R stands for Resistance and S is Support, we also know that the price goes down from the Resistance and price goes up from the Support.
Example 1:-
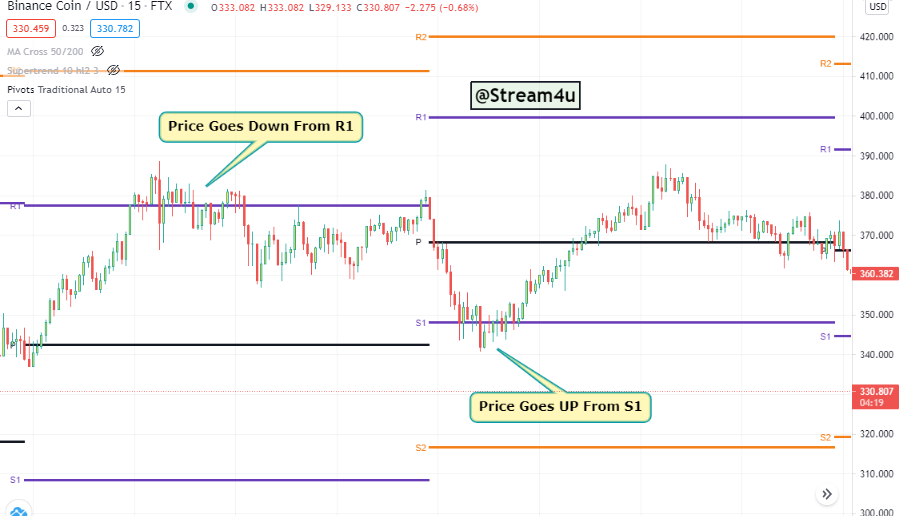
This is a 15-minute candlestick chart and covers 2 days trend.
In this example, I have tried to covered both Reverse Trading and shown how prices react at Pivot Resistance and Support.
On the first day, we can see that the price was above Privot level which indicates bullish but it does not mean it will now remain bullish.
As we know to trade with the Technical indicator we have to respect the charts and the given indicators. In the above image, the price was first above the Pivot level which indicates bullish but then the price was started going down from the R1 level. Atv R1 buyers can exit here to book the profit, and if want then opens a short trade at this level.
On the next day, we can see the price was below the pivot level which indicates a bearish trend but then it started going up from the S1. At S1 short trader can exit to book profit and if want then they can open a buy trade.
Pivot Point Indicator is one of the Strongest indicators that help us to identify the market trend. Pivot Point indicator can be used in a different time frame, we can also use this on 1-day Trading. However this indicator is mostly use by Intraday Traders to book profits.
When the Pivot point moving near the main Pivot Point level then it is a normal trend where we have to wait and not open any trade.
When Price started moving above or below the main Pivot Point then accordingly we will open buy or short trade and accordingly set a stop loss.
Make a Homework Task Post on the below Topics which you can also discuss according to your views on it, and try to explore it as much as possible but in simple terms. Some questions are for your own study and research.
NOTE: Information, Examples are should be related to the Crypto Market and Charts from your own study with tagged your name.
- Discussed your understanding of Pivot Points. (Title For this topic will be Pivot Points)
- Details about Pivot Point Levels.
- Pivot Point Calculation and R1 R2 S1 S2 Pivot Levels Calculation.
- How to Apply Pivot Point on Chart. (Screenshot with tag your name)
- How Pivot Points Work. (Screenshot with tag your name)
- Pivot Point Reverse Trading. (Screenshot with tag your name)
- What could be a common Mistakes in Trading with Pivot Points
- What could be the reasons For Pivot Points is Good.(Pros/Advantages)
- Apply the Pivot Points indicator in the Today chart (the day when you making this task) and set the chart for 15 minutes. Explain the market trend till the time of writing the task and how it will be next till the end of the day. You can give possibilities on both the side bearish and bullish.
- Weekly Price Forcast For Crypto Coin: XXXXX(Based on all previous lectures of technical studies Forcast the Weekly price for any Crypto coin, Title will be the same just replace XXXXX with the Coin name and covered all below points in it as a part of Price Prediction for the next 1 week.)
- The basic information or your thoughts on the Crypto Coin that you would like to Predict its price for the next 1 week? (Title for this will be the same as above and cover answer for this under the same.)
- Reason why you would like to predict the selected Coin? (Title for this will be Why XXXX?, replace XXXXX with the Coin name.)
- Complete detail on it's one of the analyses of Technical/Fundamental/Sentimental with price details.
- With the detail of anyone Technical/Fundamental/Sentimental study what will be the possible low level and the high level for the next 1 week?
11. Conclusion.
For any concerns, doubts, questions on homework tasks, you can ask me in the comment section below before making Task.
IMPORTANT- All homework posts should be posted in the community Steemit Crypto Academy .
For this Homework Task, add tag #stream4u-s2week8, and #cryptoacademy in the first 2 tags. Also, tag me as @stream4u somewhere in a post. (Tagged Correctly)
Homework Task for this week will be reviewed by #stream4u-s2week8, so make sure to tag it correctly. Incorrect Tagging, the task will miss reviewing.
PLAGIARISM Will Not Accepted, hence make sure content in the post not copied and pasted from certain sources.
Images used should be from copyright-free sources and fully referenced. To avoid confusion make sure the Images do not have a watermark, company name, web site name on it.
Chart Graph should be from your own Graph Study and tagged with your name in it. Make sure Chart Graph, not from Google images.
Post Require a minimum of 300 words. Tips On a minimum of 300 words!
Submit Homework task between 31 MAY 2021 To 5 JUNE 2021.
Homework posts will not consider for grade if it is submitted after 11.59 PM UTC, on Saturday, 5 JUNE 2021.
If your Homework task does not get reviewed within 24 hours after you published it, then please send your Task link under the comments on this post.
To eligible for a grade you must have at least 150 STEEM POWER and Reputations 50 or above
Some notifications for tagged not received so after 48 hours from published Task if it is still not reviewed, try to reach professor frequently.
Given Grades and Reviews are based on the submitted Task which will not change after review.
Thank You.
@stream4u
Crypto Professors: Steemit Crypto Academy
Profesor , me niego a realizar la tarea ya que estos mecanismos no funcionan hice el esfuerzo pero no puedo atentar contra mi mismo escribiendo sobre algo que no me funcionara.
This Post Has Been Shared On Twitter
You have been upvoted by @sapwood, a Country Representative from INDIA. We are voting with the Steemit Community Curator @steemcurator07 account to support the newcomers coming into Steemit.
Engagement is essential to foster a sense of community. Therefore we would request our members to visit each other's post and make insightful comments.
Thank you.
Thank You.
Hi, @stream4u
Your post about technical indicator pivot points is well explained to learn for trading, you have really done a great job.
Repost of my homework
https://steemit.com/hive-108451/@predomina/5lgr4o-crypto-academy-week-10-homework-post-for-stream4u
Hello prof. I set my Pivot chart but it is completely different from yours. In my chart market is trading out of all resistances, how to set up it? I am using Binance, in which exchange you did? Thanks!
As I said, I used TradingView so here also I use the same platform to demonstrate how to add Pivot Points on a chart and how to configure it.
In Binance you can follow the below step.
Thank You.
@stream4u
Crypto Professors : Steemit Crypto Academy
#affable
Thank you prof, I will also use Trading View as I am unable to set up in Binance.
Hi dear professor @stream4u .My post for the previous week 7 is not checked and reviewed. I am very worried about it getting ignored.
Please help me for rewieng my post so that i will get reward of my effort.
Here is the link for my post.
https://steemit.com/hive-108451/@qamarsudagar/homework-task-season-2-week-7-or-or-exchanges-order-books-or-or-by-qamarsudagar
Cc:
@stream4u
@yousafharoonkhan
Cc: @yousafharoonkhan
Sir stream4u can you describe me the whole method of convrting steems into Pakistani currency step by step.... Thankyou
You will have to search for the Crypto Exchange which is based on Pakistan Currency that able to complete your KYC quickly and connect your bank account.
Let me tell you how I do.
Transfer STEEM to Crypto Exchange Binance
Then Trade STEEM with BTC and buy BTC.
Then Trade BTC with TRX and buy TRX.
Then Transfer TRX to Crypto Exchange WazirX
Then Sell TRX on Crypto Exchange WazirX with INR.
Not sure if Crypto Exchange [WazirX] https://wazirx.com/invite/3yapn82g) supports Pakistan Currency.
@yousafharoonkhan may guide you correctly on this.
Thank You.
@stream4u
Crypto Professors : Steemit Crypto Academy
#affable
Thankyou sir for your kind information
Cc:- @steemcurator02
https://steemit.com/hive-108451/@noraiz/crypto-academy-season-2-week-7-homework-post-for-yousafharoonkhan-exchange-order-book-and-its-use-and-how-to-place-different
Hi @stream4u need your attention here
friend there is still time for you to vote, usually they give the votes between the 5th and 6th day, be patient
Repost of my homework
https://steemit.com/hive-108451/@olaspecial/steemit-crypto-academy-or-or-course-for-stream4u-crypto-margin-trading-and-crypto-leveraged-token-trading-or-or-entry-by