[Technical Indicators] - Crypto Academy / S4W2- Homework Post for @reminiscence01 / by:@sumit71428
Hello everyone hope so you all are good so friends today i will be presenting my homework post for Professor @reminiscence01 i am really happy with the lecture which he provided us as it has helped me gain knowledge with the information he provided.
Question 1(a):
In your own words, explain Technical indicators and why it is a good technical analysis tool.
Answer 1(a):
Technical Indicators are created by traders who uses certain set of mathematical equations which under any given situation act the same and tend to give same results. There are many type of technical indicators which are used for finding trends of the market as the major focus of traders is to find the trend and make the maximum profit from it.
Some of the most famous indicators used are RSI, MACD, EMA, VOLUME INDICATOR etc... These all Indicators have there own importance as when they get combined together then it can turn out to be a great tool for analysing the market.
We all traders are in the market to get benifits from it and if by anyway we could find weather the market will go upwards or downwards then we can earn profit from it. Indicators help us find the trend which is really important for the analysis part and it is really good analysis tool in general.
Question 1(b):
Are technical indicators good for cryptocurrency analysis? Explain your answer.
Answer 1(b):
No matter in whichever market we are we always think to analyse the trend of the market and if we are able to analyse it then it can really turn out to be a good tool for cryptocurrency analysis.
As said above there are many indicators which serve different purposes to find different things about the market and when they get combined with the due diligence then it is good for crypto analysis.
Question 1(c):
Illustrate how to add indicators on the chart and also how to configure them. (Screenshot needed).
Answer 1(c):
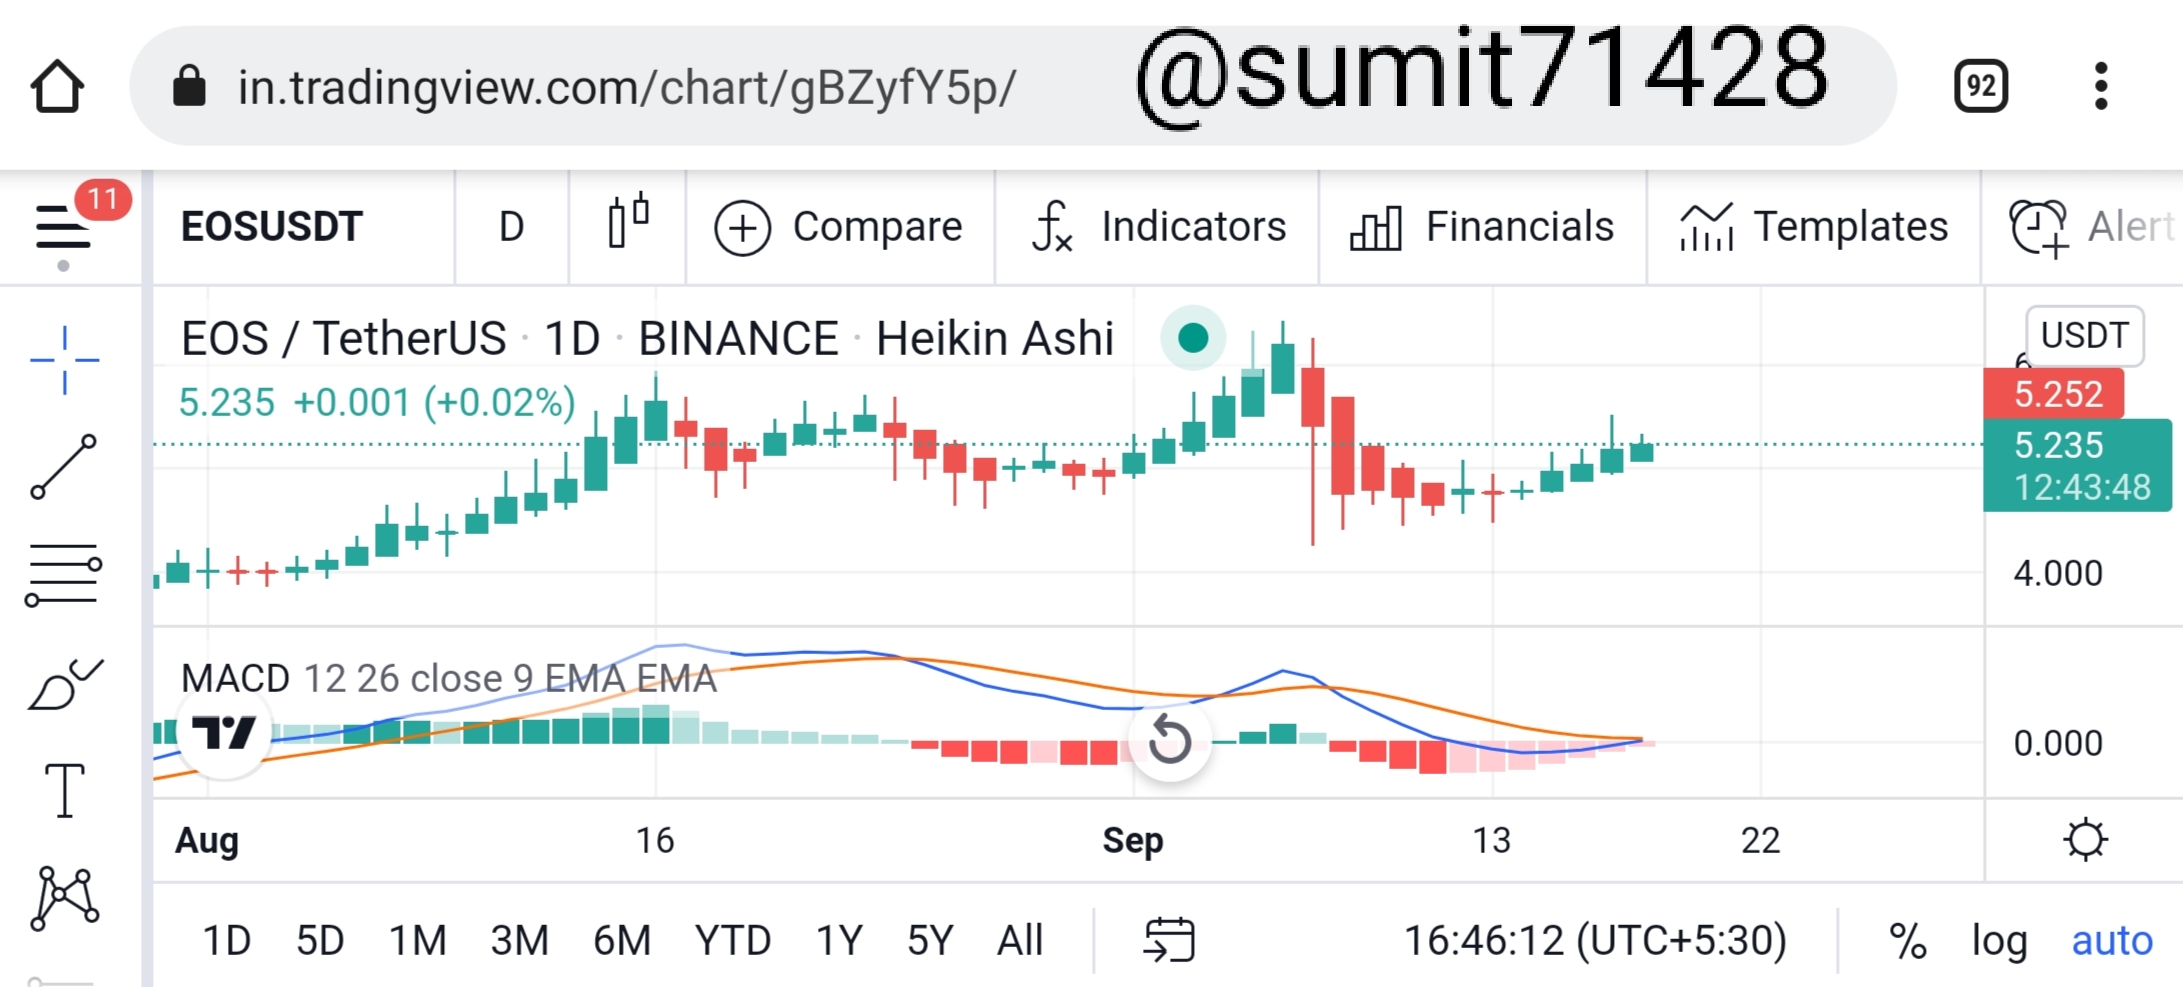
For adding the Indicator first we have to go on the tradingview.com
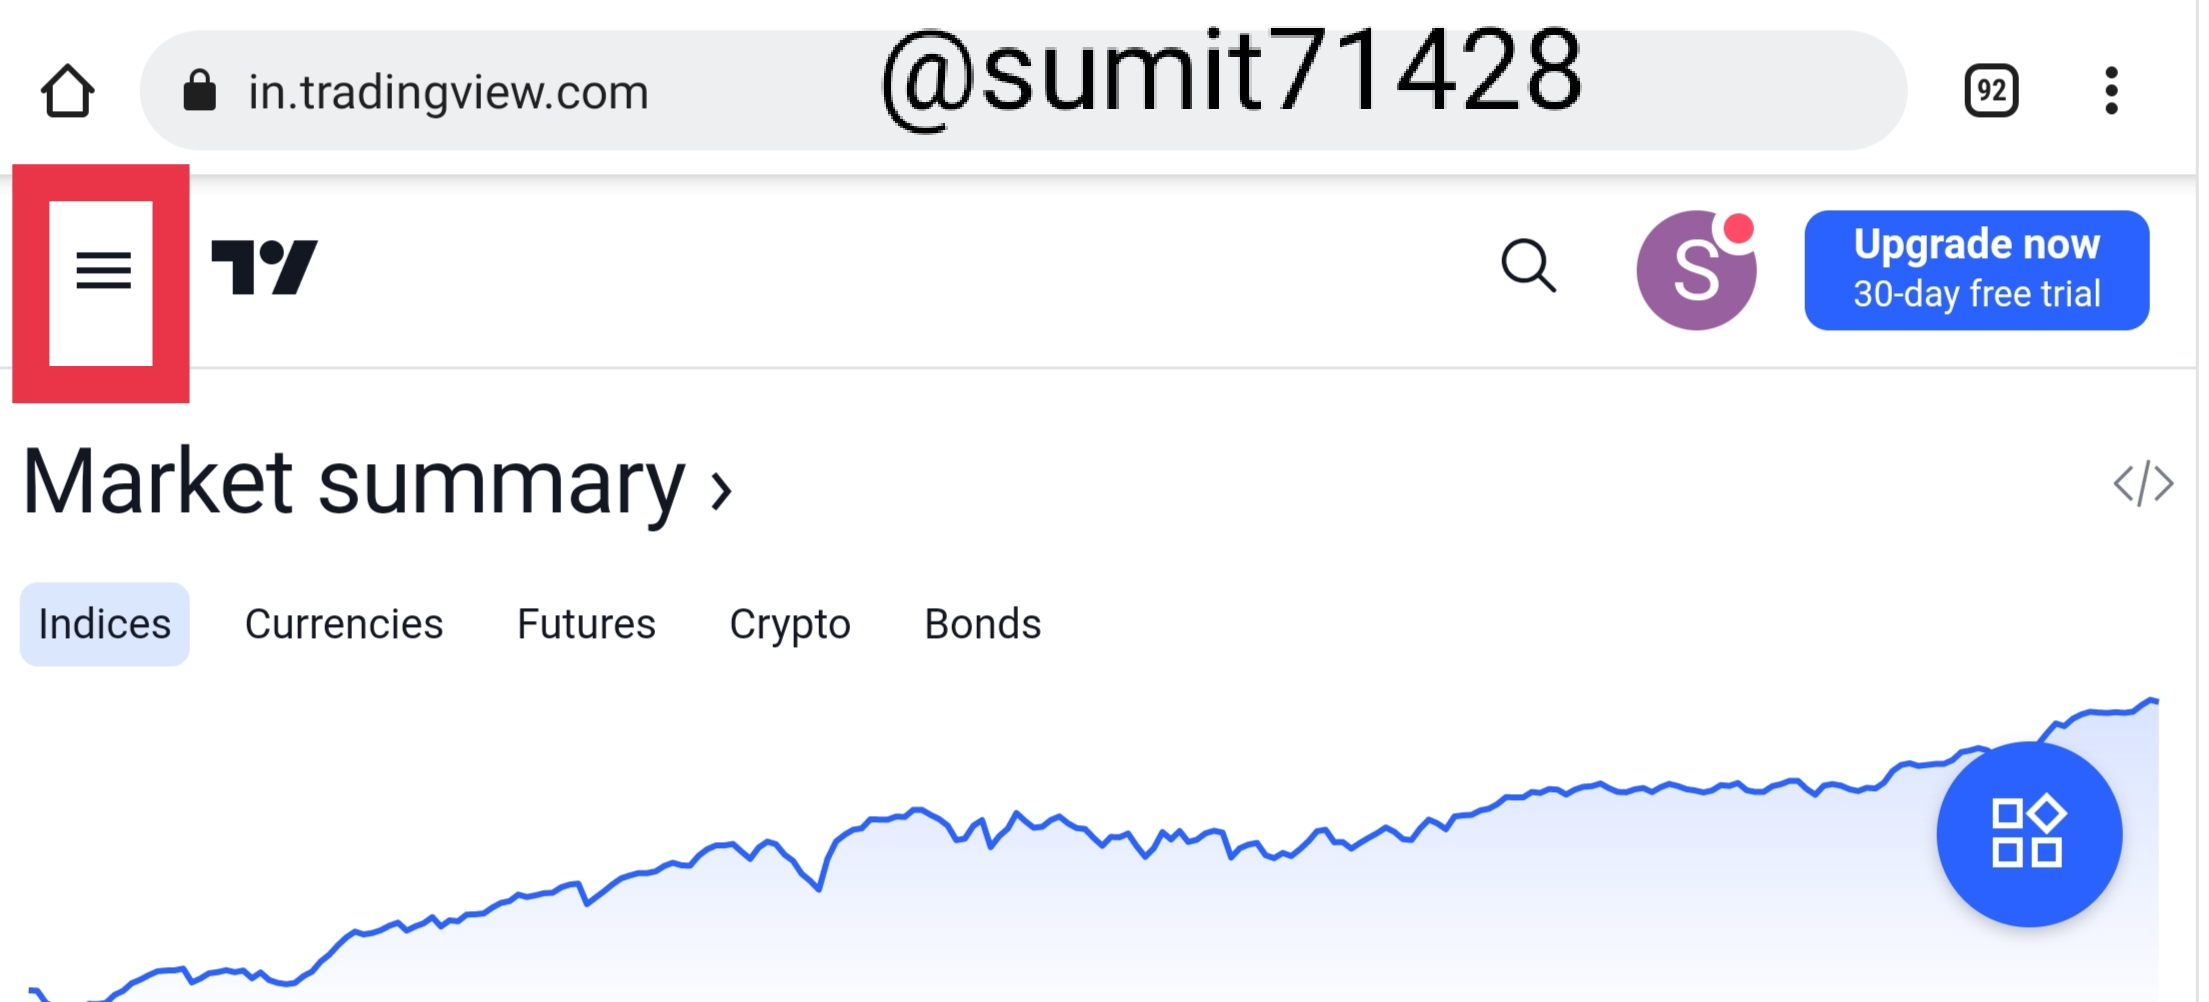
- Now click on the 3 line.
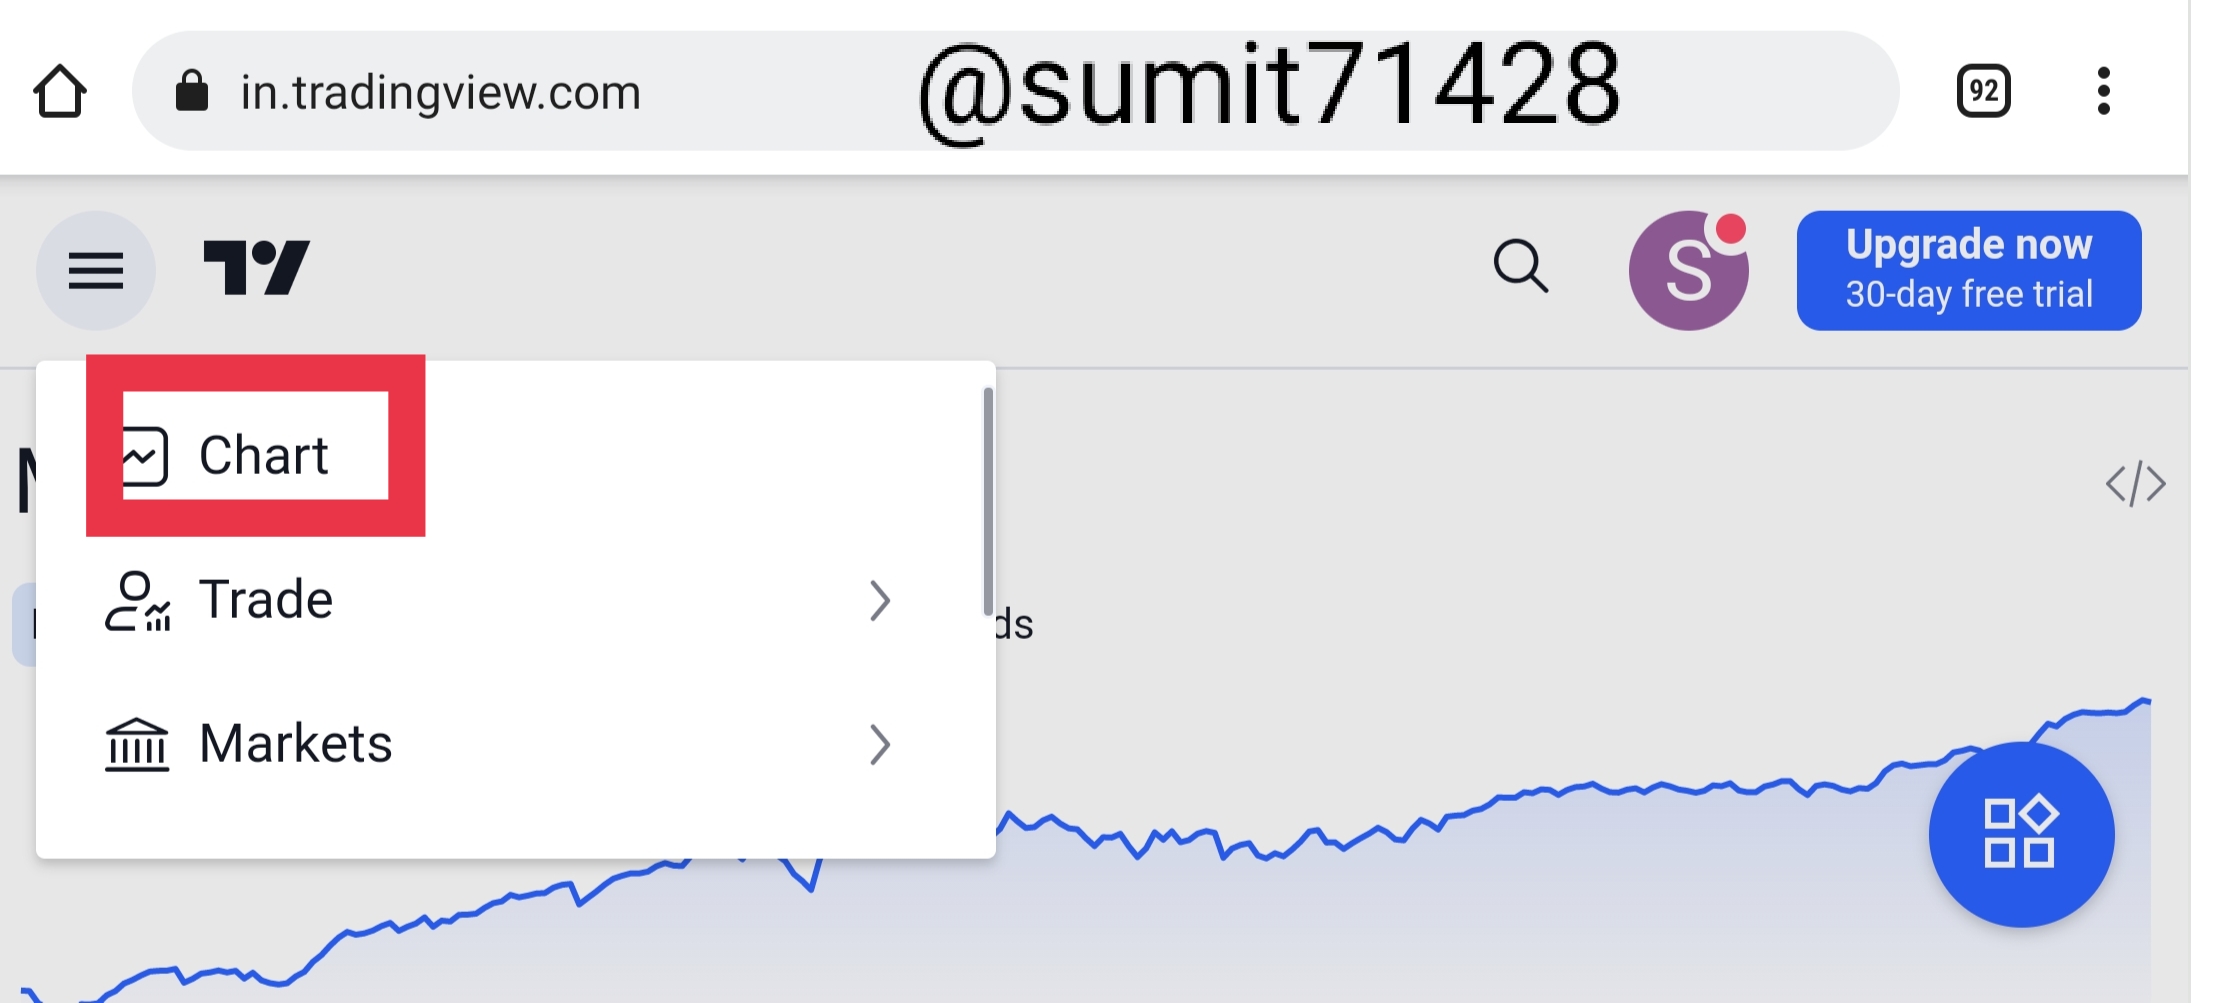
- Now click on chart.
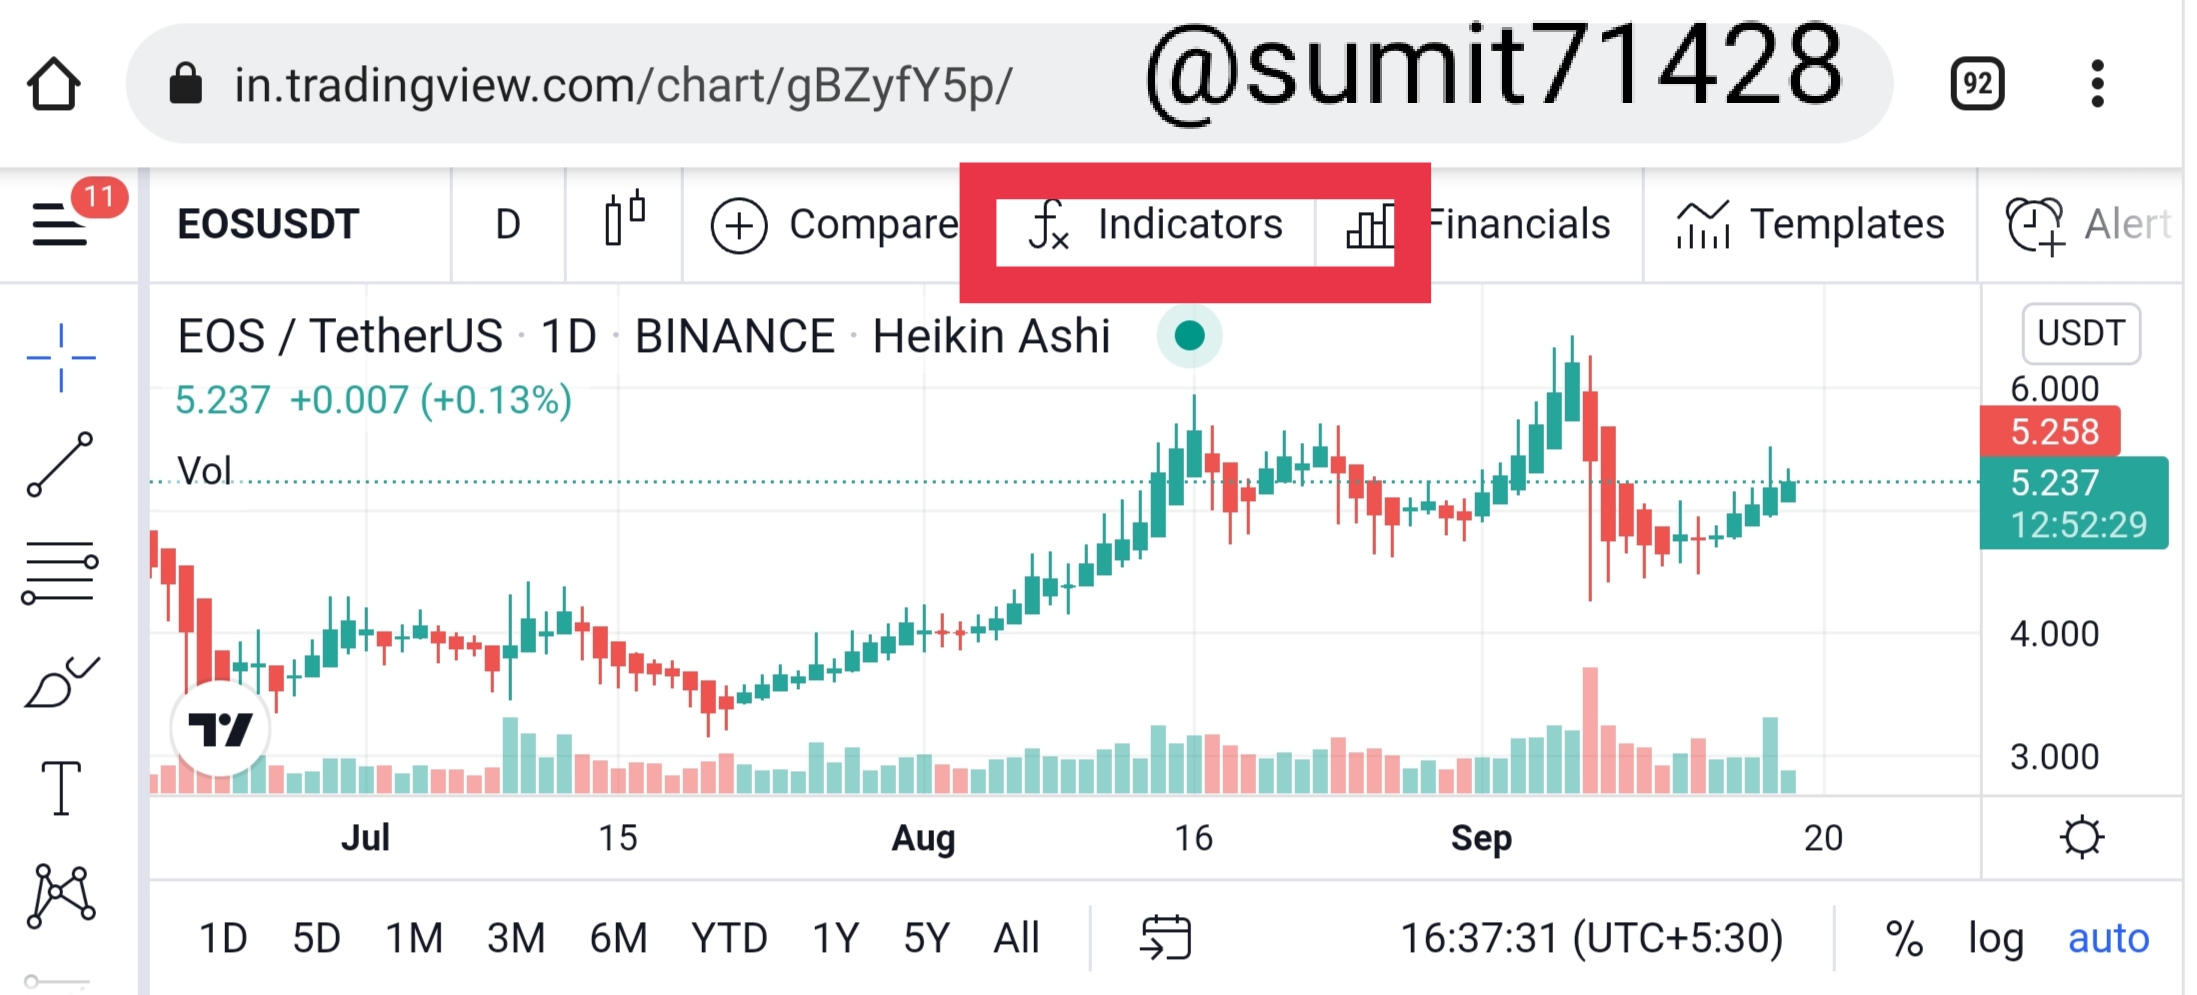
- Now you can see the indicator option and then click on it.
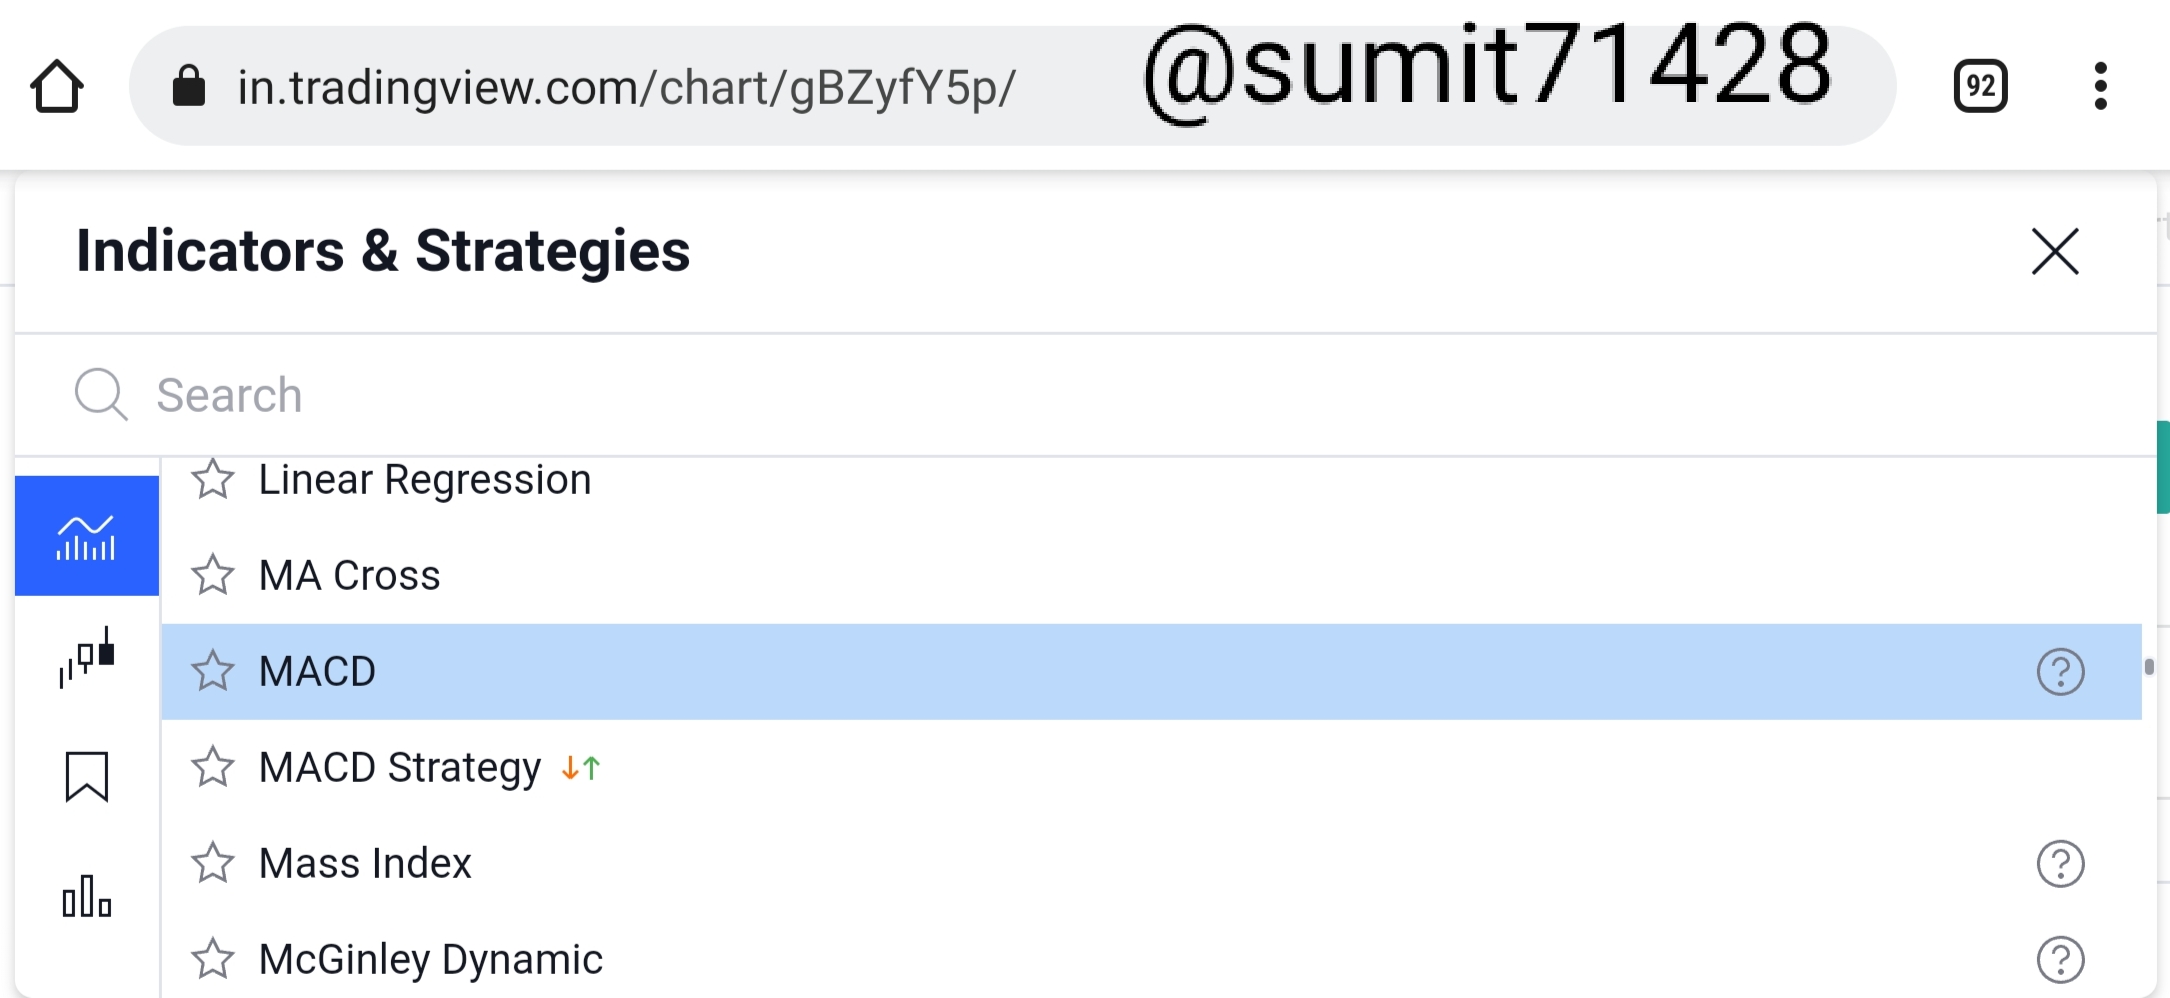
- Now you can select any Indicator of your choice as i have selected MACD.
How to configure the indicator:
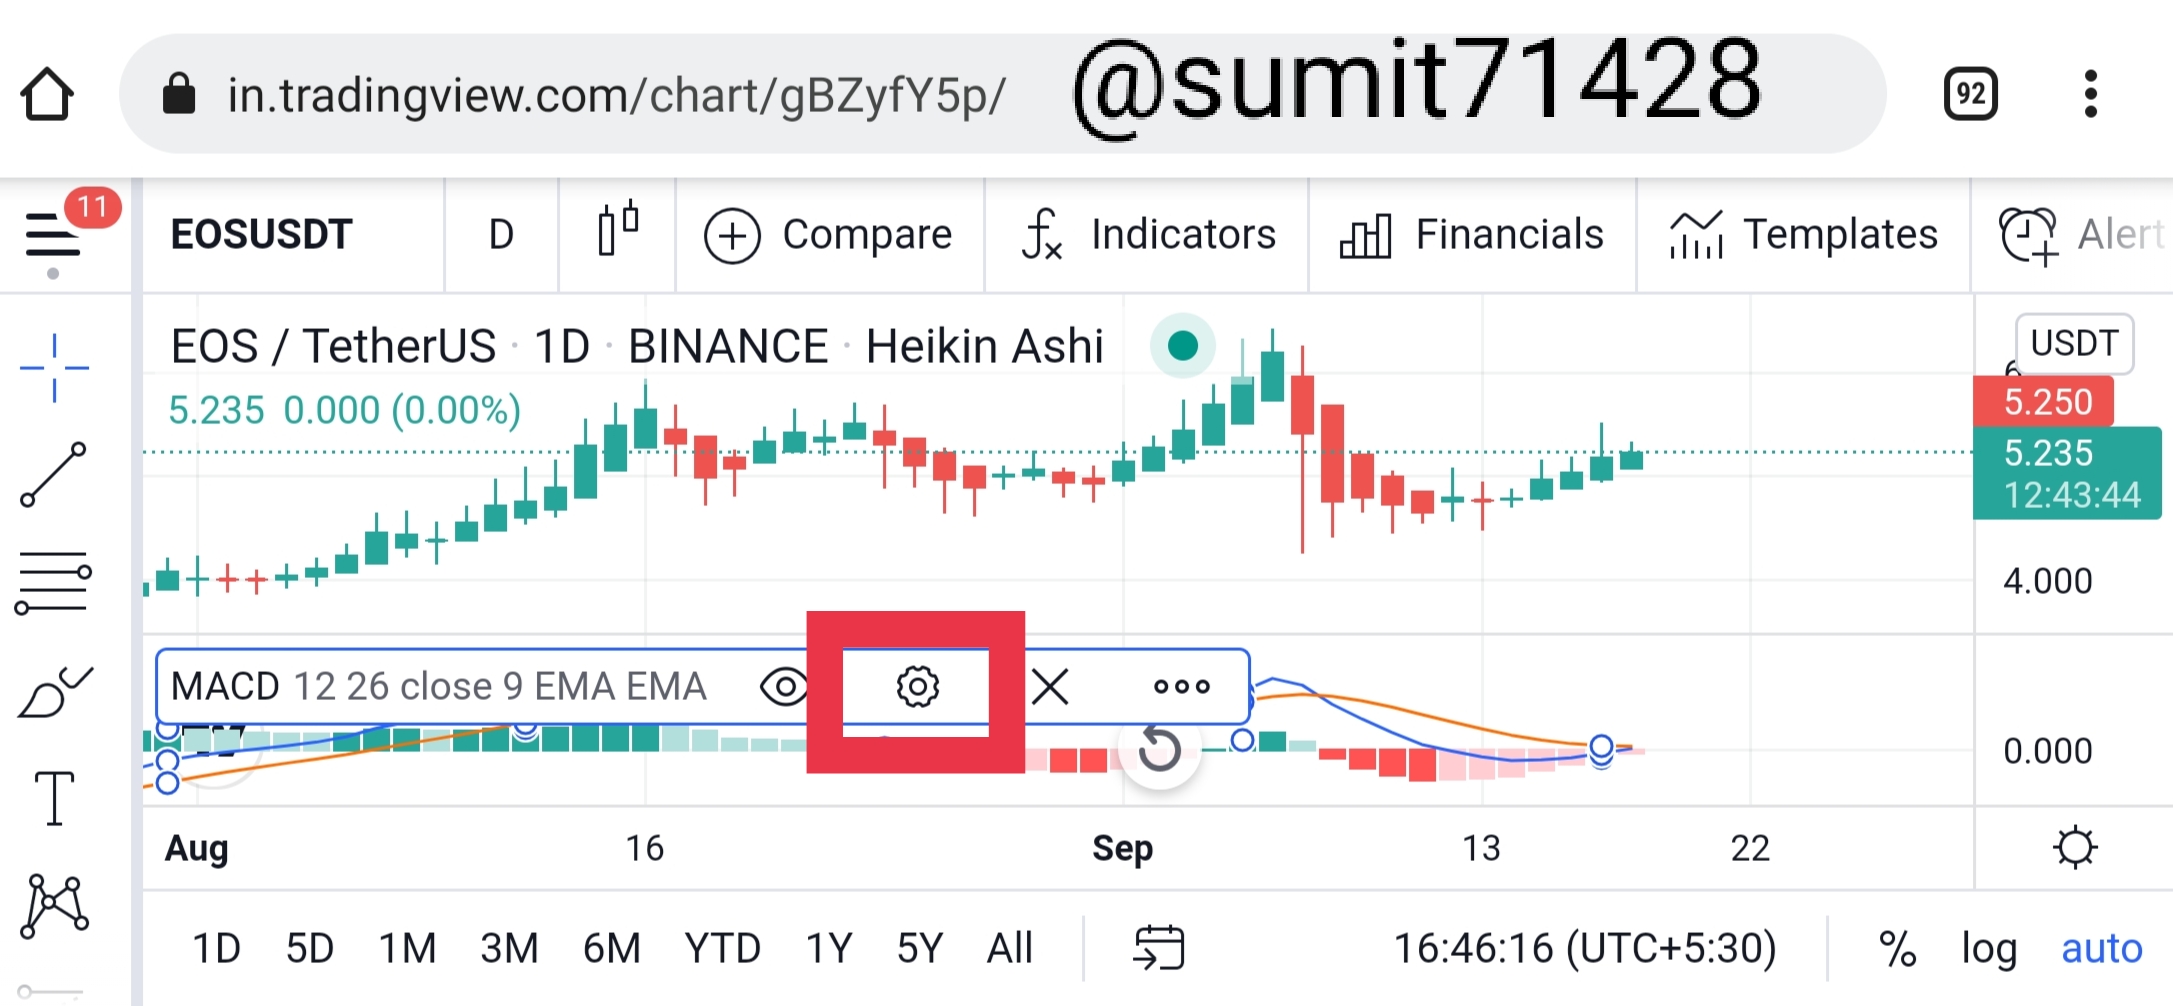
- After clicking on the indicator we will get the setting option click on it.
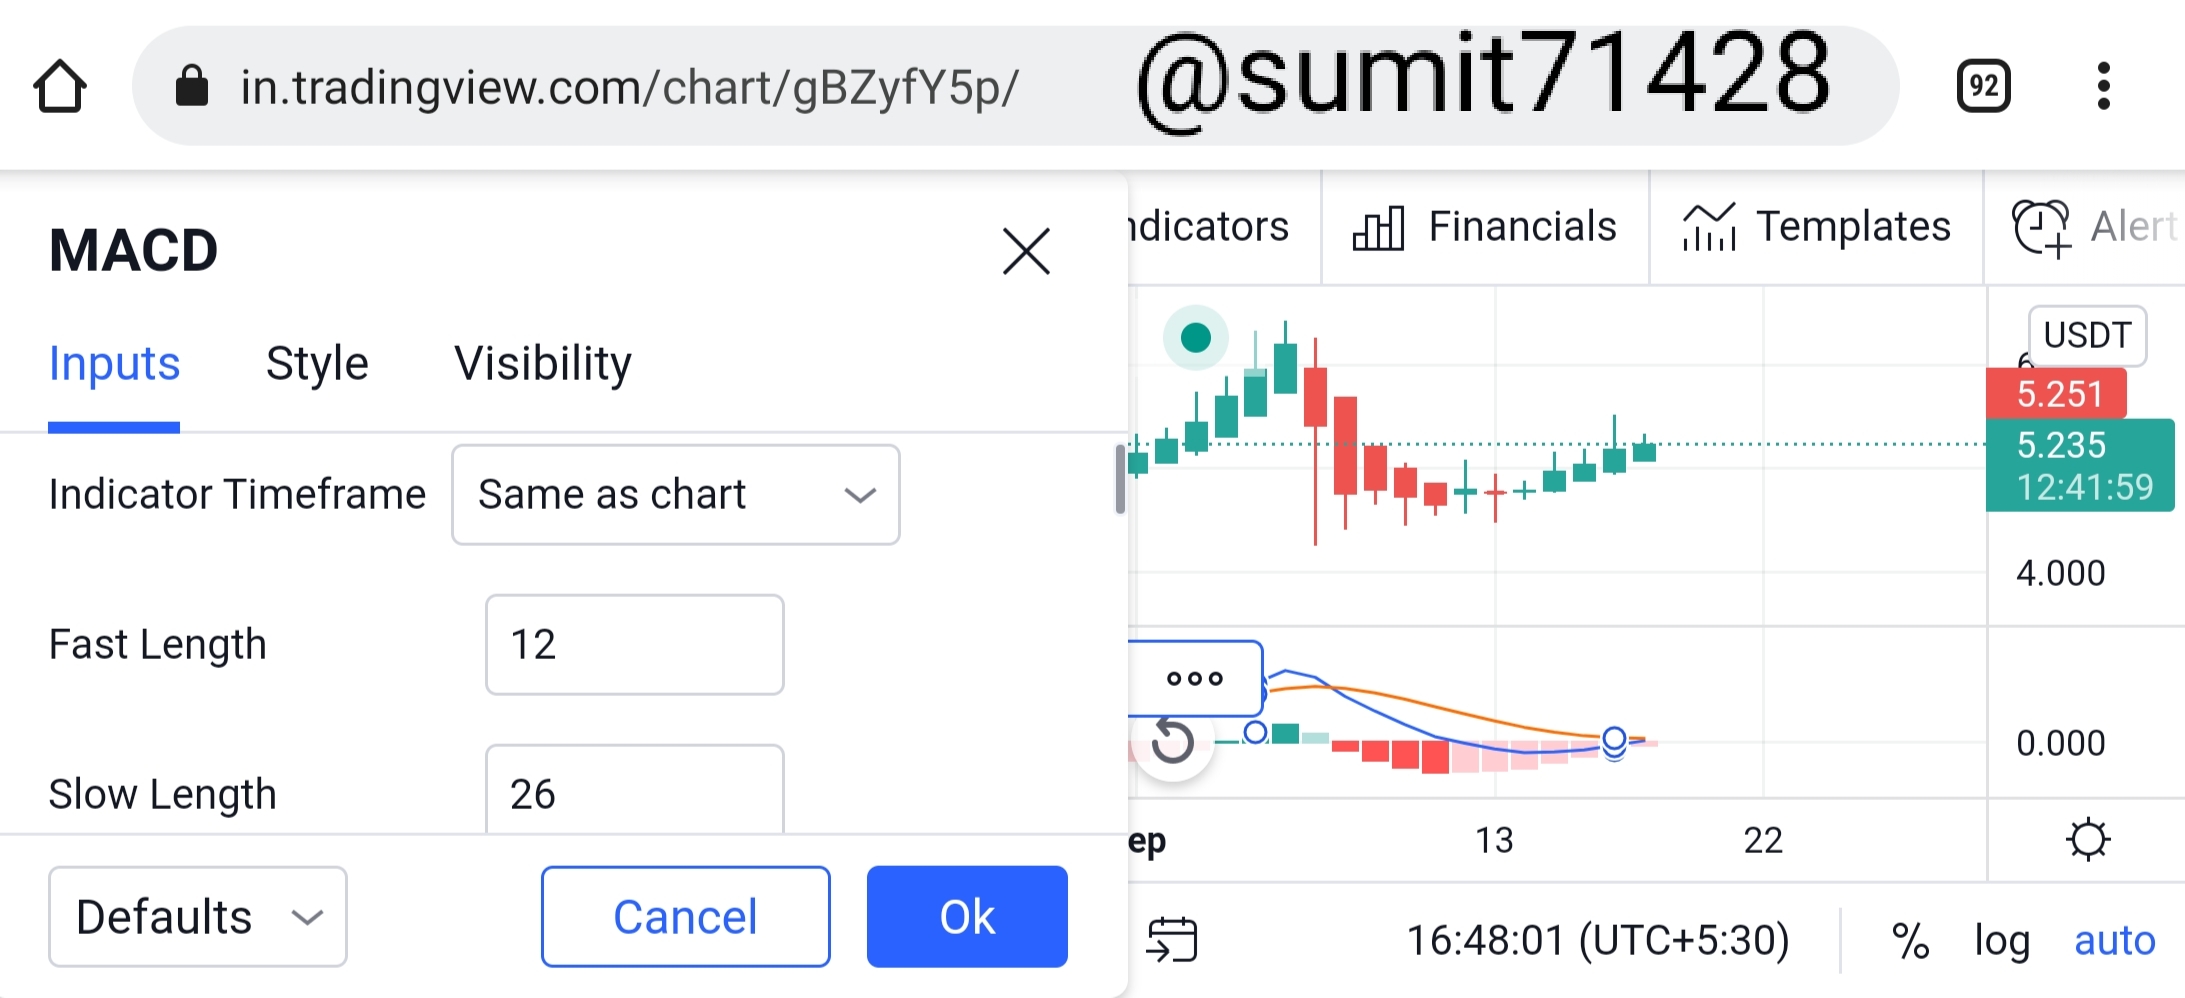
- Now we will get the option to configure the values of different parameters and we can fill its value and that's all the indicator will get configured.
Question 2(a):
Explain the different categories of Technical indicators and give an example of each category. Also, show the indicators used as an example on your chart. (Screenshot needed).
Answer 2(a):
There are three categories of indicators which are used by moat of the traders.
- Trend Indicator
- Momentum Indicator
- Volatility Indicator
Trend Indicator:
When the market moves in the upward direction then it is called uptrend and when the market moves in the downward direction then it is called downtrend and the tools which are used to find these trend are called Trend Indicators.
There are many types of trend finding indicators available in the market different people tend to use different but most commonly used one is ADX indicators.
ADX( Average Directional Movement Index) Indicators.
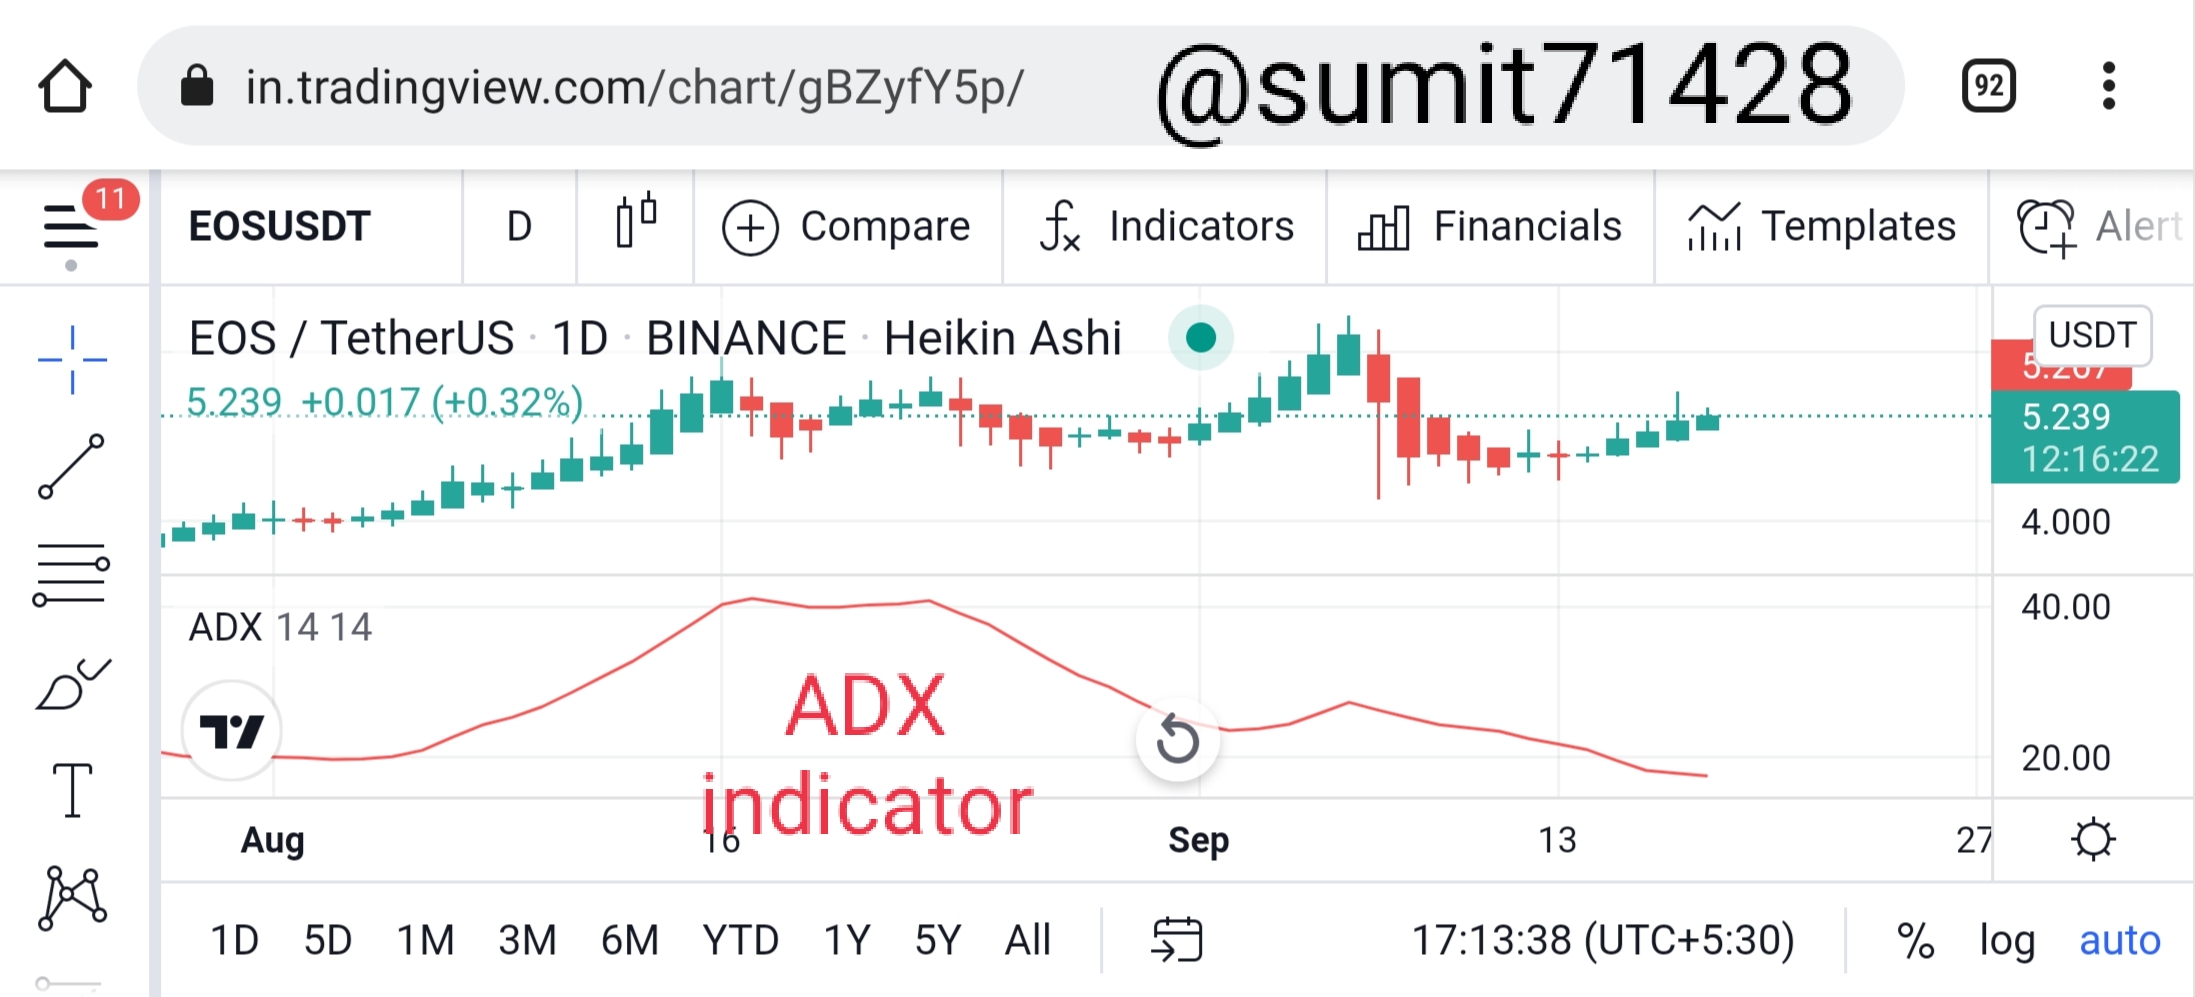
Hear is the example of ADX indicator applied on the chart.
Momentum Indicator:
Whenever we tend to find the strength of the market it is always done through the Momentum Indicator. This is basically helpful in the situation of overbought and oversold as these indicators helps in locating these area where this situation is taking place.
For this purpose as well there are many indicators available in the market but the most commonly used one is RSI indicator.
RSI(Relative Strength Index) Indicators:
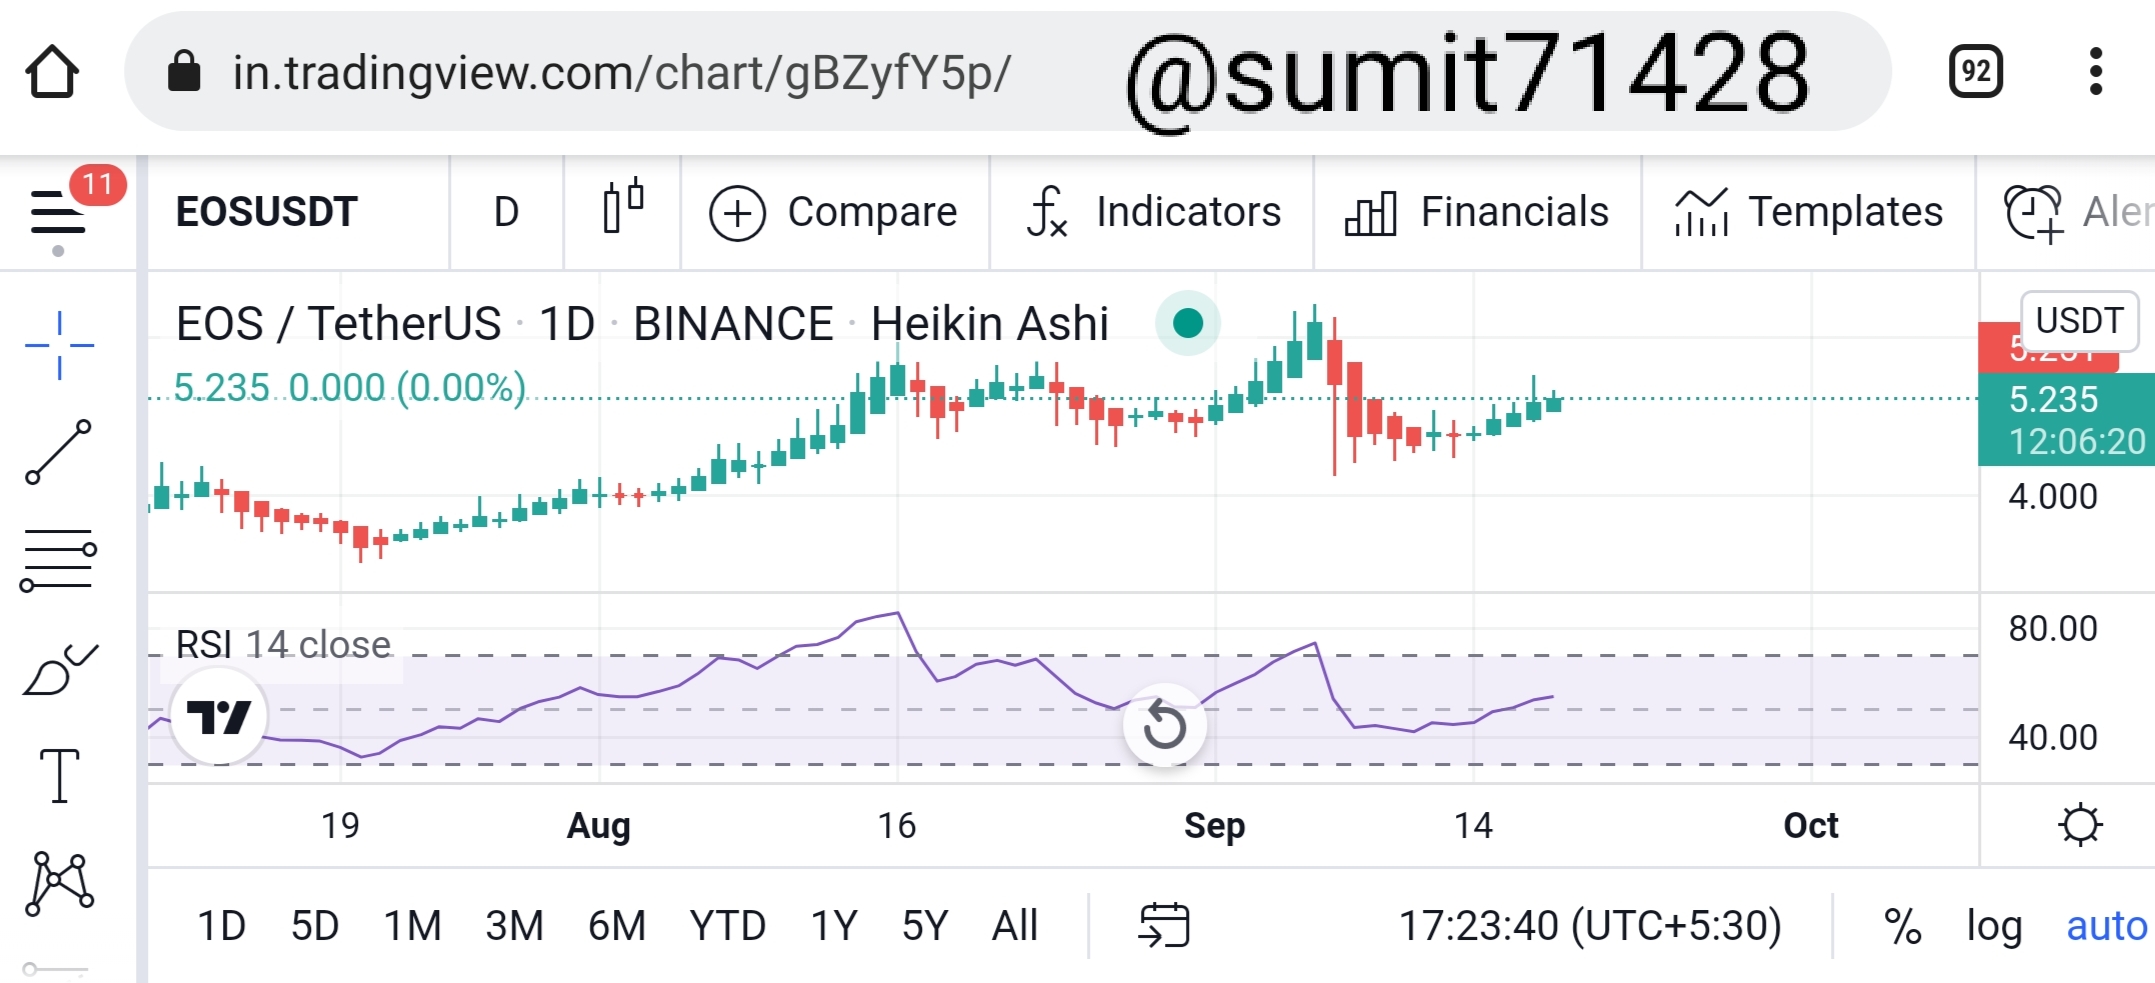
Volatility Indicator:
As the word suggest itself it is the fluctuations of the market which is taking place with different variations. It is nothing other than the movement of price when falls or rises very aggressively then it is denoted as the volatility of the market.
It is often said that when the market is volatile then we should trade very carefully and we should avoid high leverage as it can lead to the liquidation of our funds.
For knowing the volatility as well there are many indicators famously used being Bollinger Bands.
Bollinger Bands:
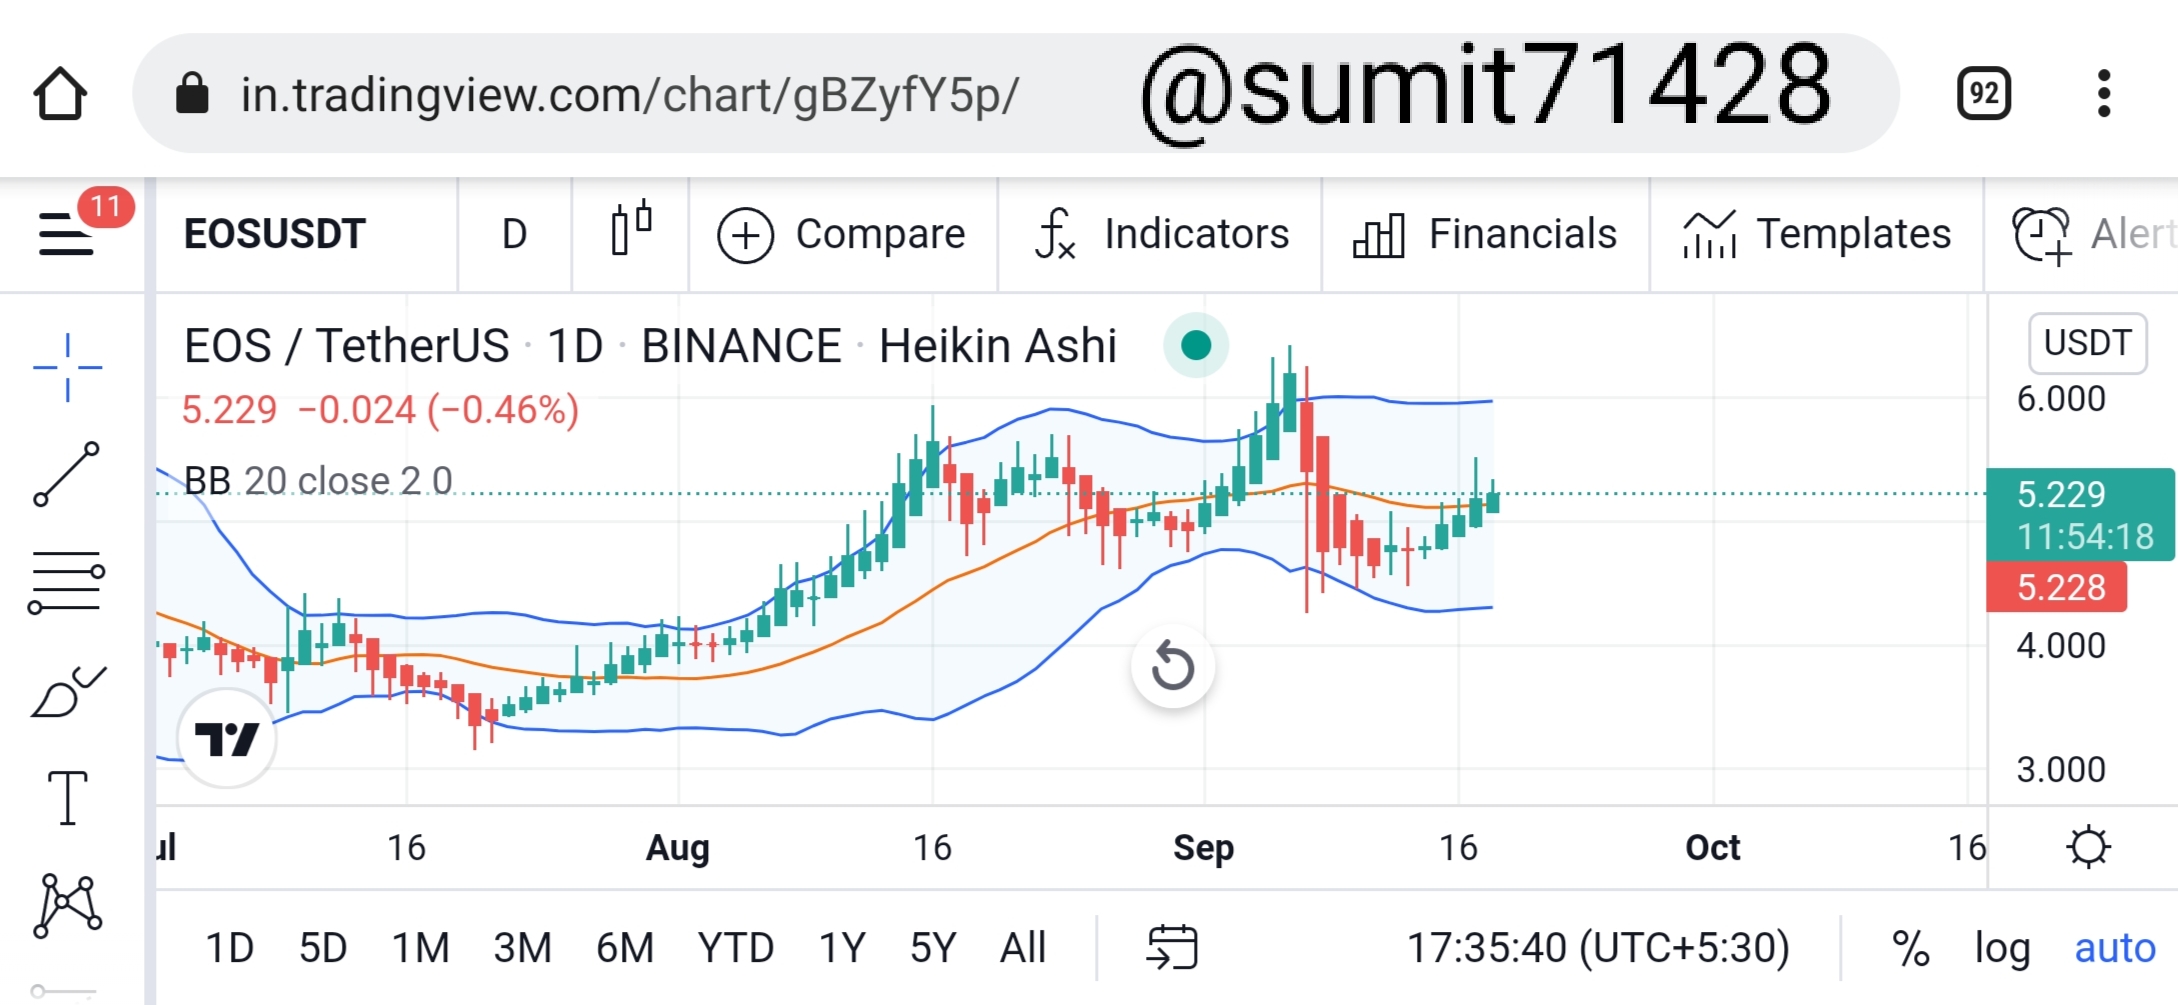
Bollinger Bands are very great indicators which are very useful for knowing the volatility as these bands take into consideration the different averages which help us assertain the volatility.
Question 2(b):
Briefly explain the reason why indicators are not advisable to be used as a standalone tool for technical analysis.
Answer 2(b):
Undoubtedly indicators are very great tool for analysing the market but it is always said that it should not be used as standalone tool as there is always due diligence which will be required for execution and finalizing the trade.
Also the Indicators don't always guarantee the success of trade and if we will be taking trade just based on the Indicators then for sure we are going to liquidate our account for sure.
Hence, indicators should always be used as an supporting tool for our trades and not the standalone tool.
Question 2(c):
Explain how an investor can increase the success rate of a technical indicator signal.
Answer 2(c):
The success rate of an investor can only increase when he will be using different types of indicators and mixing it to get good signals and then verifying it with other market news to validate it for a better chance of winning that trade.
Also with experience when we will be using it to improve our knowledge then definitely it will add on towards the success rate of our trade.
We must agree that no matter whatever we do but constant improvement in our knowledge is required as it will help us in long run to the successful journey of trading.
Conclusion
It was an great lecture and i have got all my basis clear from this course and i must thank professor @reminiscence01 once again for such lovely lecture which has helped me and many others too.
Thanks friends have a great day ahead.
Please verify my achievement 3 already i have already edited it.
@sumit71428 when are you planning on verifying my achievement 3 post so that i could continue with achievement 4
Check Head Achievement 1
https://steemit.com/hive-172186/@kamar234/my-introduction-newcomers-community-17sep-2021
Hello @sumit71428, I’m glad you participated in the 2nd week Season 4 of the Beginner’s class at the Steemit Crypto Academy.
Unfortunately, it is observed that your account is guilty of using upvotes tools to build your reputation and also buy votes. This act is against the rules of Steemit Crypto Academy.
We encourage users to build their rep organically through creation of quality content.
Remark: Homework Task Disqualified
I completely appreciate your point but i haven't bought any vote but still i have undelegated my steem from nutbox you can check.
Please check my achievement5 Task 1 post
https://steemit.com/hive-172186/@amirbhat/achievement-5-task-1-or-amirbhat-or-review-steemworld-org
Please have a look at my achievement5 Task 1 post
https://steemit.com/hive-172186/@amirbhat/achievement-5-task-1-or-amirbhat-or-review-steemworld-org