Understanding Trends II - Crypto Academy / S5W3- Homework Post for @reminiscence01
Hello Steemit!
Here is my homework post for Professor @reminiscence01. This was a great lesson and also a great addition to my knowledge. Let's start with the post.
.png)
1. a) Explain your Understanding of Trend Reversal. What is the benefit of identifying reversal patterns in the Market?
As we all know, the market is characterised by two distinct trends: bullish and bearish, which alternate. Because neither positive nor bearish trends endure, there is a reverse along the line, allowing the opposing trend to emerge. Trend reversal is the term for this kind of reversal.
Who is really in real control of the market dictates the market's distinct patterns, whether bullish or bearish. When buyers dominate the market, we observe a positive trend, and when sellers dominate the economy, we see a negative trend. As a trend develops, the ruling party loses the ability to move pricing in their favour, and is defeated by the opposing party. Reversals occur in this manner.
A trend reversal may be either a positive to negative correction, where in case a positive trend becomes a bearish trend, or a negative to positive correction, where in case a bearish trend becomes a positive trend. The strength of bulls declines during a positive to bearish reversal, and they are finally overcome by bears, who move the market downwards. In a negative to bullish reverse, bears relinquish authority to bulls, who push the stock upward.
b) How can a fake reversal signal be avoided in the market? (Screenshot needed).
Because the patterns we use to anticipate price movement aren't always correct, caution is required to avoid making trading choices based on erroneous signals. As we taught in class, we may spot trend reversals using a variety of approaches, including market break, trendline break, double high and double bottom formations, and divergences. There are times when we may observe this pattern appear, but there would be no reversion since the pattern's reversal signal was really a ruse. In this scenario, we don't only need to depend on patterns; we also need to use technical indications to establish combination or agreement before reaching a conclusion. To demonstrate this, I'll use the RSI indicator inside the chart below.
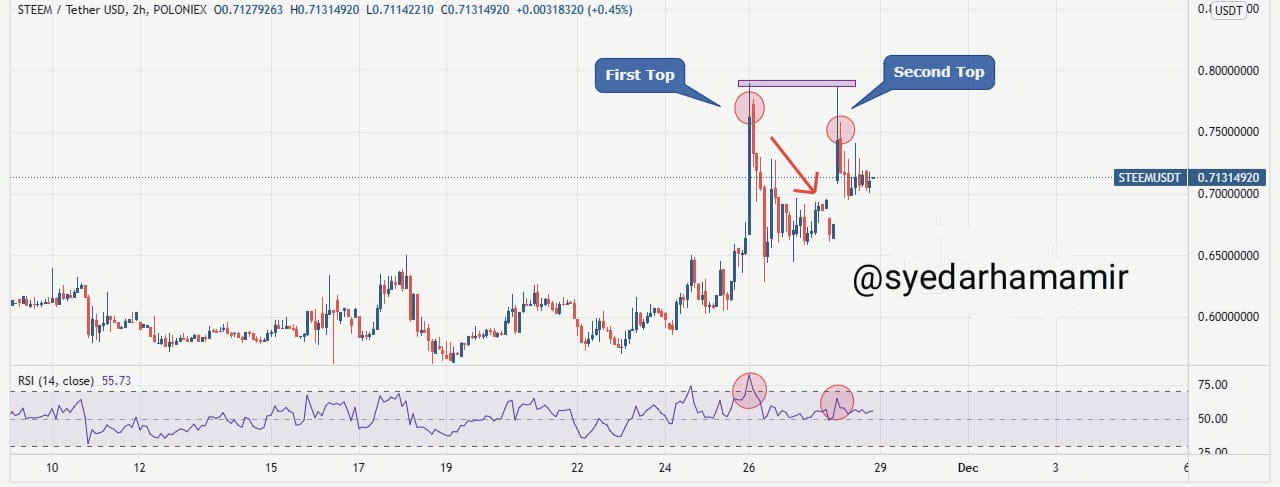
The RSI, as we all know, employs 70 and 30 zones to determine whether or not a stock is overbought. Overbought assets are predicted to fall, while oversold assets are expected to rise. On the STEEMUSDT chart, a double top structure forms, signalling a reversal, as seen in the picture above. This reversal, however, is erroneous. Please hear me out. We can see that when the initial peak of the structure was formed, the RSI broke over 70, indicating that STEEM was overbought, and STEEM did indeed revert in a downward retracement. However, RSI did not signal oversold after the upcoming second top, suggesting that no trend reversal is imminent.
2. Give a detailed explanation on the following Trend reversal identification and back up your explanation using the original chart. Do this for both bullish and bearish trends (Screenshots required).
a) Break of market structure.
b) Break of Trendline.
c) Divergence
d) Double top and Double bottom
We spoke about how market structure may be utilised as a trend indicator. With this information, we can conclude that a breaching or breaking of a bullish and bearish market structure signals the market is preparing for a possible reversal.
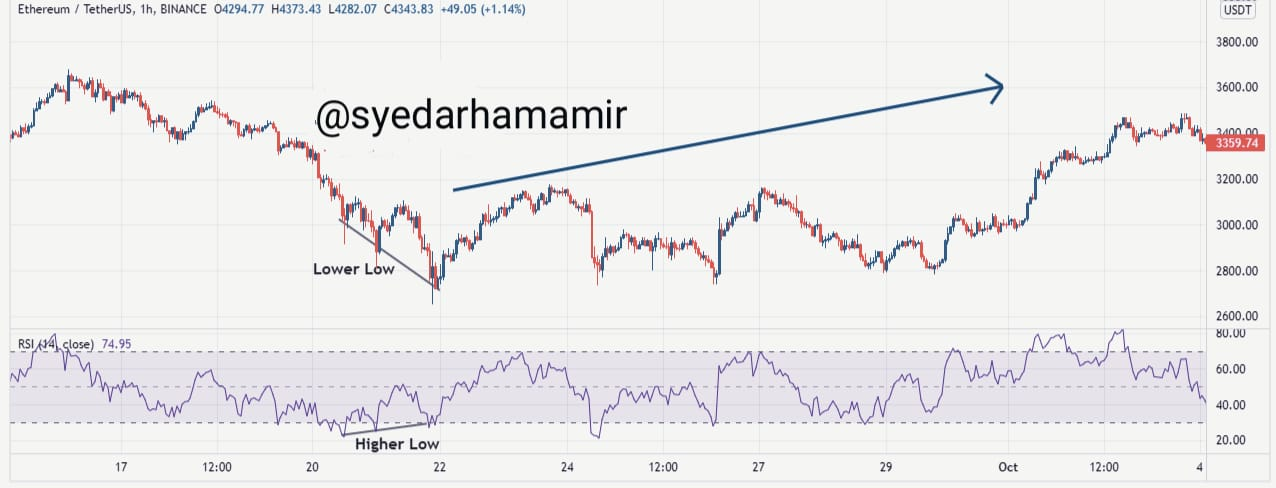
The market structure for a bullish trend indicates market producing high highs and high lows. This simply implies that the price must produce greater highs and lower lows than the prior highs and lows. This indicates that bulls are still in charge and pushing the market upward. Failure to establish new highs signals a break in the bullish market structure, indicating that bulls' strength is waning and bears are gaining control of the market. Let's look at a market structural break in the bull market below, which led to a positive to negative reversal.
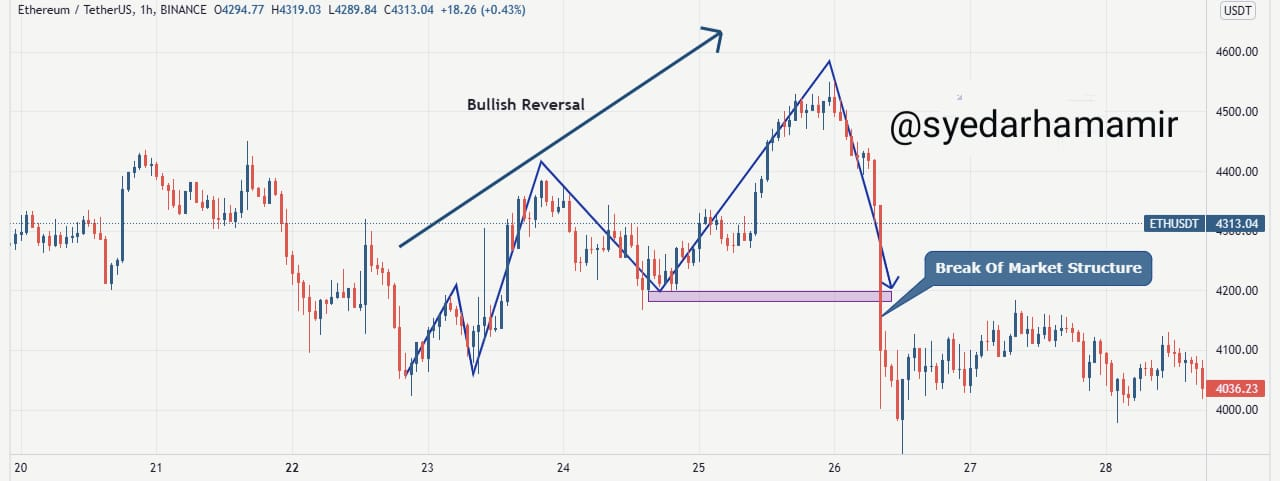
Price is unable to produce a higher bottom on the 1-hour ETHUSDT graph above. Furthermore, the structure's latest low point extends beyond the preceding low point, which is where the arrow stops. The new low can't be less than the prior low in a positive market structure. As a result, the continuing pattern is broken, resulting in a downward trend reversal.
Market establishing lower highs and lowering lows is indicative of a negative trend. Price needs to make lower highs and lower lows than the preceding highs and lows. This is a sign that bears have taken control over the market and are forcing prices down. Fails to achieve lower highs as well as lower lows implies that bears are losing market power to bulls. Let's take a look at a negative market structure breach that led to a negative to bullish reversal in the chart below.
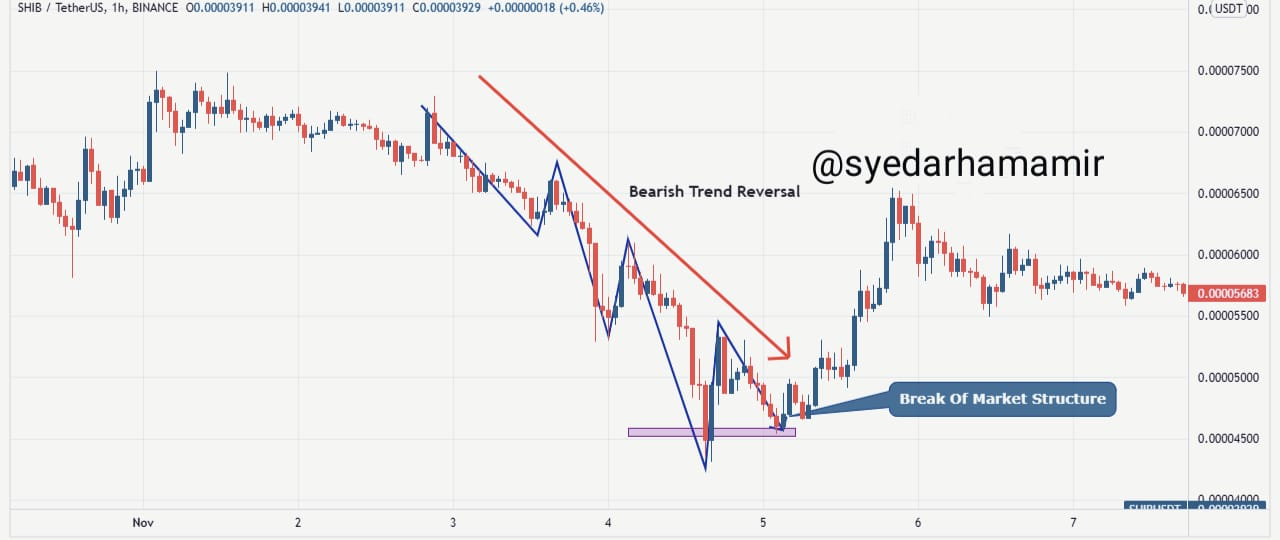
Throughout the 1-hour SHIBUSDT graph above, price is struggling to establish lower lows. If market makes a greater low than the preceding low, the bearish structure is broken. This signals that bulls are regaining control over the market and that a reverse to the upward is imminent.
We studied how to utilise trendlines to assess trend continuance in prior courses as well. We have two trends because there are two tendencies. Below the price movement, a positive trendline is formed, joining two low points that function as support. A negative trendline is formed above price action and connects two high points that function as resistance. Price bounces off of these line graphs, but when it breaches either the bullish trendline's support or the bearish trend line's resistance, a reversal in the opposite direction is inevitable. Let's take a glance at some trend reversals that have occurred as a result of a break in the trendline.
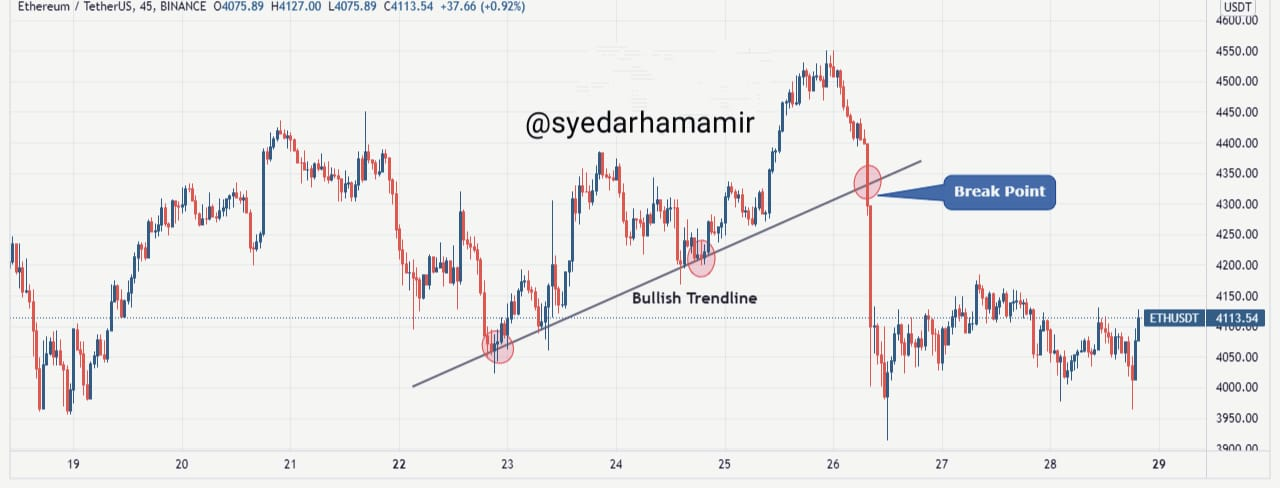
Inside the 45-minute ETHUSDT graph above, price breaches the bullish trendline, indicating that it is about to turn in the other direction. The positive trendline is a flexible support underneath price movement that price rebounds off of, and a break below it signals a potential rebound to the negative. The above graph shows a positive to bearish reversal.
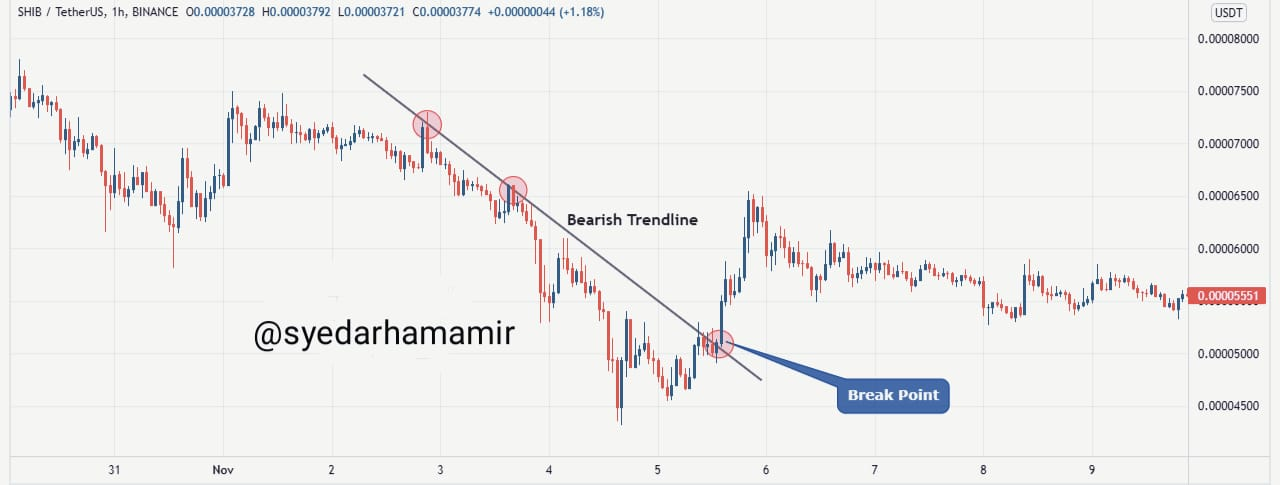
The 1-hour SHIBUSDT graph demonstrates price breaking through the bearish trendline and moving upward. The negative trendline is established as dynamic resistance over price action, which price rebounds off of, and passing it indicates a trend reversal is on the way. A bearish to positive reversal may be seen in the chart above.
Simply said, a divergence is a lack of agreement or lack of convergence among price action and technical indicators. When there is a divergence, the price and the technical indicator go in separate directions, contradicting one another. For example, price may make higher highs, indicating a bullish trend, while a technical indicator may make lower lows, signalling the opposite. A positive divergence as well as a bearish divergence are the two sorts of divergences.
Bullish Divergence
Price produces lower lows throughout a bullish divergence, but our technical indicator opposes price action by hitting higher highs, indicating that selloff is receding and buying pressure is growing as bulls strive to seize control of the market. This alerts traders to the possibility of an upward reversal soon before for them to establish buy positions to purchase assets at a lower price to sell in gain when the reversal occurs.
The RSI implies high lows as the market makes lower lows inside the 4-hour XRPUSDT graph above. This shows a lack of convergence, indicating that a trend reversion to the upside is on the horizon. This is something we really see happen after the divergence.
Bearish Divergence
Our signal creates lower lows, suggesting that buying momentum is weakening while sell pressure is growing as bears seek to gain control over the market. This indicates that a trend reversion to the downside is approaching, and traders utilise the indication to withdraw in gain before the downtrend starts, as well as to plan methods to benefit from the downturn.
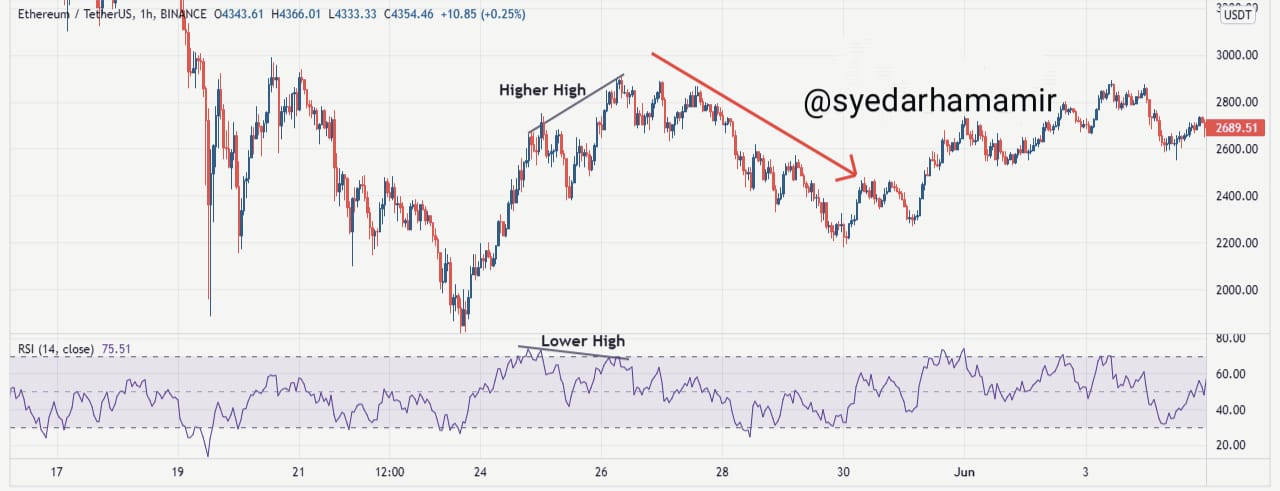
The price action and the RSI are at odds inside the 1-hour ETHUSDT graph above, as the RSI produces lower highs while the price reaches greater highs. This shows that buying pressure is waning and selling pressure is increasing, indicating that bears are gaining control of the economy and a positive to negative reversal is near.
Price must obtain high highs for a positive trend continuance to be legitimate, and lesser lows for a negative trend continuance to be valid, according to market structure. Price is impossible to make highs or low points when double tops and bottoms occur. As a consequence of price hitting a first new peak or low, and then attempting but failing to achieve it again, double top as well as double bottom conformations occur.
Double Top
The use of double top structures is becoming more popular. After a pullback, price tries but fails to create a new peak higher than the prior high on the double top structure. This signals a strong reversal to the negative by breaking the marketplace for a bullish trend. A double top indicates that buyers are failing to generate sufficient purchasing pressure and are losing ground to sellers. It is a powerful positive to negative reversal signal that enables traders to short assets in gain before the negative reversal occurs.
Market must not breach above the prior high point, since this would indicate a continuation of the bullish trend, invalidating the double top pattern. In order that the double top formation to be acceptable, its target price of a second top should not be greater than the peak place of the first top.
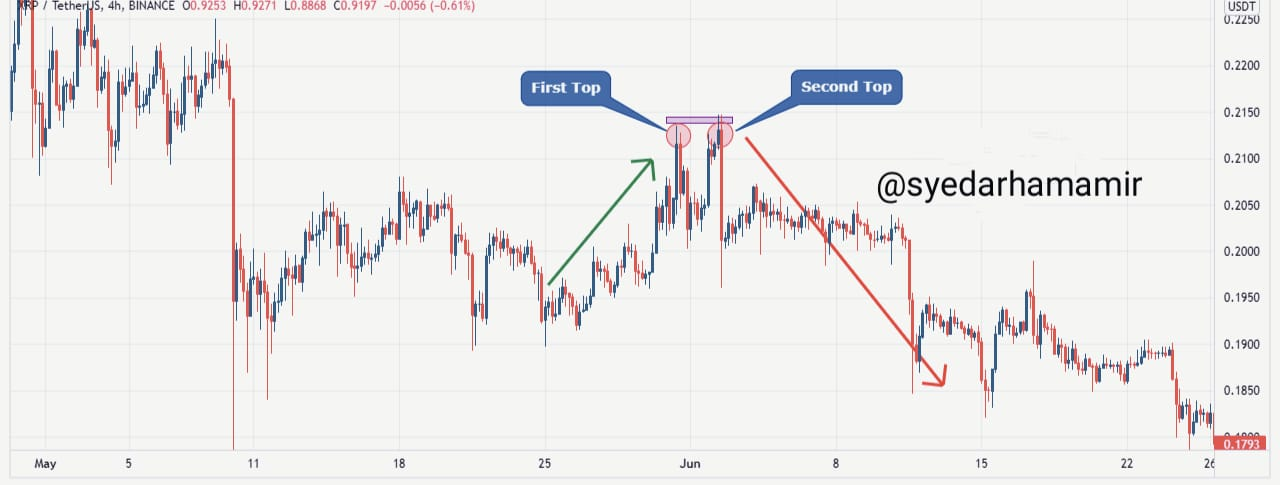
A double top pattern could be seen on the 4-hour XRPUSDT graph above. When price makes a first top, it efforts to reach or surpass the high of that top by making a second top, that is unable to surpass the first peak. Because buyers are unable to drive price higher due to insufficient purchasing pressure, it is a powerful positive to negative reversal indication.
Double Bottom
The market of the bear market is compromised in the Double Bottom when price makes a lesser low and fails to break it. This suggests that sellers are losing market power to bulls since they are unable to generate sufficient selling pressure to maintain driving price down. It is a powerful negative to positive trend reversal, enabling traders to establish long positions for a low price and sell when the expected upward reversal occurs.
Market must not go underneath the previous low point, since this would indicate a continuation of the negative trend, invalidating the double bottom formation. For the double top formation to be legitimate, the target price of a second bottom should not be less than the historical low of the first bottom.
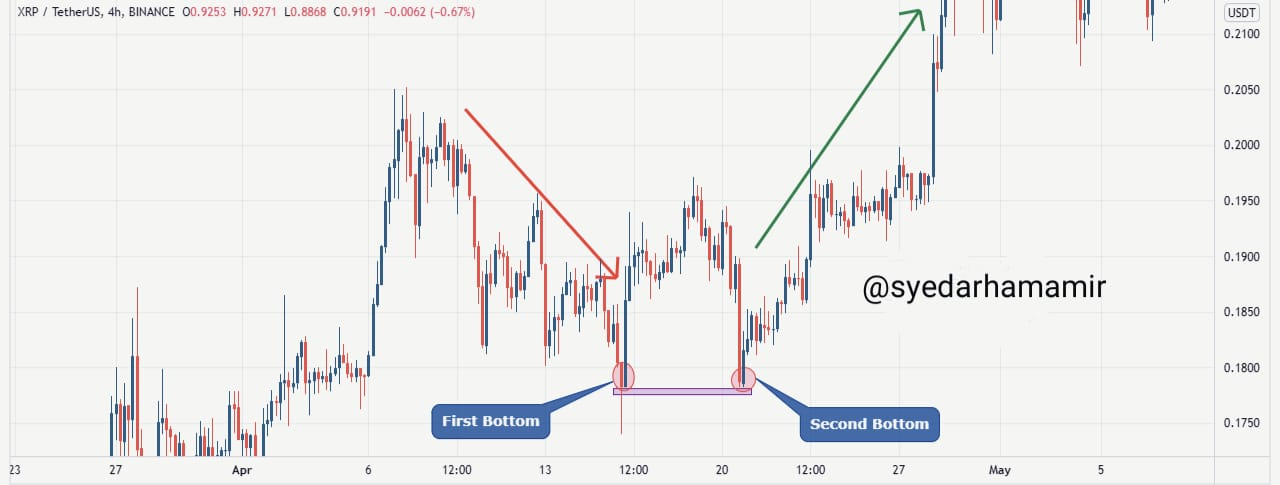
Price movement makes the first low bottom inside the XRPUSDT graph above, then seeks to build a lower bottom but fails, resulting in a second bottom that is not as lower as the first. This suggests that bears will be unable to maintain sufficient selling pressure to drive price lower, and a reversal will occur.
3. Place a demo trade using any crypto trading platform and enter a buy or sell position using any of the above mentioned trend reversal/continuation pattern.
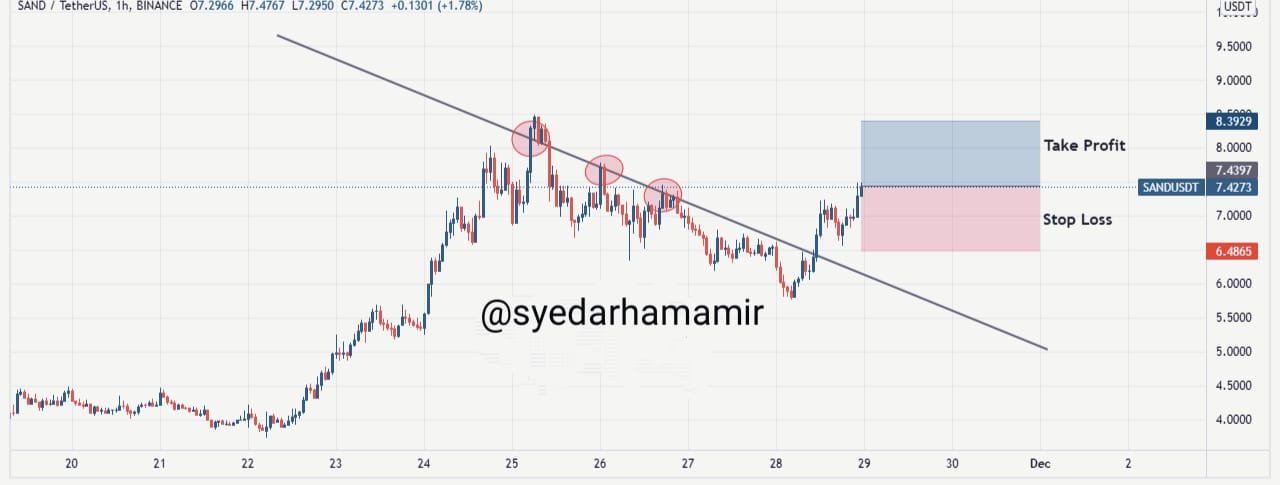
The trend line pattern has broken on the 1-hour SANDUSDT graph above, and a trend reversion has been detected whilst it's still early. Market has been unable to produce low lows and instead produced higher highs, indicating that bulls are gaining control of the market and a bearish to positive reversal has occurred.
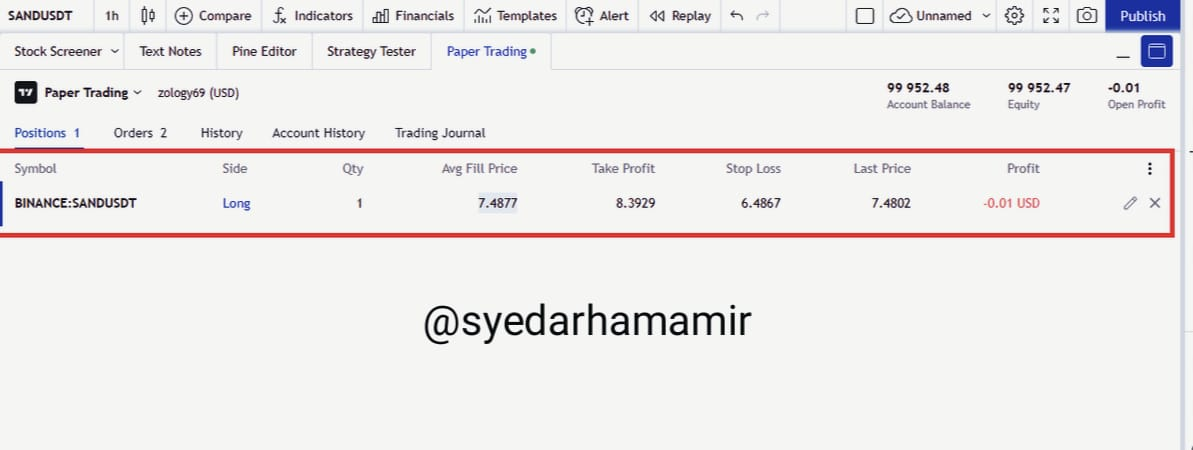
I open a long trade with a stop loss at 6.4867, just a touch below a recently broken support level, after seeing the trendline break suggesting a bearish to bullish turnaround. Being in a 1:1 Risk/Reward ratio with my stop loss, I placed my stop profit at 8.3929. My evidence of transaction is shown below.
Learning to recognise trend continuation patterns is just as crucial as learning to recognise trend reversal patterns. It's really fairly simple since we already know that invalidating a continuation pattern causes a reversal. Thanks to Professor @reminiscence01 for teaching us an amazing lesson.
Hello @syedarhamamir, I’m glad you participated in the 3rd week Season 5 of the Beginner’s class at the Steemit Crypto Academy. Your grades in this task are as follows:
Unfortunately, you have directly copied your work from another user. Plagiarism is a great offence in Steemit platform. We only encourage users to publish original and quality contents.
Original content from :
https://steemit.com/hive-108451/@zology69/understanding-trends-ii-crypto-academy-s5w3-homework-post-for-reminiscence01
Cc: @endplagiarism
@sapwood
Thank you so much Professor!
Your post has been found guilty of plagiarism.