[Leading and Lagging Indicators] - Crypto Academy / S4W4- Homework Post for @reminiscence01 | By @syedmraza01
Hello and greetings fellow steemians, In this post I am going to write a homework post about leading and lagging indicators and this assignment is given by professor @reminiscence01. I hope that you will like it so let's get started.

Question 1: Explain Leading and Lagging indicators in detail. Also, give examples of each of them.b) With relevant screenshots from your chart, give a technical explanation of the market reaction on any of the examples given in question 1a. Do this for both leading and lagging indicators.
Leading Indicators
Leading Indicators are usually used to know the future movement of any asset or commodities. They are of many types and uses economic data to predict the upcoming trend of the market. This really help traders to catch the path earlier before a new trend set up so that they can either get maximum profit or minimum loss. Here's an example of BTCUSDT.
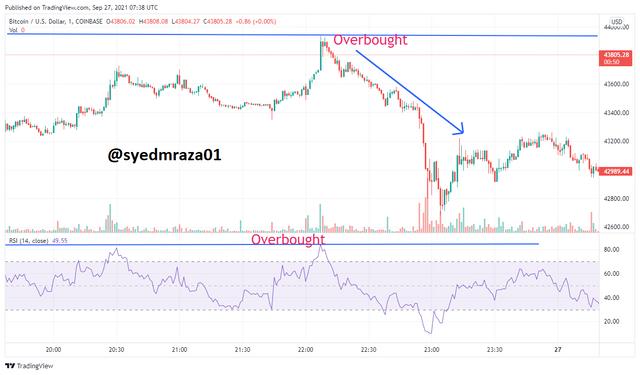
As you can see in the above picture that after reaching overbought region RSI indicator indicates the change of trend. We guessed that it is the overbought region because before that certain point there was another overbought zone same to this height. So if trader got the leading indicator right enough, he can get much profit in his future trading.
Lagging Indicator
Lagging Indicators uses past price movement, past projects of assets and overall calculations of an asset to provide a decent point for a trader. Lagging indicator is also took on a contrast of leading indicator. As it sounds from its name that this indicator indicate the price movement after a certain lag. This occur because it confirms the trend of market or it also confirms the signal of leading indicator due to which it is highly recommended to use lagging indicator with leading indicator. As you can see in below chart,
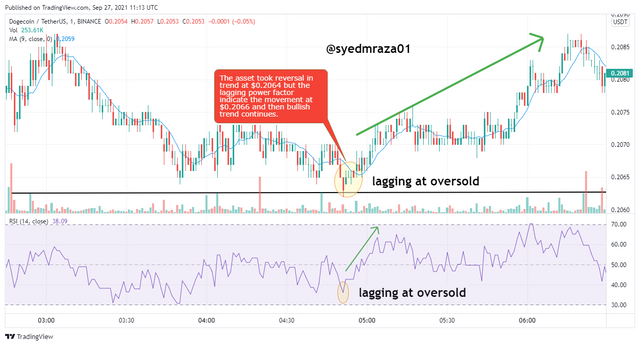
In the above chart the price motion of Dogecoin is reversed at $0.2062 but lagging indicator showed it after he got it's rhythm and that's exactly the work of lagging indicator to confirm the movement of chart because after that the asset took a strong bullish trend.
**Undertstanding about strategy:
First, we should be aware of our entering and exiting points like how much profit we want. The other thing is the use of indicator, indicators is recommended to get used in pairs for best result. While using an indicator we should know about the settings that either the settings of the following indicator is in accordance with our strategy.
Understanding the trends
When following the trend, the trader must have to select the indicators that follows trend signals such that Moving averages, average directional index (AD), Ichimoku Kinko Hyo are the indicators that use trend to predict the flow of market.
Understanding type of Indicators
As we discussed above there are many types of indicators working on several principals. So at the time of trading first we have to ensure that if we are following a leading or lagging position and after that we could use any indicator which reflects our strategy, market and trend.
Explain confluence in cryptocurrency trading. Pick a cryptocurrency pair of your choice and analyze the crypto pair using a confluence of any technical indicator and other technical analysis tools. (Screenshot of your chart is required )
Confluence
Confluence may be described as the level at which multiple signals arrived like supports or resistances all are appearing at a continuous point.
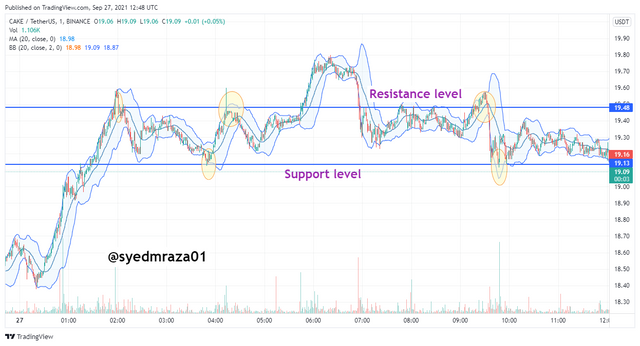
In term of defining confluence, I use this chart of CAKEUSDT and in this chart I have pointed out many points on resistance and support levels that defines confluence. As you can see that there are many points one by one on resistance level and Bollinger bands line are also in between the resistance and support levels this indicates that through confluence we can easily increase the effectiveness and accuracy of our indicators in gaining the right answer.
However, on support level the Bollinger bands line touched again and again but remains in between the two lines. the price of the asset started to rise in the start and begin to fall in the end of this line.
Explain how you can filter false signals from an indicator
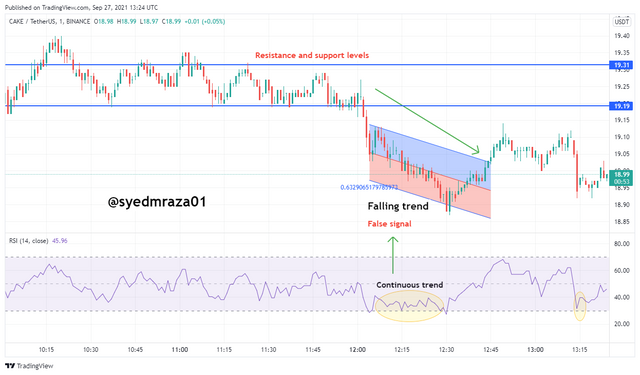
Through the above chart we can filter false signal by using RSI indicator as you can see that when price falls the RSI shows very little and continuous low in chart, this is because sometimes the value of RSi is too powerful that it cannot reverse through the asset movement. Confluence can also be seen in this chart that before bearish trend starts the price is in between resistance and support level. So by using perfect match of technical indicators we can eliminate false signals easily.
Divergences are generally of two types; Bullish Divergence and Bearish divergence. Divergence can be found out by a difference in indicator and chart arrows in real time. Bullish Divergence means that now market is going to follow the up trend or positive trend, however, In Bearish divergence market will going to follow downtrend or negative trend.
Bullish Divergence
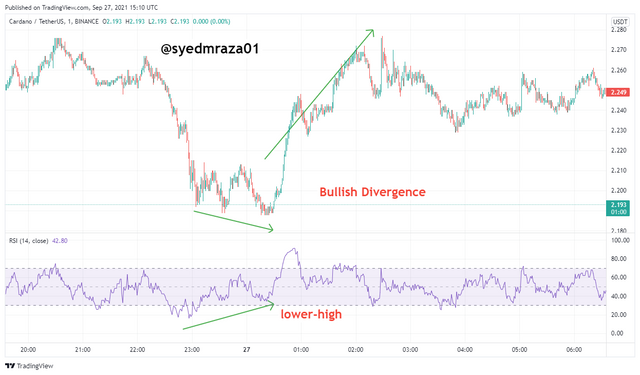
This is the chart of ADAUSDT and we can see that in the chart the price of asset is falling at a point but at this exactly same point RSI indicator shows the lower-high region which indicates the price of asset will increase whereas it shows the lower-lows, however, after this the market put on the uptrend and the price of asset increased. This shows the bullish divergence in market.
Bearish Divergence
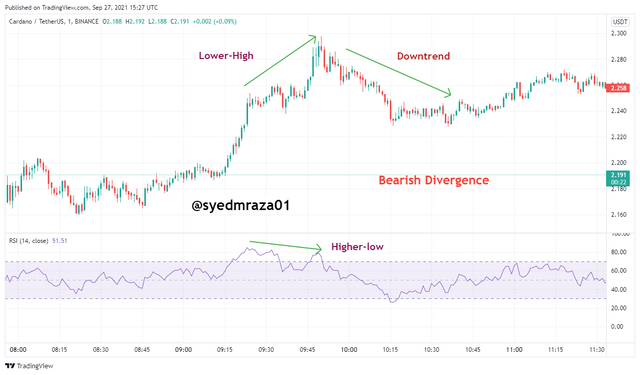
In this chart of ADAUSDT the chart gives the lower-high point and the price is increasing with same pace but at that point the RSI indicator shows the higher-low point which indicates a bearish divergence in the market and after its highest point the price of asset started to fall and downtrend started.
Through above mention points we got that Bullish and Bearish divergence is another tool to help us out in the trading and it can also filter some false signals easily but it is not always right and sometimes traders have to face loss due to this that is why it is recommended to use pairs of indicators for better accuracy.
Conclusion
In conclusion, I have to say that due to the enormous volatility in the crypto market, traders must have to aware about the essential technical analysis tools. This will only possible when the trader have basic knowledge of indicators, divergences and trends. Technical analysis can never be 100% accurate but it will open chances to get more benefit from the trade. Traders can only achieve their goals when they did technical analysis in a firm and controllable environment.
That's all from me, Thank you to @reminiscence01 and @cryptoacademy for this course because it is really helpful for us.