Steemit Crypto Academy Season 5 Week 1 [Beginner's Course] - Understanding Trends

a)
Trending Market in Crypto:
A trend is said to be the orientation or the way in which the market is expected to move. The trending market occurs when a change in price continues to flow. The change in the market whether it be lower or higher is not explainable but it is mainly dependant on two main factors
- Demand
- Supply
When there is an increase in demand you would see an upward trend (also known as a bullish trend) but when there is a rise in supply you would see a downward trend (bearish trend)
There are also other factors but the two main factors are demand and supply
b)
BULLISH TREND:
The bullish trend is an overall upgrade value of your money or product which is in our case is crypto. The main point to remember is that not only new high value is exceeding your previous high value but also it also crosses your previous low value. Sometimes bullish trend also refers to the recovery of the economy.
BEARISH TREND:
The bearish trend also works in a similar way but for the opposite outcome, as it is an overall downgrade of the product. In this, we tend to see that the crypto is downgrading in a similar path as of bullish trend.
Explain the following trend identification and give an example of each of them. (Original screenshot needed from your chart). Do this for a bullish and a bearish trend.
MARKET STRUCTURE:
FIGURE 1
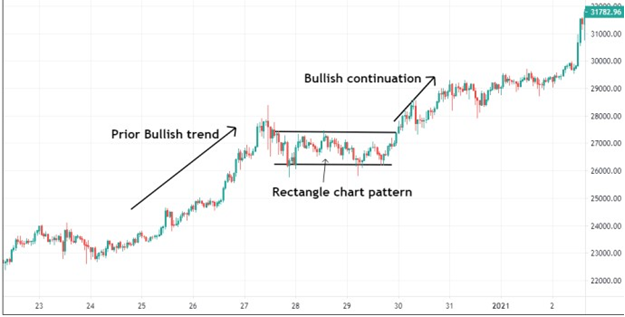
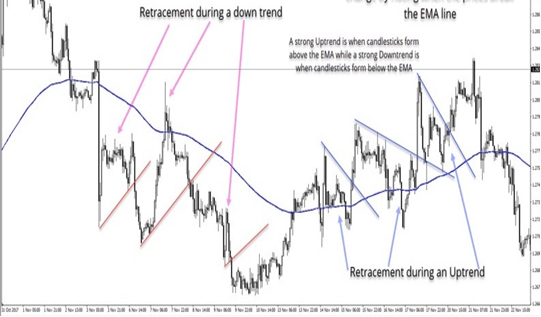
Here we have a chart which is following a bullish trend. A market structure is used by traders to understand or analyze the current situation of the market.
A market structure follows three states
Bullish Trend:
In Simpler words, we can say that a market is following a bullish trend or in a bullish state when your time value of money is increasing. In other words, we can analyze an upper inclined state in a chart as shown in figure one.Ranging phase:
A ranging phase is formed when a chart is not keen to set a new high or a new low (which can easily be seen in figure 1). It means that a chart is in a hibernation state and usually forms a rectangle shape on a chart.
In this phase, your low is known as support whereas your high is known as resistance.Bearish Trend:
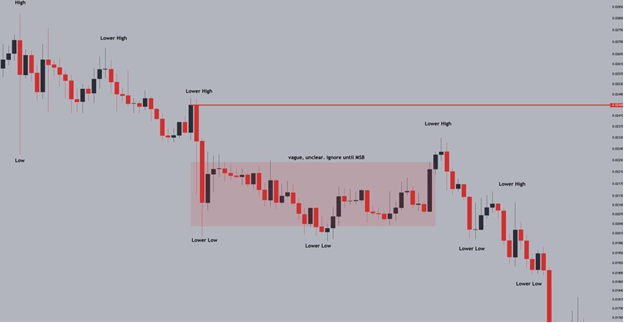
A bearish trend occurs when the market or a trend follows a downgrade inclined pattern. In other words, we can say that the market is unable to achieve the previous high. The pattern which is made can be seen in figure2.
FIGURE 2
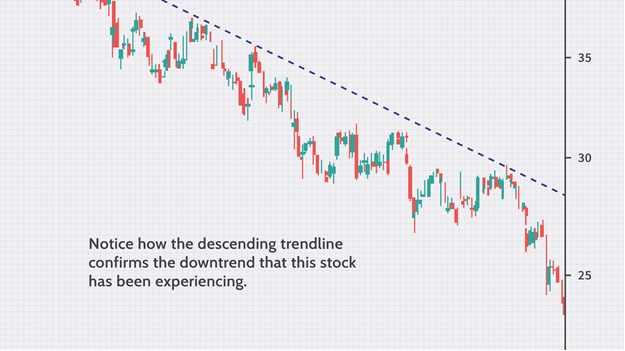
TRENDLINES:
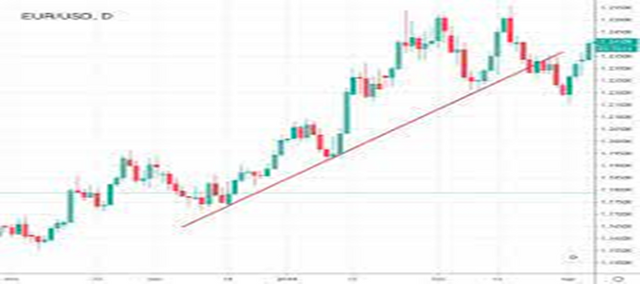
The trend line is also an amazing tool to predict the state of the market or its direction where it is keen to go whether the price of it will increase or it will decrease in its current state.
The procedure of it is very feasible. You simply have to draw a line using two low points of an uptrend (BULLISH TREND). You can further understand by the following figure understand by the following the figure
Source
Similarly, for a bearish trend, you can draw a line by choosing two high points and you can analyze the current situation of the market.
Explain trend continuation and how to spot them using market structure and trendlines. (Screenshot needed). Do this for both bullish and bearish trends.
TREND CONTINUATION
Trend continuation is simply a steady continuous phase. In other words, it will follow a constant inclined line whether in an upward direction or lower one.it just originates in the middle of the trend and indicates that the trend will most likely resume once the pattern is completed.
Traders often analyze the pattern with the use of market structure and trendlines.
Source
BY MARKET STRUCTURE:
In the above figure, we can see a trend that is following all three different phases of market structure (that is bullish, bearish, and ranging phase).
There are two keen points to take understanding in a bullish and bearish trend
- In a bullish trend, your new high should be greater than the previous high and the same goes for your lower one
- In a bearish trend, your previous high should be higher than the new high, and also your new low should be greater than your previous low.
If the trend does not follow the above condition, it means your trend is weak and it will undergo a reverse.
BY TRENDLINES:
As we know that trendline is an amazing tool to predict the state of a trend.
As you can see in the figure above that a trendline is drawn on high points of a bearish trend, the point to note is that after touching the trend line it is creating a new high point(lower than previous high point)
NOTE: Similar thing will happen for a bullish trend but in the opposite manner.
Pick up any crypto-asset chart and answer the following questions -
i) Is the market trending?
ii) What is the current market trend? (Use the chart to back up your answers)
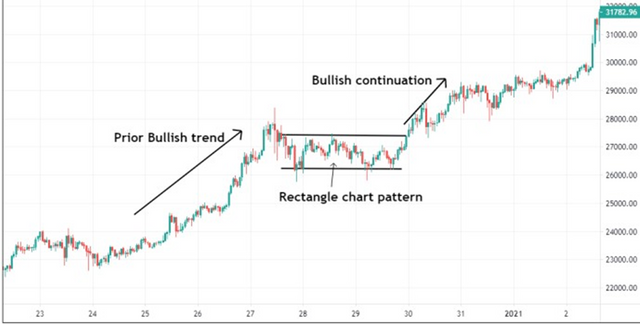
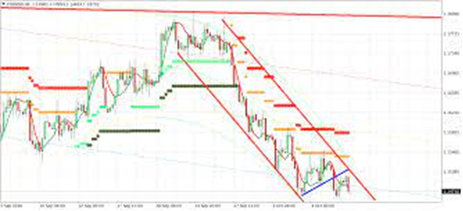
Let’s analyze the above picture
- It is following the upper (bullish trend) but there is a weak link that creates a ranging phase but when the pattern is completed, the trend again continues.
- The current market trend is bullish which means that its value will increase.
Conclusion
The Crypto market is not only a game of value going up and down but it is a more complex study of charts.
In a nutshell, we can say that to survive in a crypto world you should have a better understanding of trends and future placement of a trend. If you don’t have an understanding, it will be very difficult for you to earn from it.
The understanding trend will not only give you the current value of charts but by studying it, it would be very easy to analyze and predict the future value of the product.
Hello @syedmraza01 , I’m glad you participated in the 1st week Season 5 of the Beginner’s class at the Steemit Crypto Academy. Your grades in this task are as follows:
Recommendation / Feedback:
Thank you for participating in this homework task.