[TECHNICAL INDICATORS] - Crypto Academy / S4W2- Homework Post for @reminiscence01 | By @syedmraza01
Assalamualaikum,
Hello fellow steemians, In this post I am going to describe briefly about Technical indicators and their types and uses. This assignment is given by Professor @reminiscence01. So let's get started,

Question 1: TECHNICAL INDICATORS
Introduction:
It is completely based on statistical review of product, its price and market volume. It helps to give short trading signal based on past price volumes, supply and demand of product. It can also be determined by evaluating charts and graphs following the price trends.
- Technical indicators helps in providing the complete overview of market value of asset. If technical indicators are not there it will becomes difficult to find the movement of market because candles or a simple chart can sometimes doesn't help enough.
Technical Indicators Good For Crypto Market?
Crypto market is very volatile and it pump and dump in no time so in order to keep a promising check on prices technical indicators are used. Another important thing is that all the technical indicators are based on some pure mathematical calculations which indicates the market evaluation by providing a signal line. Although there are other analysis techniques also but in a rigid market you cannot use fundamental analysis or others because their is no rumors in there. So at that critical time technical indicators help us to examine the movement of market.
How To Add Indicators?
- First of all you have to access any trading website like Binance, Trading view etc.
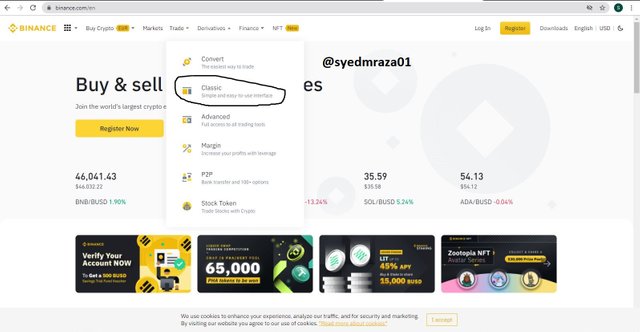
- I have chosen Binance.com to show the process.
- I have searched Binance.com on google and then above picture has appeared on the screen.
- Then put your arrow on Trade and a drop down will appear where you choose Classic option.
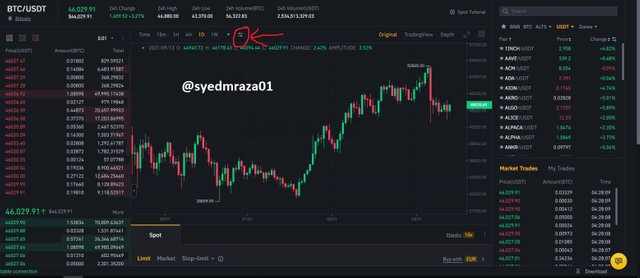
- After clicking Classic, a screen will appear as shown in above screenshot.
- Then you click on Indicators option( highlighted by an arrow).
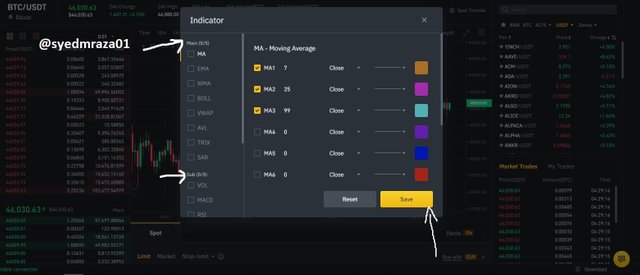
- When you click on indicators option a popup will appear on screen.
- In which all the indicators are present.
- In general, indicators are of two types
- Main or Overlay indicators.
2)Sub or Oscillator indicators
- You can choose any of the indicators individually or with pairs of main and sub together.
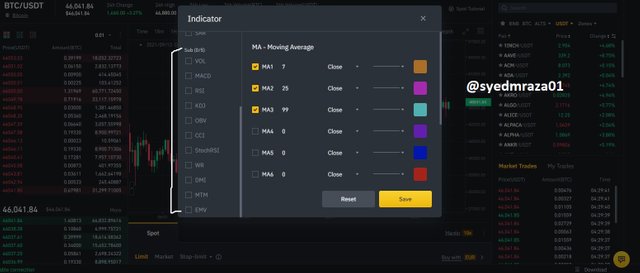
- When you scroll down their are more other sub indicators will appear.
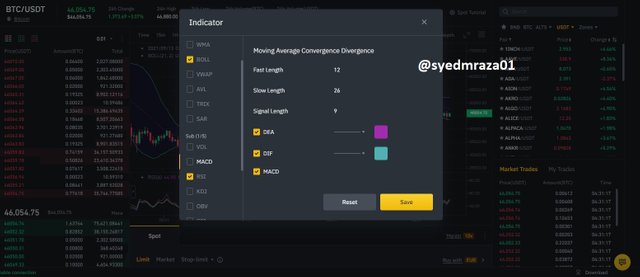
- You can choose any of the indicator as per your requirement.
- I chose Bollinger Bands(BOLL) as main indicator and RSI as sub indicator.
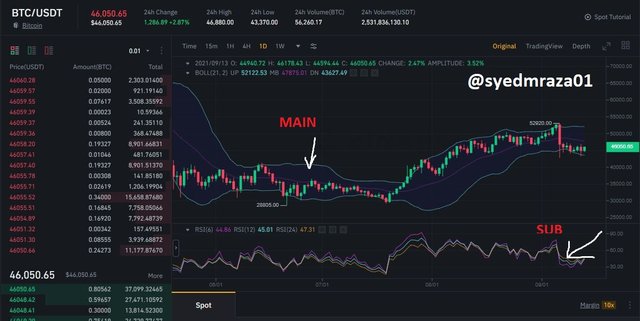
- You can see that BOLL indicator appear on the stock chart because it uses same scale as the top chart uses.
- Below RSI indicator appeared separately because it uses to oscillate between a local minimum and maximum which are plotted above or below a chart.
Categories Of Technical Indicators
Indicators falls into four basic categories:
- Trend based Indicators
- Momentum based Indicators.
- Volatility based Indicators.
Trend based Indicators
Trend is the easiest part to identify on a chart but hardest to know without technical knowledge of the graph. Trends used to describe the way in which market is heading, either it is downward or upward, bearish or bullish.
But without indicators it is not easy to identify the direction so different indicators like Moving averages, average directional index (AD), Ichimoku Kinko Hyo used to infer the market trends.
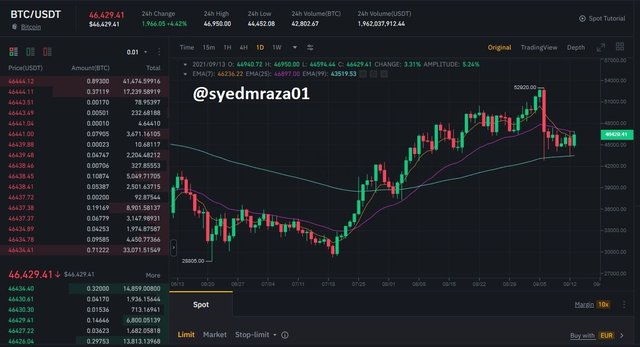
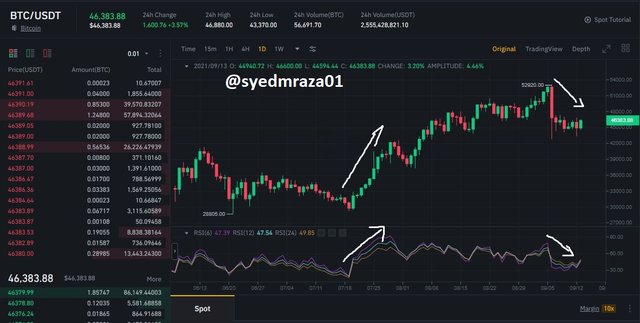
In the above picture you can see that I used a Exponential moving average (EMA) which is very common among traders. It shows the movement of market i.e trend swings and you can see that a thin orange line continuously follows the path of chart, through which a trader predict the upcoming trend of market.
Momentum based Indicators
Momentum based indicators uses to mark the overbought and oversold regions of the market, they produce best result when they used with any other indicator because they don't specify the direction of market but shows the change in price either positive or negative in a specific timeframe.
RSI indicator is shown in the above screenshot. RSI indicator shows the price evaluation between 0 to 100 and uses hourly time frame to capture the movement of market, you can change the time frame as per your analysis. RSI indicator capture the momentum of price by measuring the magnitude of the price and then evaluate the overbought and oversold regions, through which a trader can determine the flowability of the market.
As you can see in the above screenshot whenever the price of asset increases the RSI indicator also suggest the rise and same for the downtrend, the sharp edges at the top and bottom of indicator shows the variability of trends.
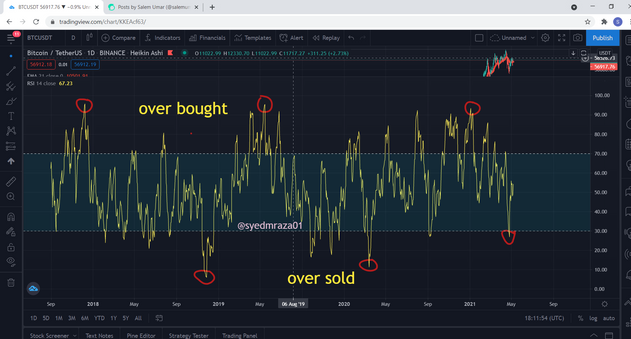
As we can clearly identify the overbought and oversold regions through RSI and also the movement of price in between these regions. That can help us to trade in a suitable manner and regions specify us the price movement in a controlled time frame.
Volatility based Indicators
Volatility refers to the value of asset far from its mean point. The volatility in crypto market is found by finding difference in the supply/demand gap and the number of orders executed. Greater volatility means that there are high chances of price goes upward and traders can take profit of it.
Volatility Indicators helps in identifying the buying and selling zones through calculating the fluctuation in price of the asset.
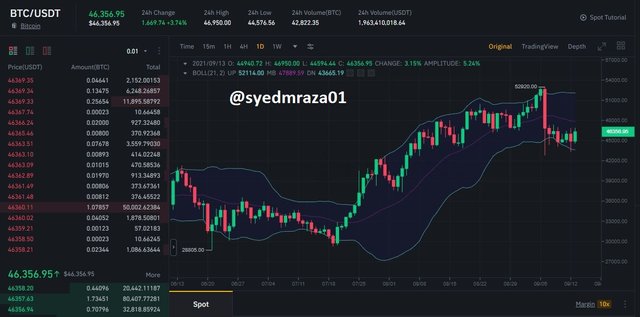
Here's Bollinger Band (BOLL) is used as a indicator and you can see that whenever volatility in market increases the gap of two lines from bottom lines also increases. This represents the better view of market.
Briefly explain the reason why indicators are not advisable to be used as a standalone tool for technical analysis.
Well, all the indicators are based on some specific calculations and they are never 100% correct or give every time a perfect result that's why lag in indicators occur. So a trader have to keep his eyes open when trading and it is always appreciating and advising that in technical analysis we must have to select more than one indicator or set ourselves on a pair of indicators to get better result and to avoid any huge loss.
Explain how an investor can increase the success rate of a technical indicator signal.
In order to increase the success rate high, the trader must have to mastered him in one or two technical indicators.
Secondly , he must have to choose a specific time frame suitable for the indicator in order to avoid lagging.
Thirdly, instead of using technical indicators individually, the trader have to to use atleast a pair of them to increase the rate of succes.
CONCLUSION
Concluding the above written I can say that technical indicators are a very essential part of trading and proves to be a helpful tools but if we want to get maximum result we have to first learn the way in which technical indicators work.
That's all from my part I hope that you all like it.
I also wanted to thank @cryptoacademy for these courses and Professor @reminiscence01 for this amazing lecture and their dedication towards it.