Crypto Academy Season 3 Week 7 Homework Post for (@yousafharoonkhan) How to create an account on TradingView, how to use indicators,tools, features of tradingview
This week, the professor detailed the Tradingview website, which is heavily used by traders. It is a tool that any good trader should use before trading. So if you are someone who has not used it yet, I would definitely recommend using it.
Defining the TradingView site and how to register an account in tradingview? what are the different registration plan?(screenshot necessary)
Traders analyze the assets they buy, buy or sell before making an evaluation. They generally analyze assets by choosing fundamental and technical analysis methods. There is a tool that almost all traders use before doing technical analysis, which is the Tradingview website.
Tradingview Inc. It was founded in September 2011. Tradingview does not have a mission of being a brokerage house. Although it includes the analysis of the members, it does not have a role as investment advisory.
It allows traders to analyze, draw on charts and apply indicators to charts. You can easily see the price changes of assets in very short or long time periods.
Although Tradingview is a website established for beginners, it has attracted the attention of corporate companies due to the advantages it provides, and it has been instrumental in popular companies using the platform.
The platform is very easy to use for a beginner, the complexity is pretty much simplified. It is also a very in-depth site with different features for experienced traders.
Tradingview offers a service where we can analyze cryptocurrencies, currencies, stocks, indices, bonds, futures in the market option.
When you click on the Charts section, there are charts for all the assets traded in the market. By making various drawings on these charts, you can get signals about the future and price changes.
The Follower section includes stock tracker, cryptocurrency tracker and Forex tracker.
In the community section, members start to interact with each other and use Tradingview more efficiently.
In the right corner is the Watchlist. Through this watch list, you can instantly see the price changes of the assets you want to own.
For first time users of Tradingview, the free basic plan option is sufficient. After you start using Tradingview more practically and gain experience in the sector, you can turn to other options.
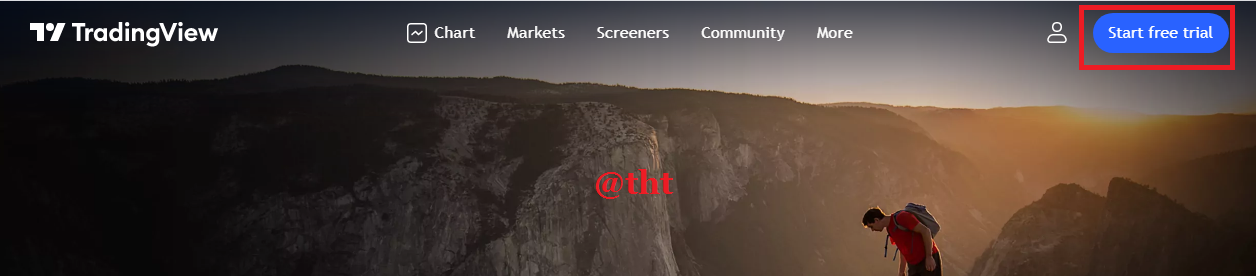
Login to https://www.tradingview.com/. Then click on ''start free trail'' on the top right.
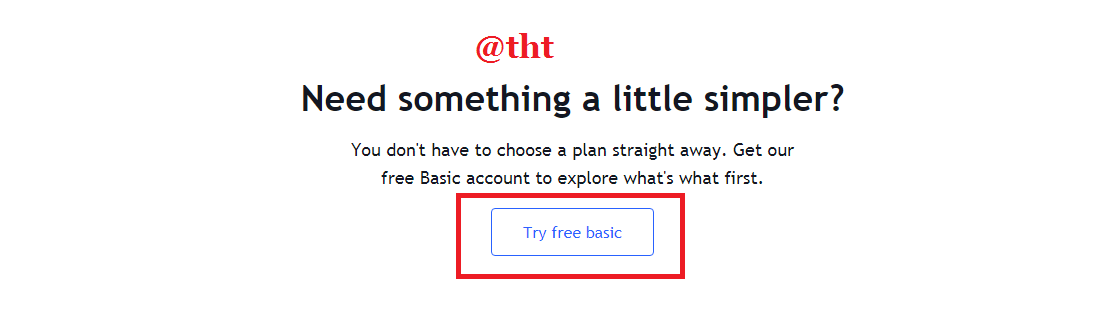
Then, on the new page that opens, lower the page a little. Click where it says 'Try free basic'.
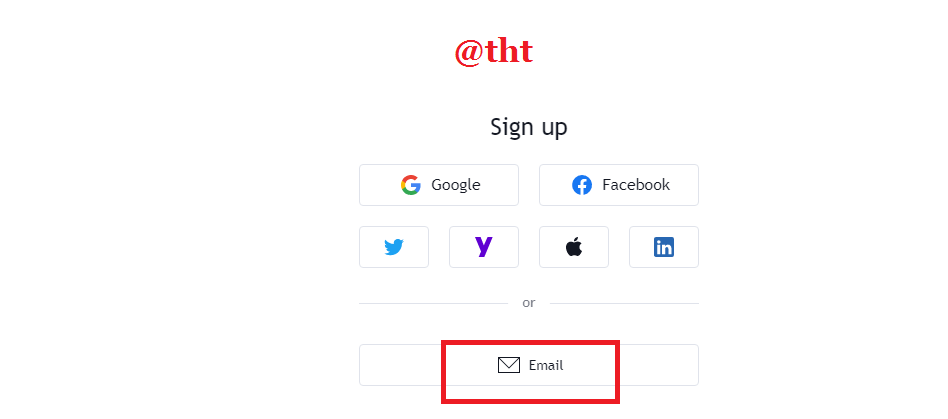
You can start the membership process with many options. You can become a member with facebook, twitter, google, yahoo, apple, linkedin and email. I clicked on Email.
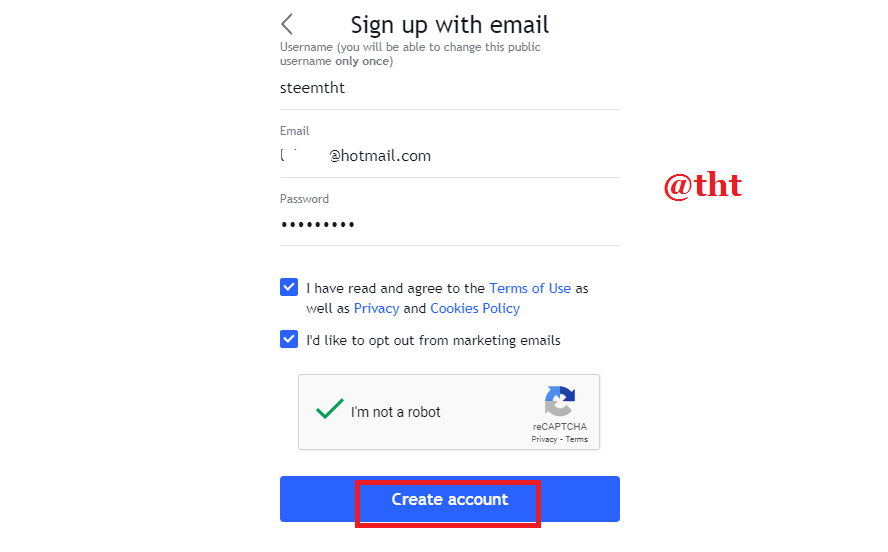
Then I set a username. I entered my e-mail address, determined a strong passport. I accepted the terms and rules. I checked the "I'm not a robot" option and clicked "create acccount".
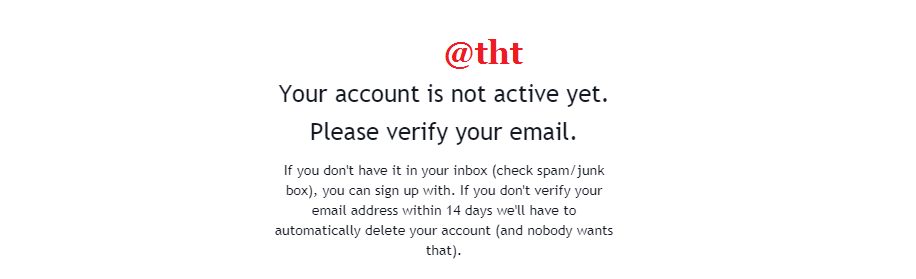
I clicked on the link in my email address and my account was approved.
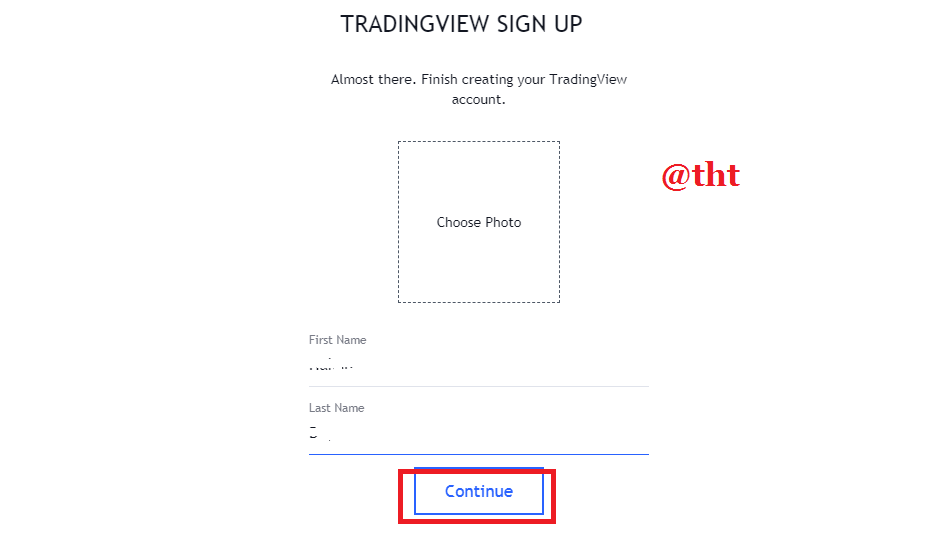
Then I typed my first and last name and clicked continue.
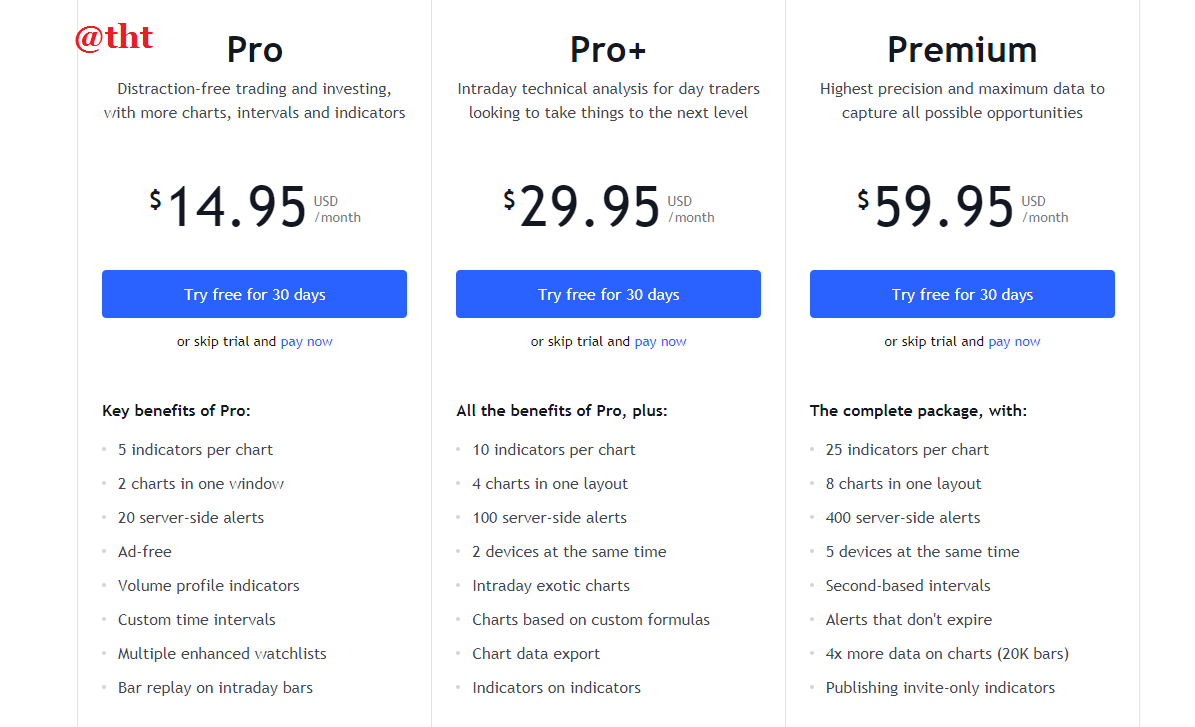
Different registration plans are available on Tradingview. These;
They are The Free Basic Plan, The Pro Plan, The Pro+ Plan, The Premium Plan.
The free basic plan is for newbies to the platform. Despite its many limiting features, I have preferred it for a long time. We apply at most 3 indicators on the graph at the same time.
The Pro Plan is for users with a little more experience. You can take advantage of this membership for $14.95 per month. You can apply 5 indicators on the graph at the same time. You can use ad-free, multiple advanced watch lists and many features in this subscription.
The Pro + Plan caters to slightly more experienced traders. You can take advantage of this membership for $29.95 per month. You can apply 10 indicators on a chart. You can use charts and many features based on special formulas in this membership.
Premium appeals to the most experienced traders. High volume traders use this subscription type. You can take advantage of this for $59.95 per month. You can apply 25 indicators on a chart. You can use non-expiring alerts and many features.

Explain the different features of tradingView and what is your favorite feature and why?(screenshot necessary)
It leverages the features of Tradingview for traders to get better trading opportunities.
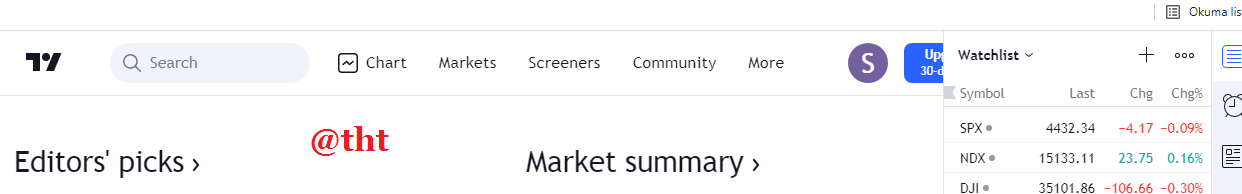
Chart:
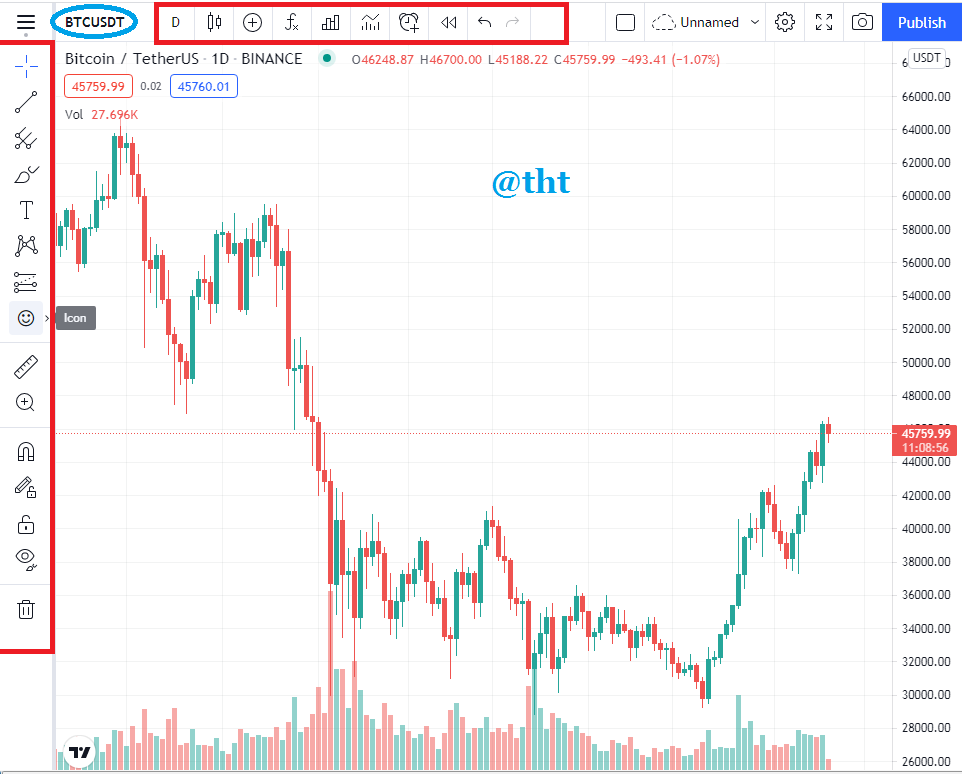
When we click on the "Chart" section on the Tradingview site, an asset's chart is opened immediately. You can change the current graphic by clicking on the place I marked in the blue circle. You can see the chart of the asset by typing the name of the asset in the search box that opens.
On the right side, there are tools required for graphic drawings. You can draw almost at a professional level. At the top, you can determine the time period of the charts and select the indicator you will apply on the chart.
Trade:
In this section, the best brokers are ranked by rating. Currently, the broker with the highest rating is Capital.com with 4.42. Next comes Currency.com. Here, the broker specifies the minimum deposit and similar conditions, rules. You can open accounts with these brokers and learn various trading ideas.
Markets:
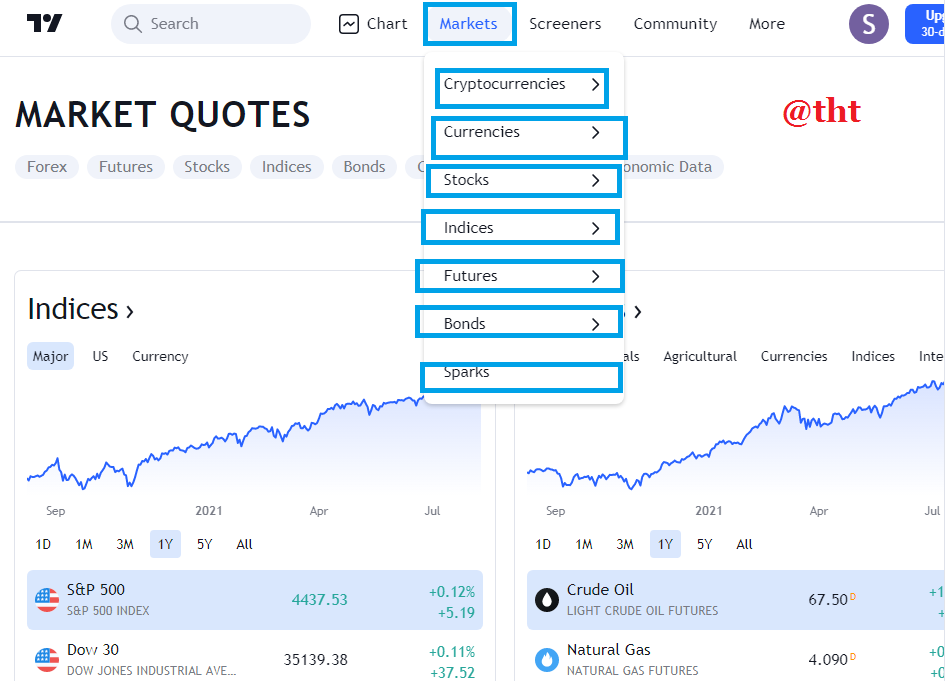
The market section consists of many parts. These; Cryptocurrencies are parts such as currencies, stocks, indices, futures, bonds, sparks.
Cryptocurrencies: When you click here, it shows the most popular cryptocurrencies in order. It instantly transfers the market value of crypto market and other popular cryptocurrencies. There is also a separate section for Defi coins. You can also access the market cap chart and the defi marketcap chart.
Currencies: When you click here, you will see that it is divided into Major, Minor, etc. parts. Here are the currency pairs. For example, the Turkish lira has many foreign currency equivalents. You can also access the charts of these currency pairs.
Stocks: This is one of the heavily used places in the section. It is divided into various parts. There are categories of stocks such as the biggest capital, the most increasing, the most decreasing, the most traded. When you click on these categories, you will reach more detailed information and statistics.
Indices: This section is divided into 4 sections. It consists of major world indices, US indices, foreign exchange indices, S&P500 Index. When you click on them, you will reach very detailed data.
Futures: This section consists of sections such as agriculture, energy, metals, currencies, world indices, bond interests. For example, when you click on the energy, you will reach the prices of the energy-related markets.
Bonds: This part seems to be divided into 7 different sections. When you click on the sections one by one, it is possible to access the graphics and statistics.
Screeners:
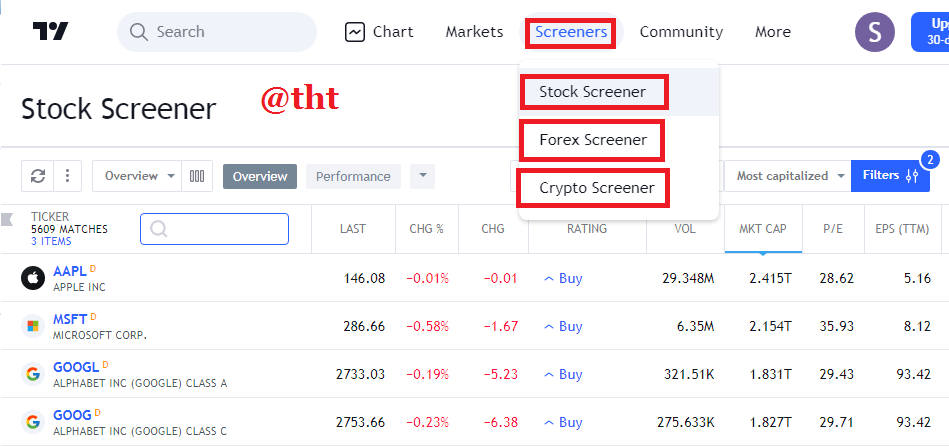
This section is divided into 3 parts. Stock Tracker, Forex Tracker, Crypto Tracker. Here, the assets are listed according to certain values. You can change the sorting by price, alphabetically, etc. by values. In addition, you can search for the asset you want in the search section, or you can sort the assets according to the criteria you have determined by filtering method.
Community:
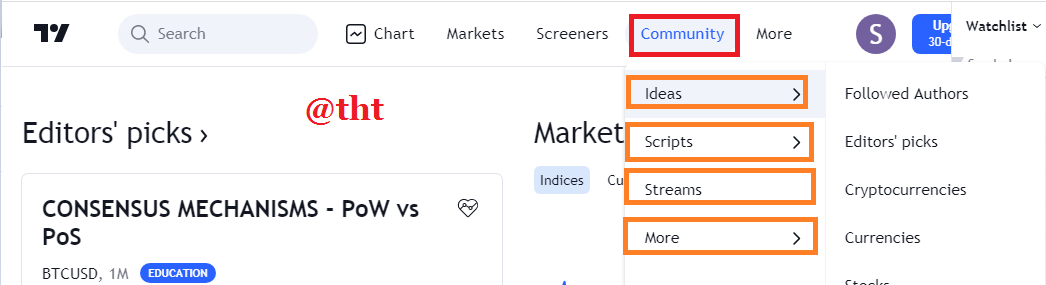
This section is divided into 4 different sections. In addition, these sections are divided into different categories among themselves. In the Ideas section; There are categories like followed authors, editor's picks. By clicking here, you can reach the ideas and thoughts of the authors you follow. The articles chosen by the editor generally consist of the highest quality content from the current and previous periods.
Watchlist
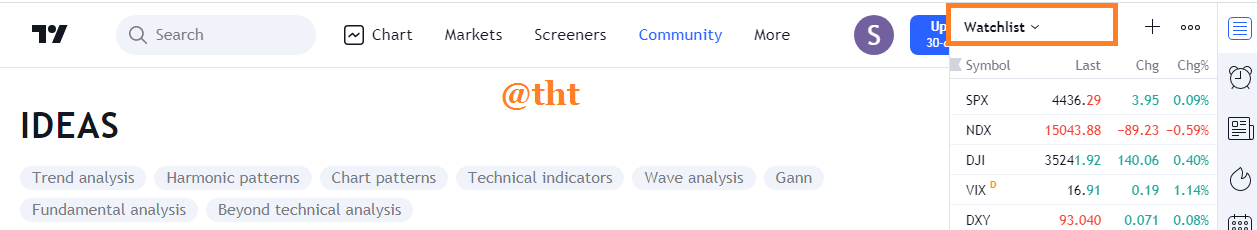
It is located in the upper right. You can instantly learn the current price changes of the assets you want to track.
My favorite and why
The feature I use the most is charts. Therefore, this feature is my favorite feature. I think it is the feature most traders use most as well. If you ask why, it is in the first place at the top. In general, the most used feature on websites is in the first place.
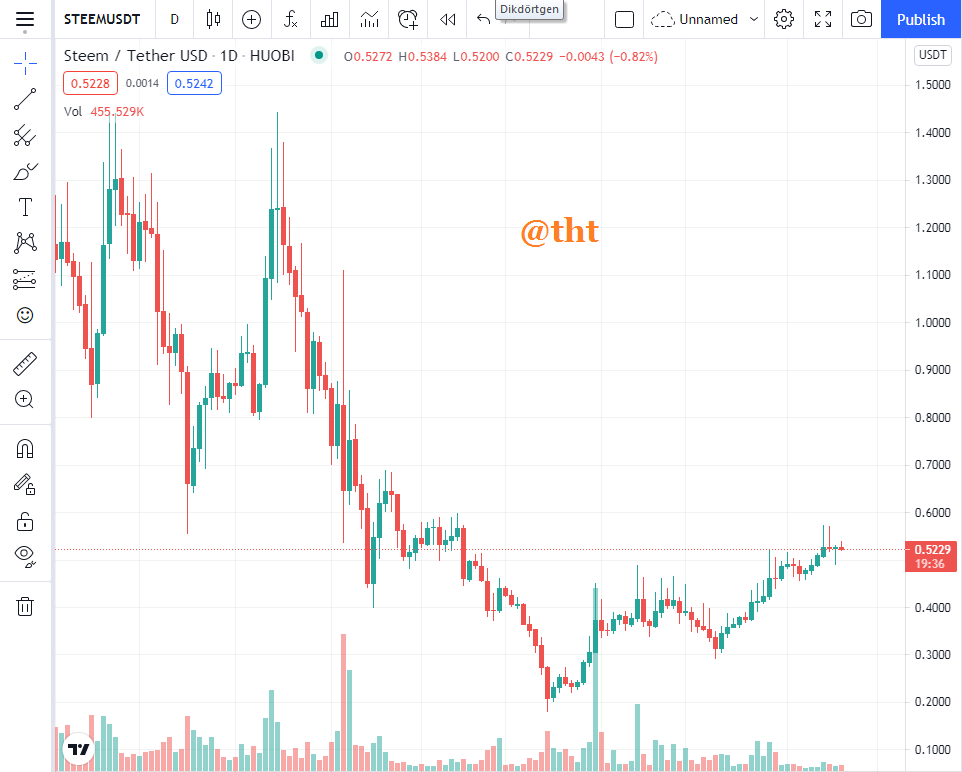
(tradingview Steem /USDT 1D chart)
Now I will explain why it is my favourite. I prefer two analysis methods when analyzing cryptocurrencies. One is fundamental analysis and the other is technical analysis. I use charts for technical analysis. I identify support and resistance levels. I make drawings to read the graph more clearly. I am also trying to get buy and sell signals by applying the indicators on the charts. On the chart, I can see the prices that occur in yearly, monthly, weekly, daily, hourly and minute timeframes one by one.
Tradingview's charting feature helped me a lot.
How to set up a chart in TradingView and use two tools to edit it.(screenshot necessary)
I'm logging into the Tradingview homepage. https://www.tradingview.com/
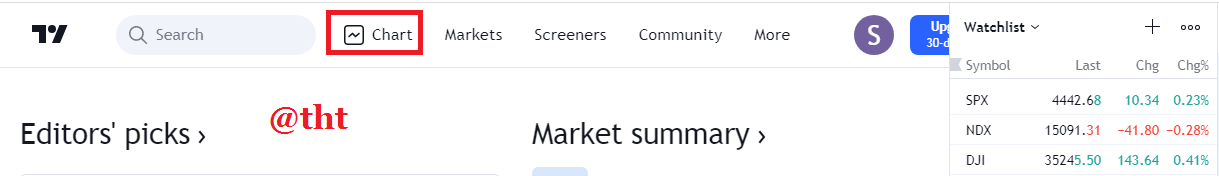
I click on the "chart" in the middle upper part.
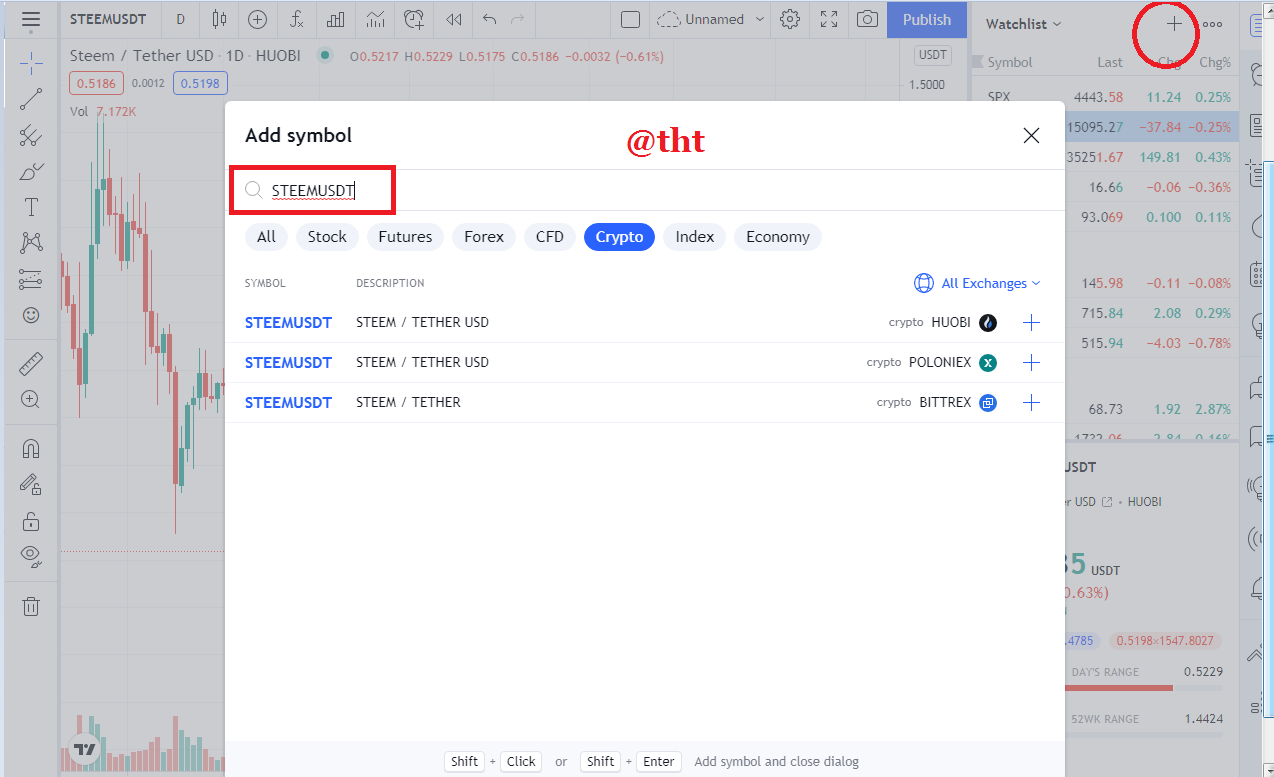
Then I click on the place I marked in the upper right corner. The search section opens. Here I write the name of the cryptocurrency whose graph I want to see. Like Steem/USDT. In choosing this, I also have the freedom to choose the stock market. I usually choose high volume exchanges because I can monitor the data more clearly.
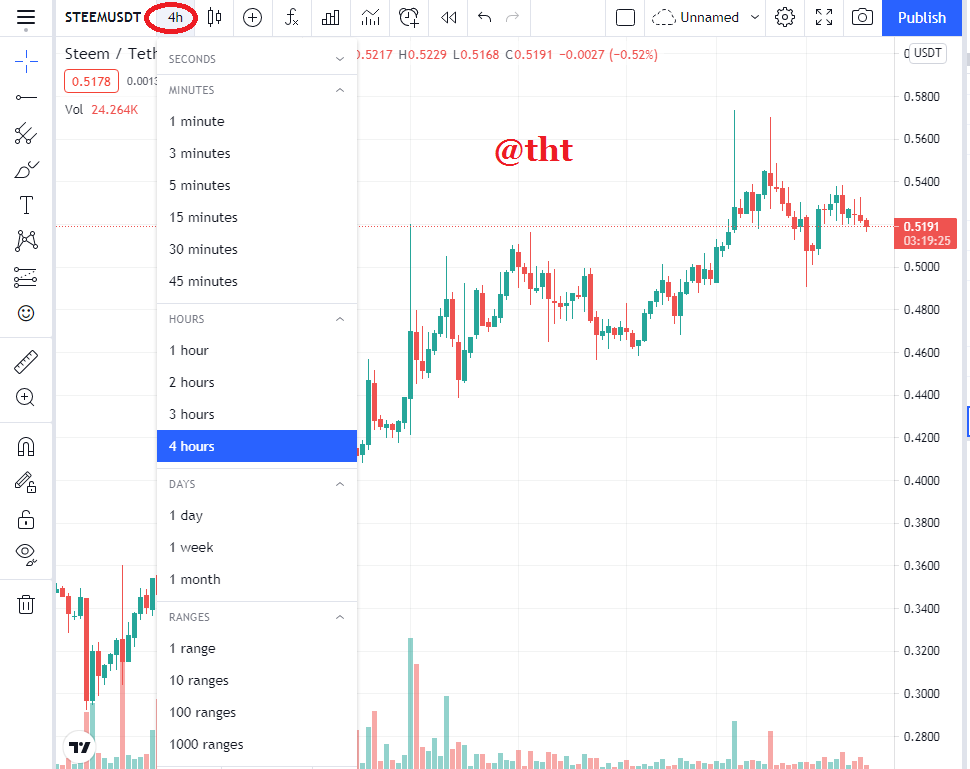
I clicked on the place I marked in the upper left corner. From here, we can select the time periods and apply them on the chart. I usually choose 4H hourly. But sometimes I make changes according to strategy and indicator. You can choose second, minute, hourly, daily, weekly, monthly timeframes.
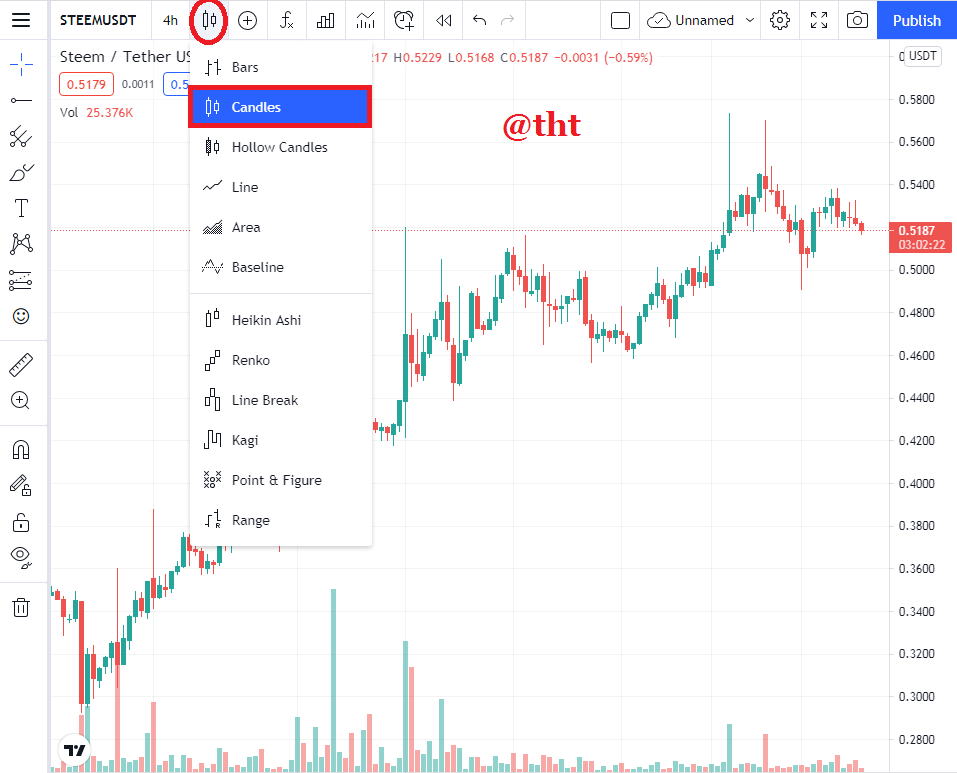
You can choose candlestick chart types by clicking on the place I marked. I always prefer "Candles".
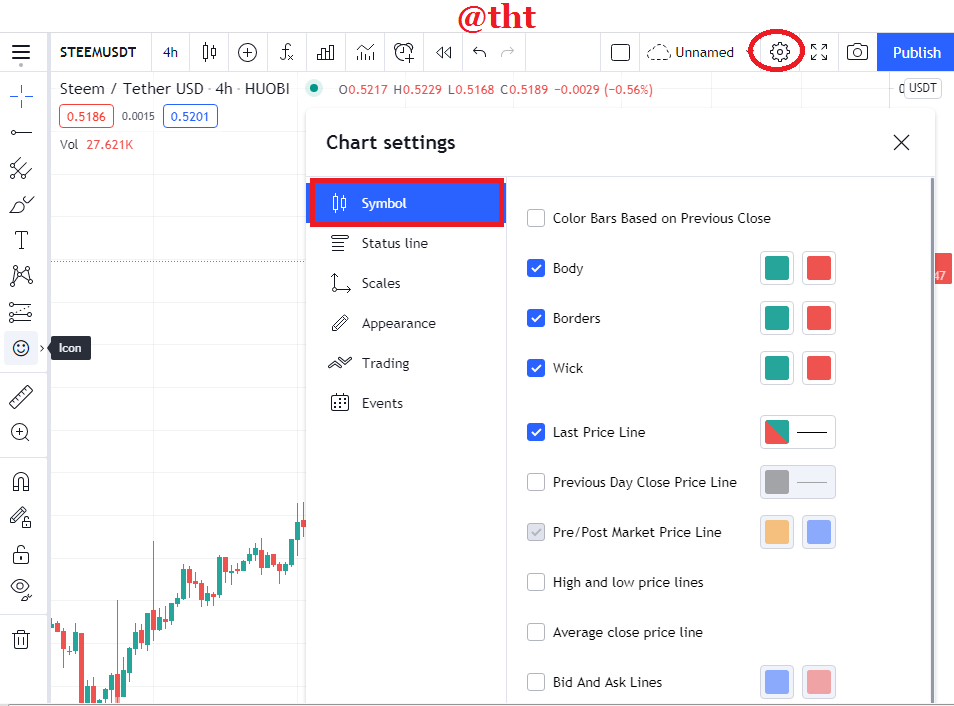
I click where I marked and choose the colors of the candles.
After making these adjustments, I will now talk about the tools with which we will organize our charts. One of these vehicles is "Horizontal Line" and the other is "Triangle."
Horizontal Line:
It is used for two purposes. It is often used to take note of the price of the asset. Another use is to draw support and resistance levels.
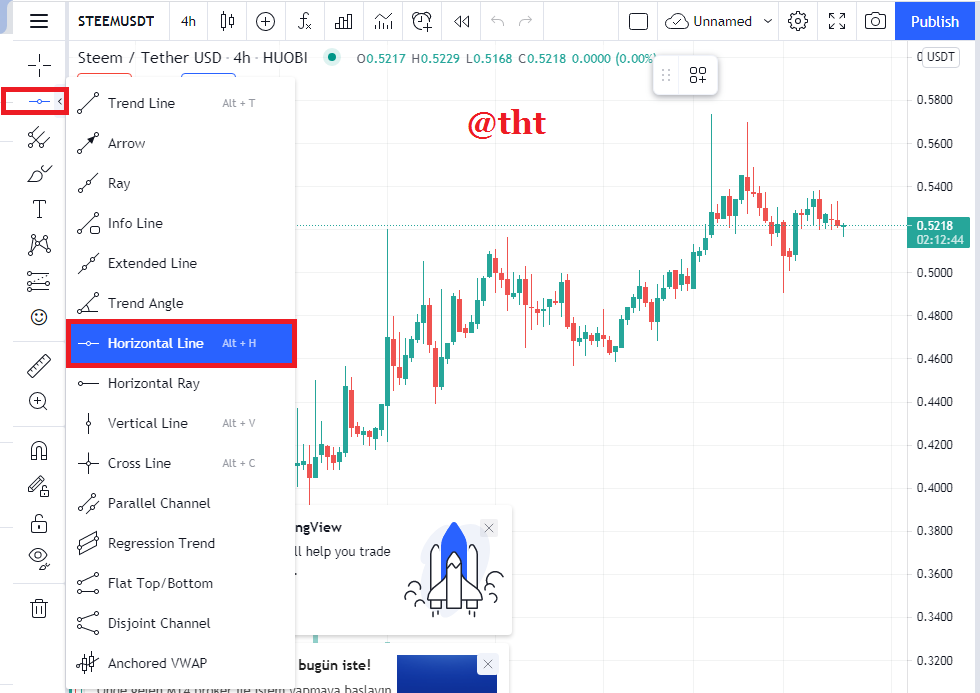
I clicked on the Geometric shapes in the upper left corner. Then I found 'Horizontal Line'. You can also access it by pressing Alt + H.

After choosing the horizontal line, I will draw a line to note the prices I need to keep in mind on the chart. It is also used to identify support and resistance levels.
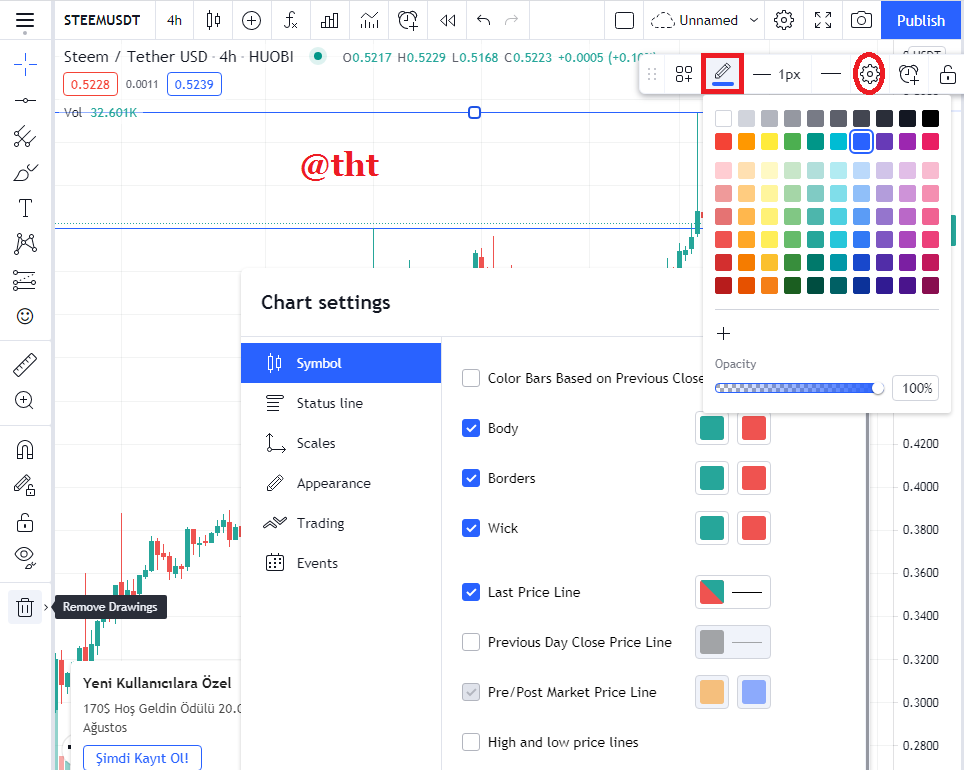
You can also make color and pixel adjustments by clicking on the places I marked in the screenshot.
Triangle
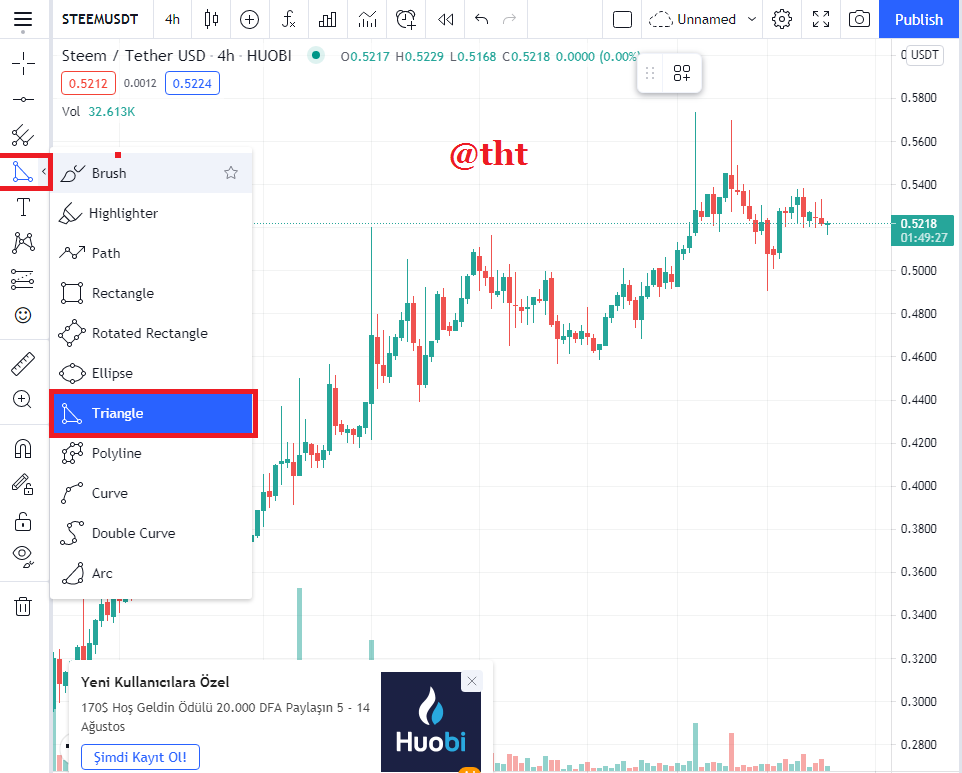
I found and selected "Triangle" from the geometric shapes on the left.
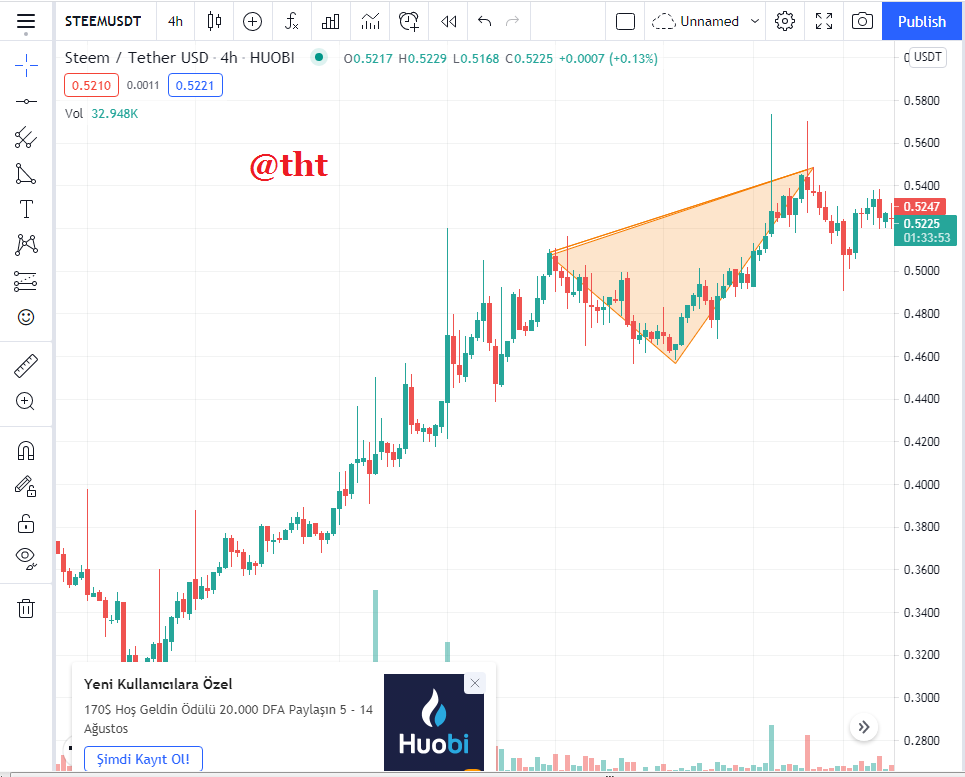
As you can see, I drew a shape on the chart using the "Triangle" tool.
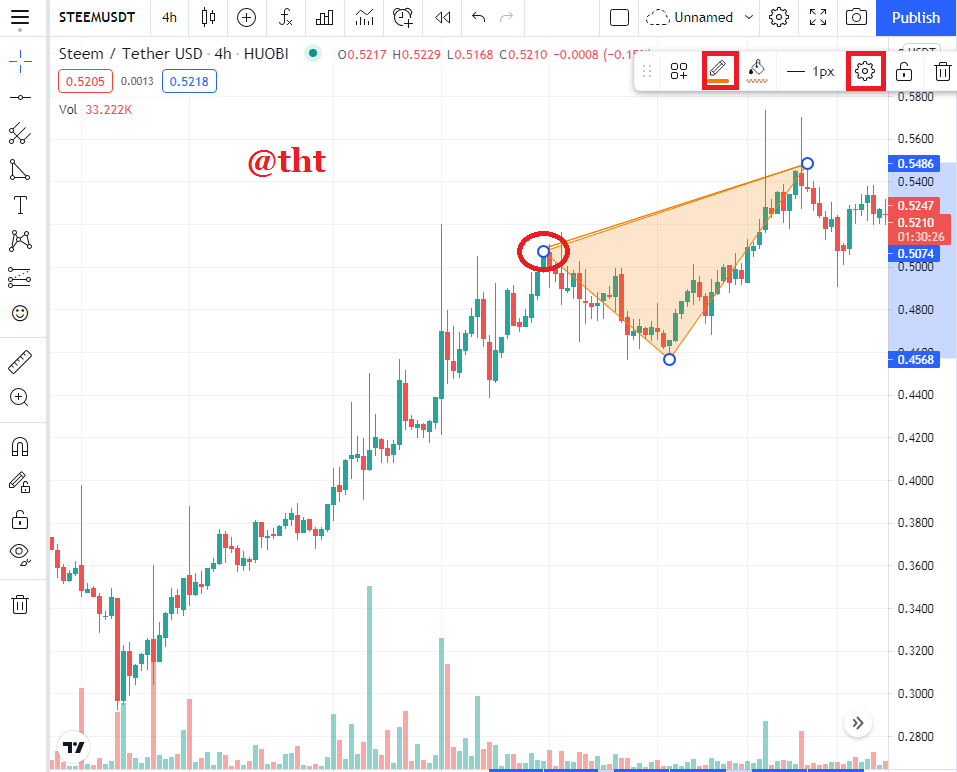
You can make various adjustments by clicking on the places I marked in the screenshot.
Explain how to add indicator in chart, what is your your favorite indicator and why? (screenshot necessary)
Traders often refer to indicators when doing technical analysis.
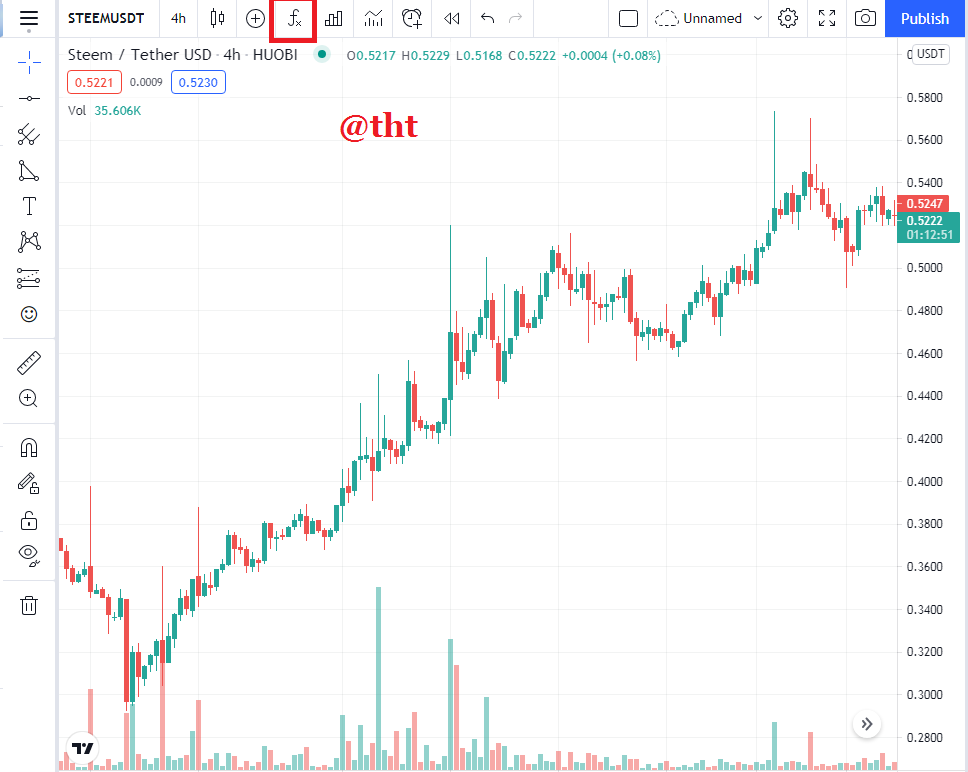
In order to select an indicator in Tradingview, it is necessary to click on the "fx" at the top.
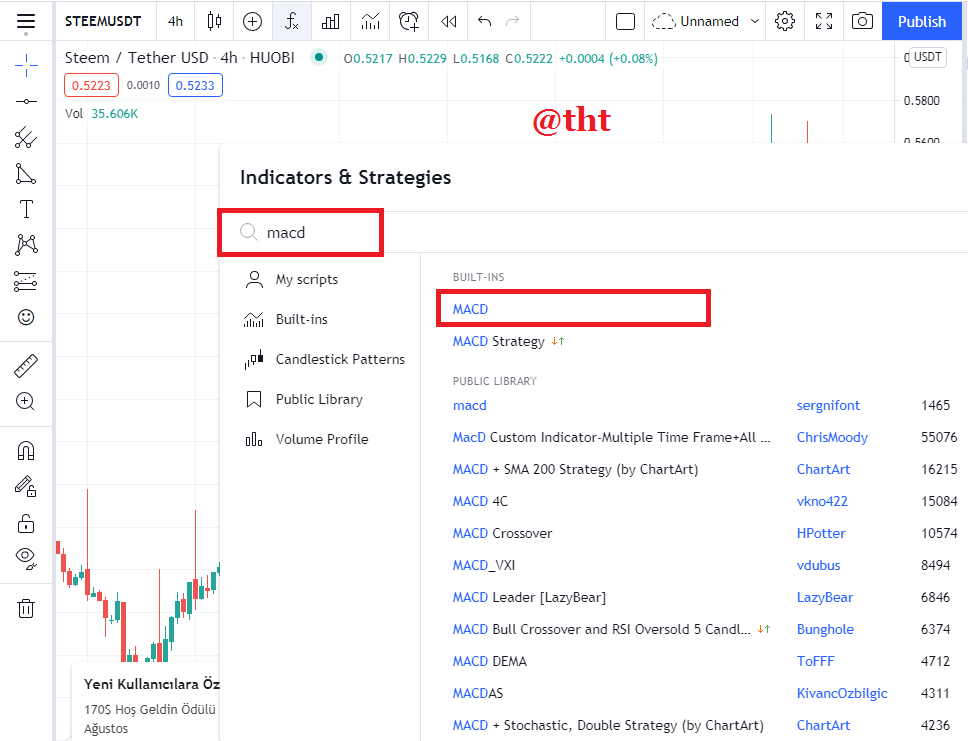
Then we write the indicator that we will apply on the chart in the search space. My favorite indicator is MACD.
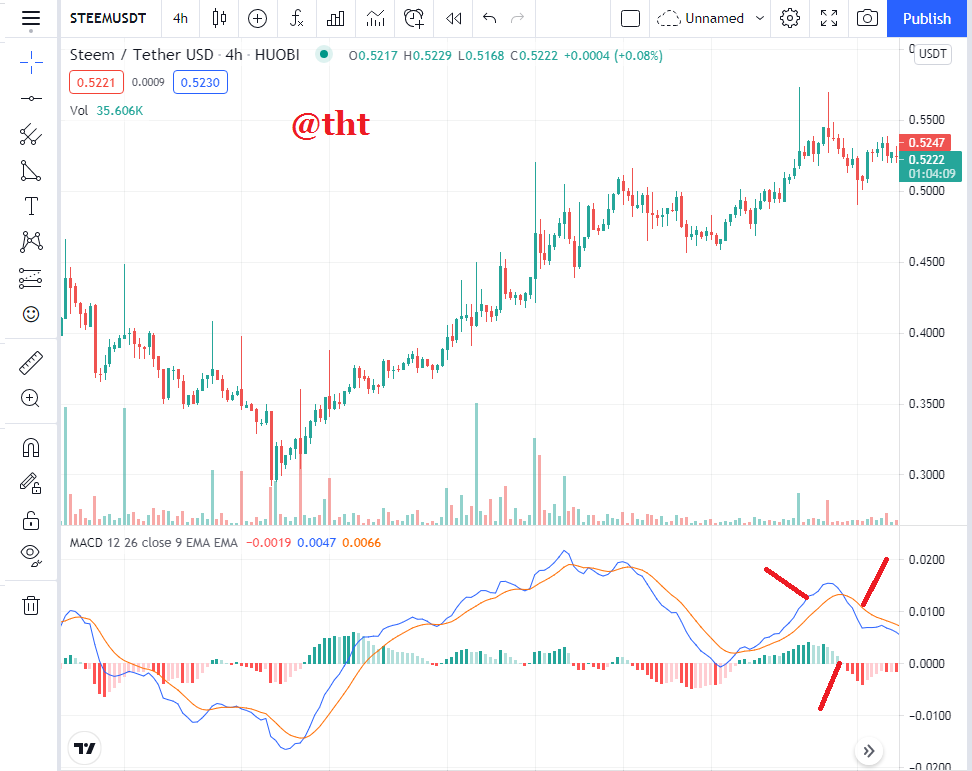
I applied the MAC indicator to the chart and it looked like the screenshot.
The MACD indicator is a trend follower indicator. It is obtained by subtracting the 12-day exponential moving average from the 26-day exponential moving average. The display has 3 lines: histogram, signal line and MACD.
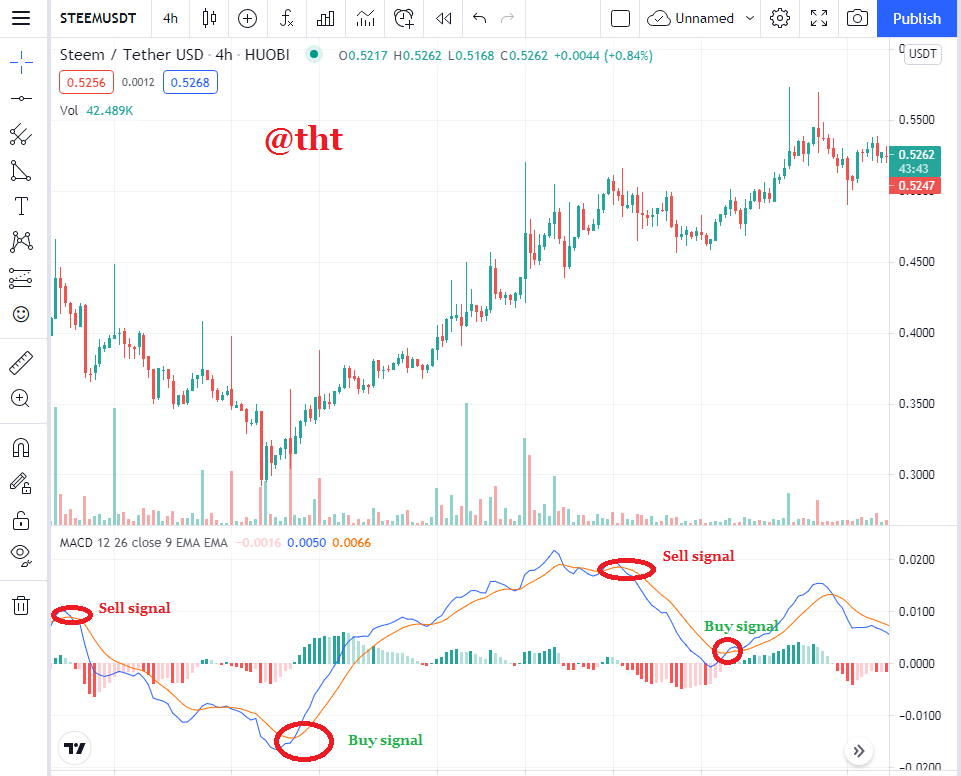
(tradingview Steem /USDT 4H chart)
I have marked the buy and sell signals as you can see in the screenshot. A buy or sell signal occurs when the MACD line crosses the signal line. A sell signal is formed if the MACD line crosses the signal line from top to bottom. On the contrary, if the MACD line crosses the signal line from the bottom up, a buy signal is formed.
The MACD indicator has a very low margin of error. I don't remember any trade where I took a loss using the MACD indicator. In this respect, it is among my favorite indicators. But while I can't use the MACD indicator, I use it in conjunction with other indicators. This way I get clearer signals.
As you can see in the screenshot, the Seem price has decreased where the MACD indicator gives a sell signal. Steem price has also increased where the MACD indicator gives a buy signal.
Do you think TradingView is useful in predicting the market for cryptocurrency (trend / price)?
I think Tradingview is quite useful in predicting the cryptocurrency market.
It is possible to examine the graphs of all cryptocurrencies. It also shows cryptocurrency charts on different trading pairs. It also shows charts according to stock markets. In this respect, it is a very impressive platform. For example, it is possible to see the chart of the Steem /USDT pair separately according to Poloniex and Huobi exchanges. If we choose high volume exchanges, we will analyze the chart better.
The Tradingview platform gives us many opportunities to predict the future price of the cryptocurrency. In particular, it gives us an idea of where the trend will go, whether the trend will continue or the trend will go in the opposite direction through indicators.
We learned and continue to learn how and how to use many indicators in Crypto Academy courses. When we use the indicators correctly, they give us buy and sell signals. Thus, it is beneficial for us in our trade.
I usually review the charts of cryptocurrencies on the Tradingview platform. I draw on graphics. I identify support and resistance points and guide my trading strategy accordingly. Before and after trading, I apply the indicators I know to use to the chart.
It is a platform that is frequently used not only by traders in the cryptocurrency sector, but also by traders related to the entire financial industry. Traders trade more consciously using this platform.
Conclusion
Tradingview platform is a comprehensive platform. It gives traders an idea about everything and provides convenience. It is a website that I visit many times during the day, even if I do not do any trade, even if it is to explore. When I'm not trading, I want to get practical by applying indicators on charts. In this way, I can see the buy and sell signals more clearly in the trades I will make. That's why I recommend you to visit Tradingview in your spare time to explore it thoroughly.
You can create a free account on Tradingview. This will be enough for you at the beginner level. Afterwards, as you gain experience and have sufficient financial strength, you can switch to a paid membership.
At the same time, users share their charts and ideas publicly on the Tradingview platform. By following these authors, you can get ideas and see details that you may not notice.
Thank you professor for this useful course.
Respected first thank you very much for taking interest in SteemitCryptoAcademy
Season 3 | intermediate course class week 7
thank you very much for taking interest in this class
Thank you prof. I wish you good luck in your work.
may Allah bless you always success ameen,