Crypto Academy Season 3 Week 8 Homework Post for (@asaj) Crypto Assets and the Random Index (KDJ)
This week, the professor gave detailed information about the KDJ indicator known as the Random Index. I read the professor's course article, did my research. Now I am writing the homework.
1.) In your own words define the random index and explain how it is calculated
The KDJ indicator is a new and very simple to use indicator. Since it is a new indicator, it is not yet popular enough. It is displayed among trend following indicators. It is one of the indicators used by traders to buy or sell from the most convenient places. It was previously used in futures market analysis, but after giving effective results, it started to be used in other markets as well.
The KDJ indicator combines the advantages of momentum, strength index and moving average, resulting in effective results.
You can use the KDJ indicator when you want to know if the trend is up or down, or when you are wondering where the best places to buy or sell. Of course, as with other indicators, it is not correct to use the KDJ indicator alone.
If you've ever used the Stochastic Oscillator or Alligator, you'll immediately notice how similar it is to the KDJ indicator. In addition, you will not have any difficulties in using it.
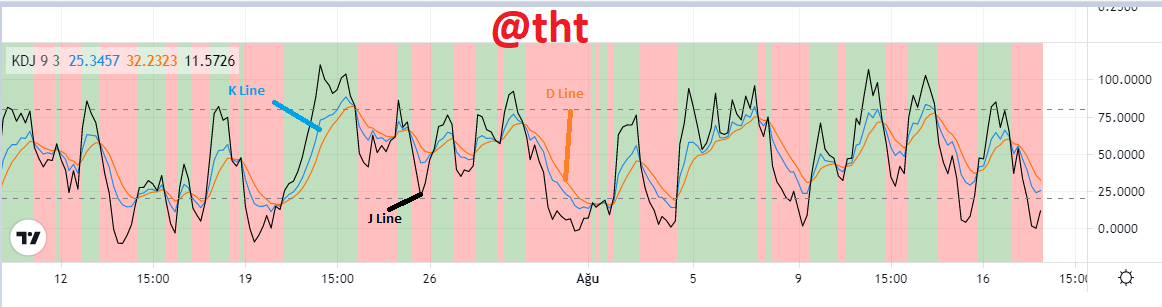
(tradingview)
As you can see in the screenshot, there are 3 lines on the KDJ indicator. These are the K line, D line and J line. The K line is usually shown in blue, the D line in orange or red, and the J line in black.
K line is a fast moving line. Due to its settings, it is more price sensitive than the D line.
As I said before, it is similar to the Stotastic Oscillator. The difference between them is the J line. The Stotastic Oscillator has only K and D lines.
In the other indicator, K and D values show overbought - oversold situations. However, this prevents the trader from trading at the optimal level. This is where the KDJ indicator comes into play. The KDJ indicator allows traders to trade from a more accurate place.
It makes more sense to use the KDJ indicator in volatile markets. Using it in flat markets will cause you to generate erroneous signals.
The KDJ value will have a value between 0 and 100. The indicator has 2 horizontal lines marked 20 and 80. If the indicator goes above and below these values, signals are received about the change of the trend.
How to calculate the KDJ indicator
The KDJ indicator, as it is known, has K, D and J lines. We need some data to calculate the values for these lines. Knowing the asset's highest price, lowest price, and closing price in a given period will help us calculate. K, D and J together with their values form the KDJ indicator.
KDJ calculation is quite complicated for a new learner. I can say that I spent a lot of time learning to calculate.
There is a value we need to find before we find the K, D, J values. This is the RSV value. You may not have heard of it before. RSV value: It means the immature random index value of the period (n hours, n days, n weeks, etc.).
Calculate RSV value
N-day RSV = (CN - LN) / (HN - LN) × 100
By applying this formula, the N-day RSV value is calculated.
CN: represents the closing price of n days
LN: represents the lowest price in n days
HN: represents the highest price in n days.
Calculate K value
After learning the RSV value, we can also learn the K value. We apply the data to the following formula.
K value of the day = (2 / 3 × K value of the previous day) + (1 / 3 × RSV of the day)
or
K value of the day = (2 / 3 × 50 )+ (1 / 3 × RSV value of the day)
Calculate D value
Now that we know the value of K, we can also learn the value of D. Enter the data where necessary in the formula.
D value of the day = (2 / 3 × D value of the previous day) + (1 / 3 × K value of the day)
or
D value of the day = (2 / 3 × 50) + (1 / 3 × K value of the day)
If the K and D values of the previous day are not known, it is recommended to use 50 as the value instead of these values.
After finding the RSV, K and D value, we can now find the J value as well. To find the J value, it is sufficient to know the K and D values.
Calculate J value
J value = (3 * K value of the day) - (2 * D value of the day)

2.) Is the random index reliable? Explain
The KDJ indicator is not 100 percent safe like other indicators. It has some flaws in itself. There will be times when it gives a false signal. By learning its use, we can filter out erroneous signals by using it in conjunction with other indicators. It is a slightly improved version of the Stochastic Oscillator. It signals overbought and oversold of an asset such as the Stochastic Oscillator. It shows you when the trend reverses. It also allows you to trade at the best entry and exit levels.
Like the Stochastic Oscillator, the KDJ indicator is also not recommended for use in flat markets because it gives too many false signals in these situations. It should be used especially in markets with high price volatility. In this way, you can identify trend reversals and the best entry and exit points.
I would like to say again that it is not correct to use the KDJ indicator alone. Using it together with the Average True Range Indicator and Average Directional Index will give us an advantage.
Now I will use the KDJ indicator and the ADX indicator (DI+, DI-) together.
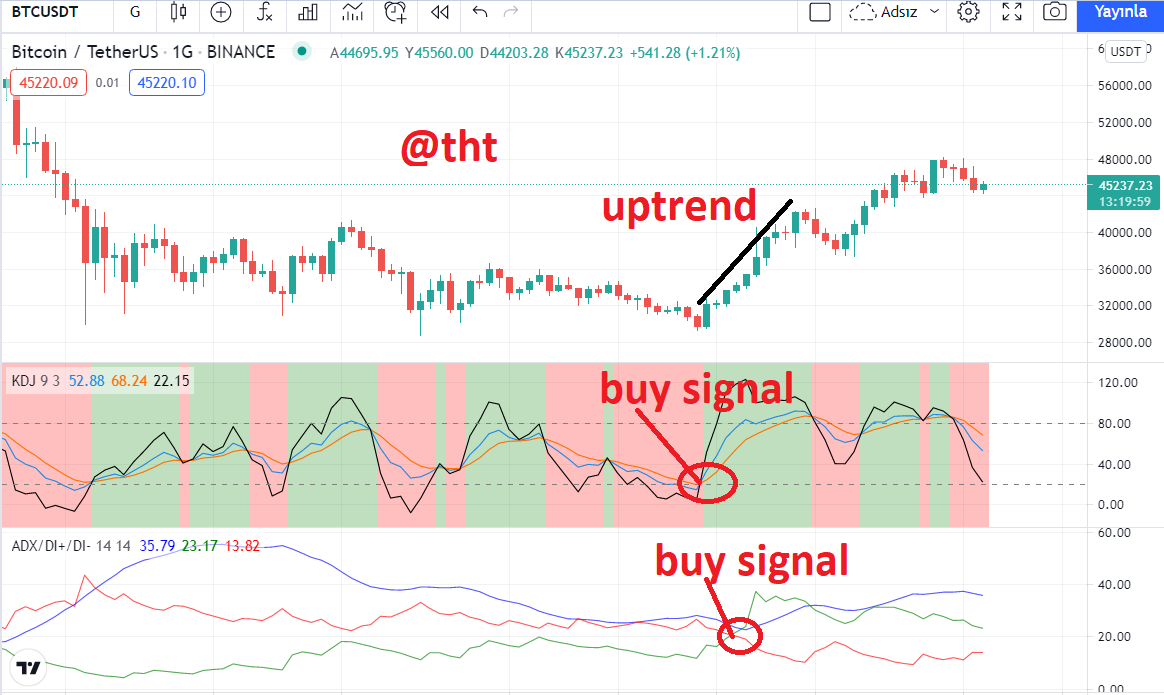
(tradingview BTC/USDT 1H chart)
As you can see in the screenshot, the J line has thrown itself upwards. It came out on top of the other lines. The current value is 23.30 . A very convenient place to buy. We see that the indicator turns green in the background. BTC price is rising. The ADX indicator gave the buy signal later as it was a slightly delayed indicator.
Finally, the KDJ indicator gives good signals in volatile markets, but false signals in stagnant or stable markets. To identify the best buy and sell levels, we should use it in conjunction with other indicators to see the trend direction. Our use of other indicators will be for confirmation purposes. Because the KDJ indicator gives a signal faster than the indicators with which it is used.
3.) How is the random index added to a chart and what are the recommended parameters? (Screenshot required)
Log in to the Tradingview website.
Open the chart for any entity. For example, this is the Steem /USDT 4H chart.
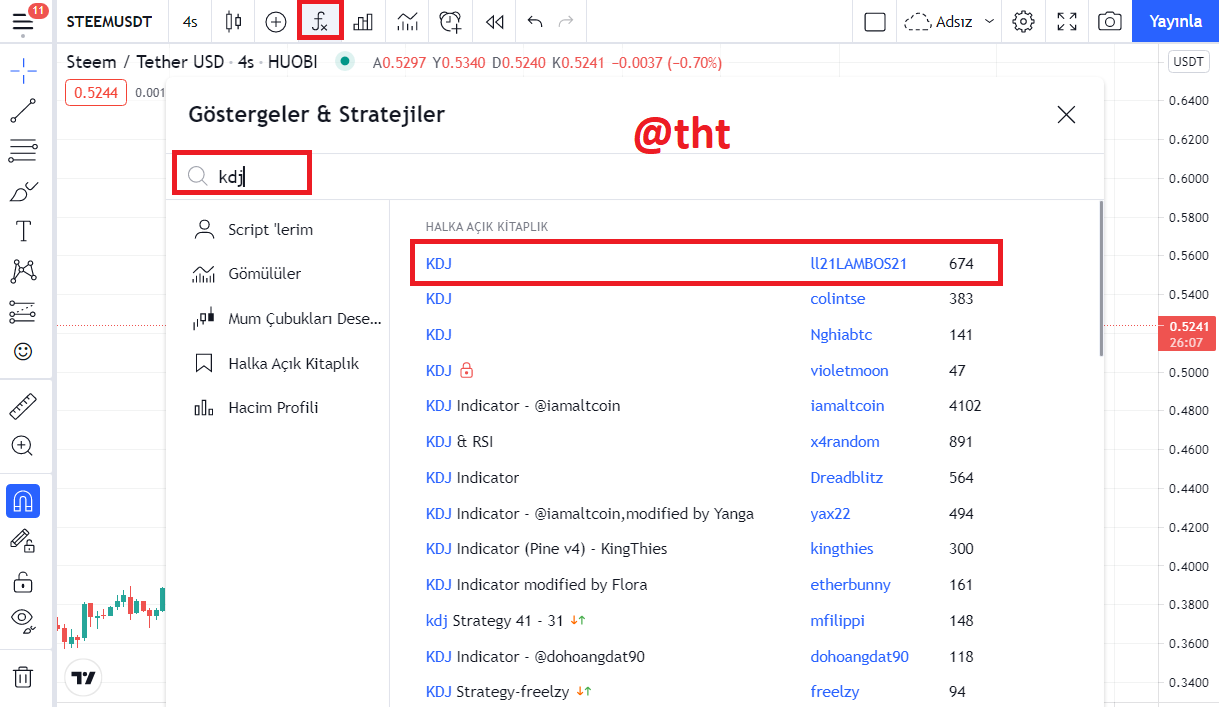
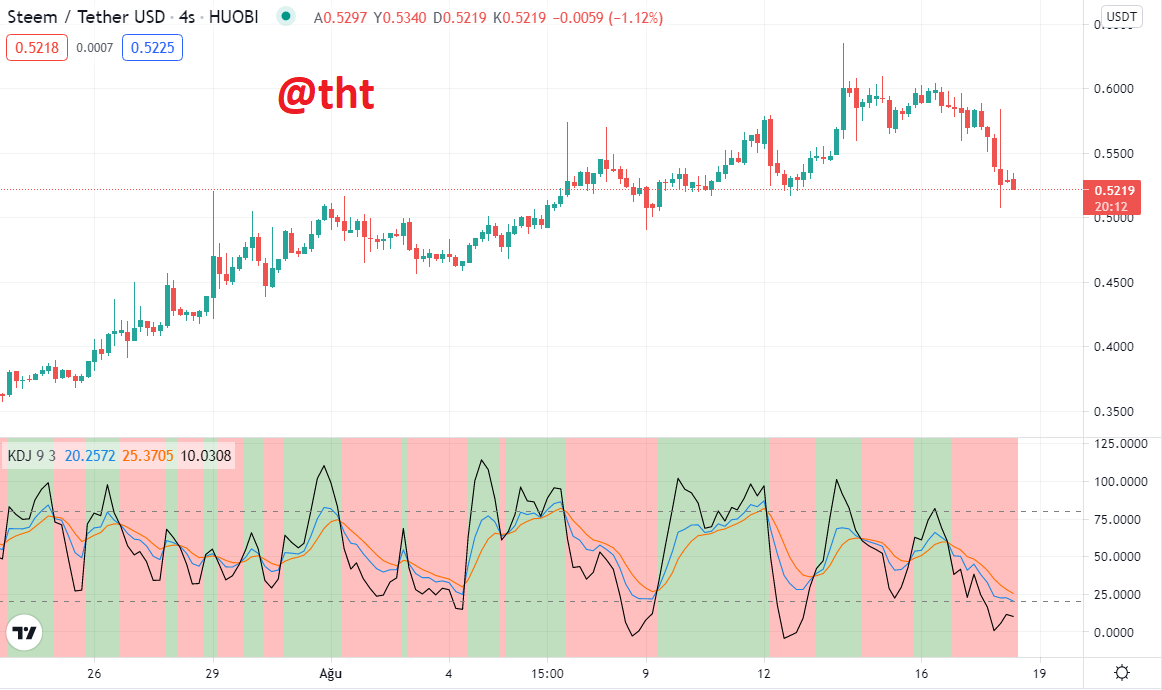
(tradingview)
Then click on "fx" in the upper right corner. Type 'kdj' in the search field. Click on ''ll21LAMBOS21'' that appears in the search results.
( tradingview STEEM/USDT 4H chart)
As you can see in the screenshot, we applied the KDJ indicator to the chart.
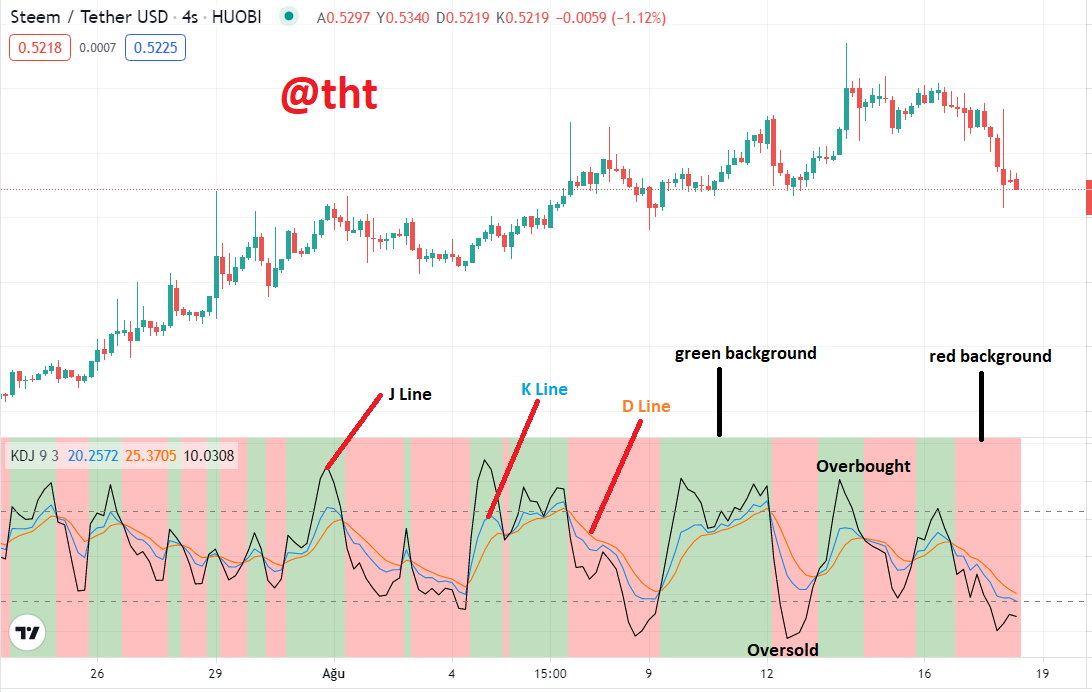
I showed the K, D and J lines in the screenshot. I showed Oversold and Overbought. After the trend change, the background starts to turn red or green.
KDJ indicator settings
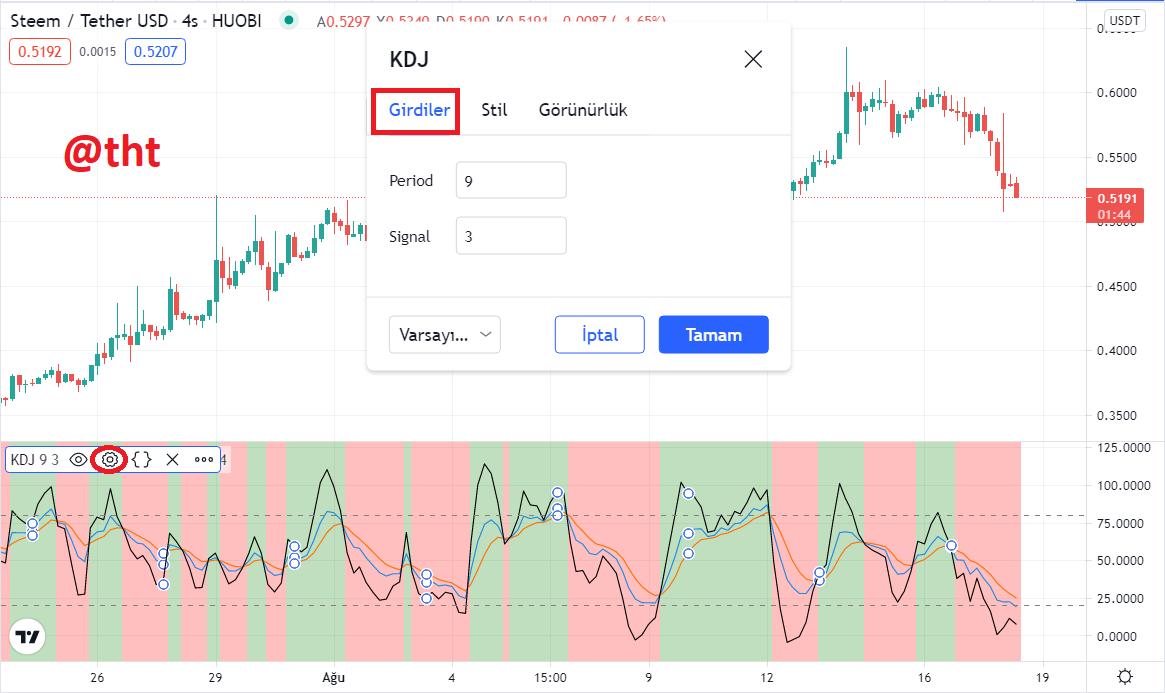
(tradingview)
Click on the location I marked to reach the settings section. Then click inputs. Period :9 Signal:3 is considered the best setting.
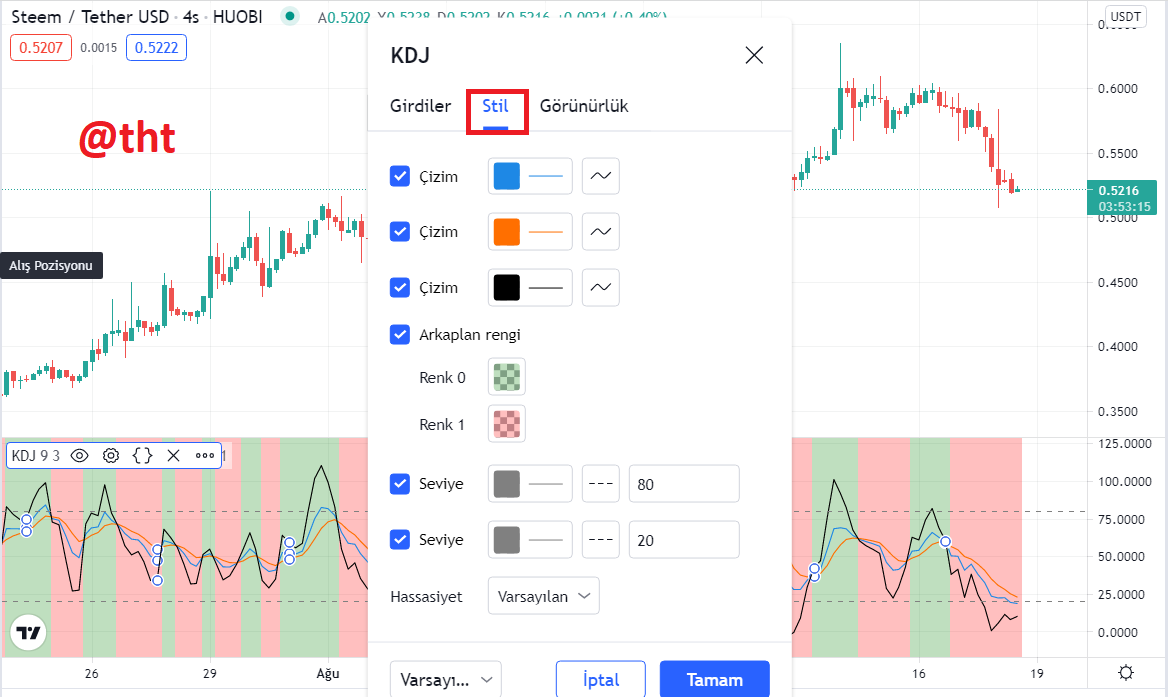
(tradingview)
You can change the colors of the K, D, J lines by clicking the Style section. You can also change the background colors.
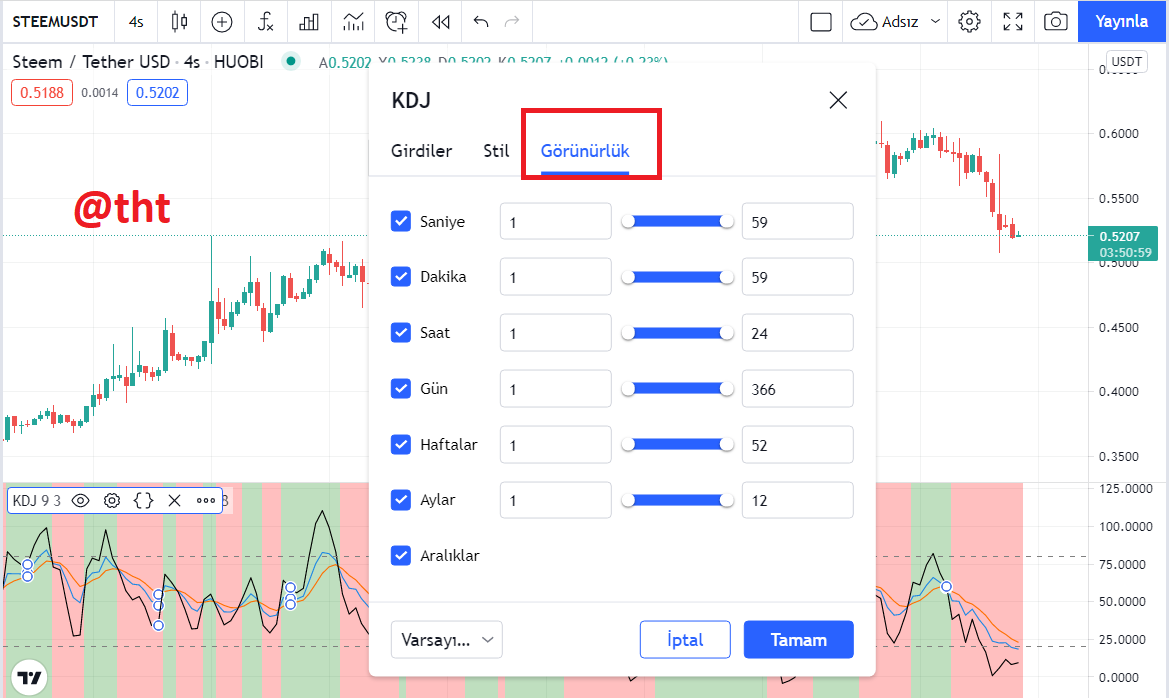
(tradingview)
By clicking on the visibility you will see that there are settings such as seconds, minutes, hours.
The KDJ indicator is recommended to be used when wanting to trade in short-term and medium-term periods. The recommended setting on the KDJ display is 9:3:3 days. As the periods are reduced, the number of false signals will increase. On the other hand, when the periods are increased, traders will have difficulty in receiving signals.
Traders who want to trade short-term can set it to 6:3:3. The risk of setting it this way is obvious. As the parameters get smaller, the fluctuations in the graph and the erroneous signals will increase.
Actually the parameter settings of the KDJ indicator vary according to the traders and their strategies. It would not be correct to say that the best setting is this. However, the recommended parameter settings are 9:3:3 days.
4.) Differences between KDJ, ADX, and ATR
The Average Direction Index is used to measure the trend strength of any financial asset. We do not know whether this, that is, the trend is down or up. The indicator takes a value between 0 and 100. When the ADX value is below 20, it means that the trend strength is weak. When it's above 25, the trend is strong. If the ADX value is above 50, we can understand that the support or resistance levels are broken, but it does not show whether the trend is up or down. So this is the difference with the KDJ indicator.
Unlike the ADX indicator, the KDJ indicator also gives information about the direction of the trend. When the J line is above other lines, we know that it is an uptrend. When the J line is below the other lines, we know it's a downtrend. The KDJ indicator has similar features to the ADX indicator, but the KDJ indicator is more comprehensive because it also gives information about the direction of the trend.
The Average True Difference (ATR) was developed by Welles Wilder, as was the Average Direction Index. The indicator is not used to determine the direction of the trend. Average True Difference is used to measure the volatility of financial assets. This volatility is caused by price gaps and limit movements.
There is an increase in volatility if the price of any asset is bullish or bearish, or if a reversal occurs. When the ATR value is high, volatility is high, and when the ATR value is low, it means low volatility.
The ATR indicator is not used to determine future movements, the direction of the trend. The purpose of the indicator is to give traders an idea about volatility. Unlike this indicator, the KDJ indicator gives traders an idea about the direction of the trend.
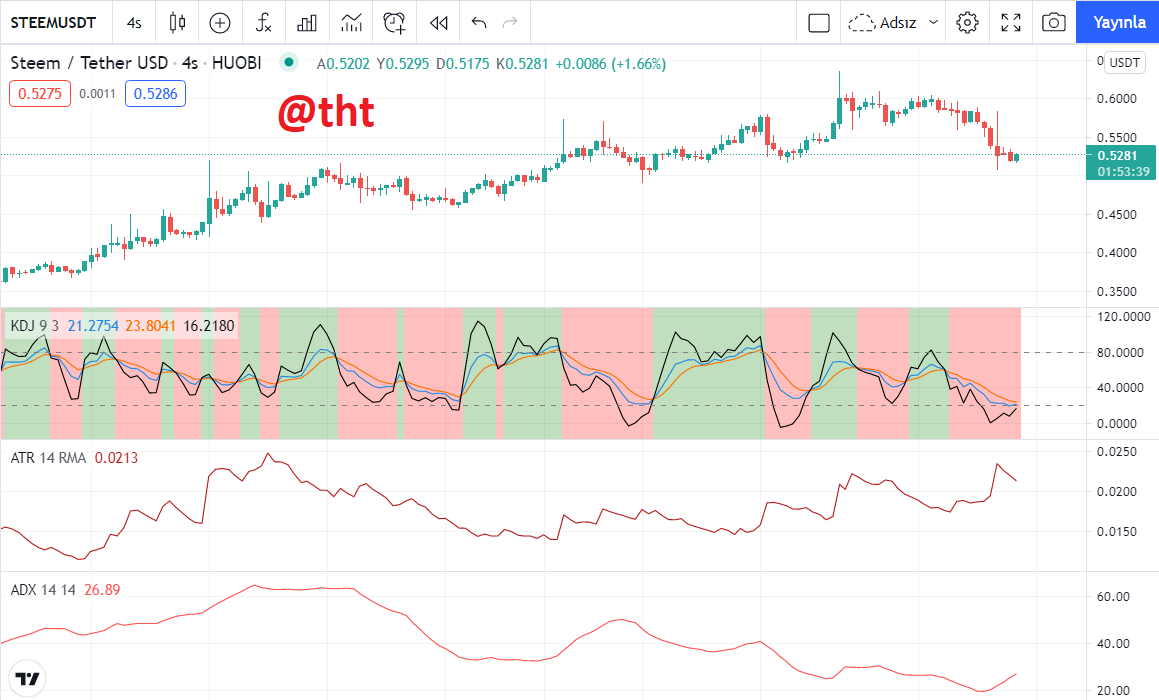
(Tradingview Steem/USDT 4H chart)
I applied KDJ, ADX and ATR indicators to Steem /USDT chart at the same time. As you can see in the screenshot, the ADX and ATR indicators have different features than the KDJ indicator. The KDJ indicator gives information about both the direction of the trend and the strength of the trend. This allows you to trade from the best entry and exit points.
The ADX indicator gives an idea of the strength of the trend. The ATR indicator gives traders an idea of the volatility of the market.
5.) Use the signals of the random index to buy and sell any two cryptocurrencies. (Screenshot required)
Now I will practice what I learned in this lesson. For this, I will trade two cryptocurrencies.
a) Steem/USDT Buy:
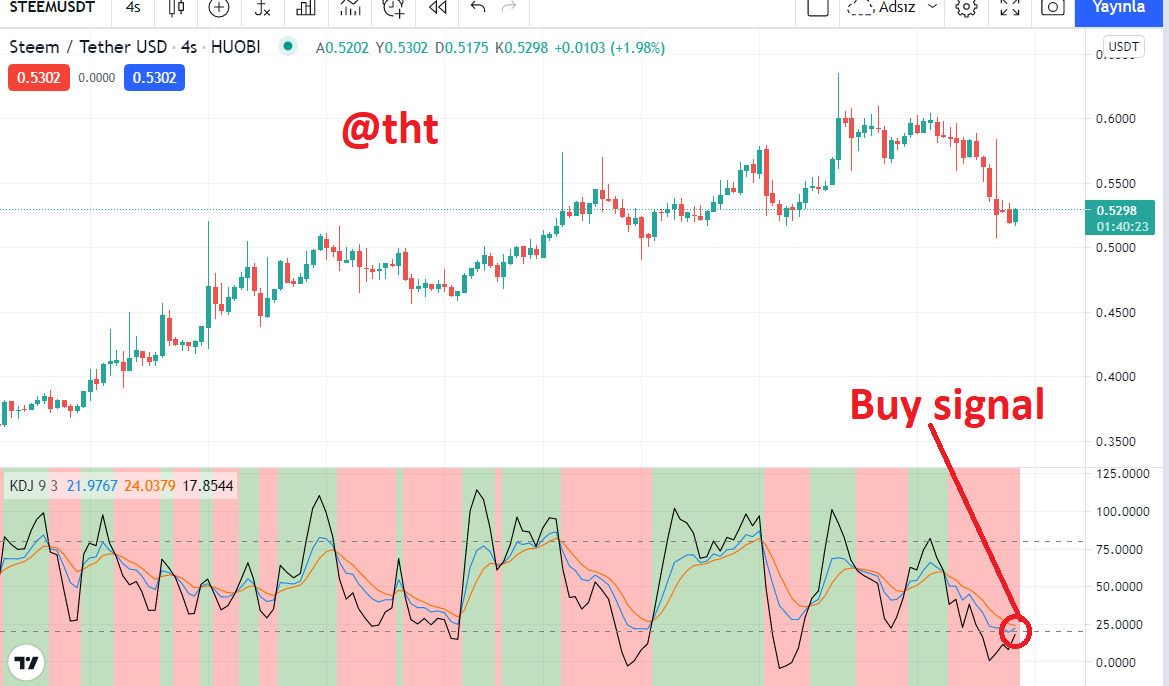
As you can see in the screenshot, if the J line is in the oversold region (about 20%) and below the K and D lines, a buy signal occurs. Although this is a somewhat risky signal, it allows us to buy the asset price at the lowest level.
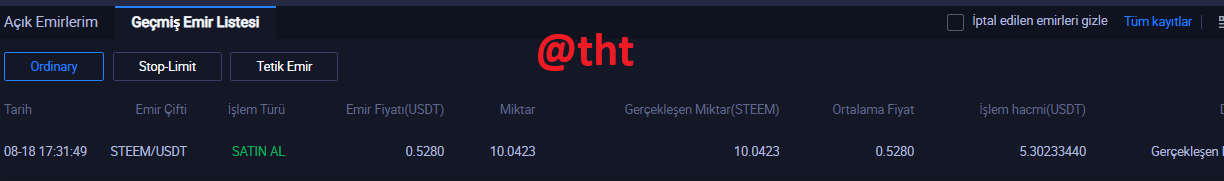
I bought about 10 Steem at $0.528 symbolically on the Huobi exchange. Now I will wait for the price to go up. I will sell Steem when the sell signal occurs.
Steem/USDT Sell:
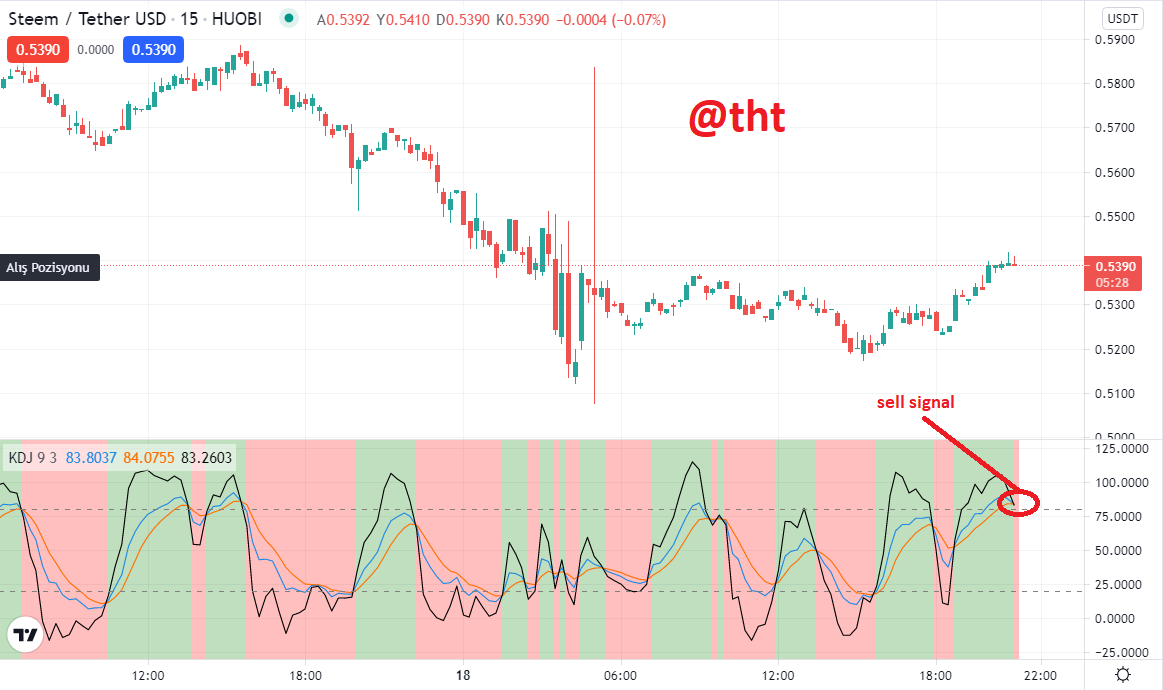
(tradingview Steem/Usdt 15m chart)
As you can see in the screenshot, a sell signal was formed when the J line left the overbought zone. The background has changed to red. Selling in the overbought zone is not a bad thing, the important thing is to make a profit.
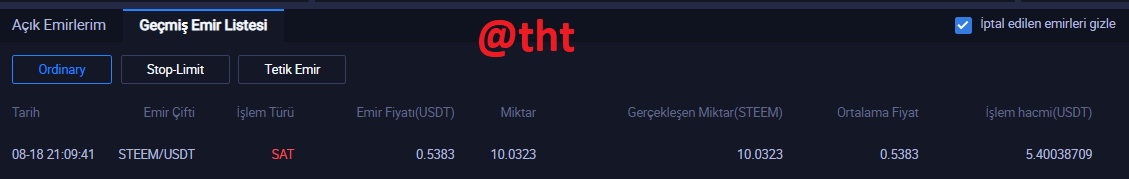
I bought Steem at 0.528$ and sold it at 0.538$ after the sell signal was formed. I made a total profit of $0.10.
b) KSM/USDT Buy:
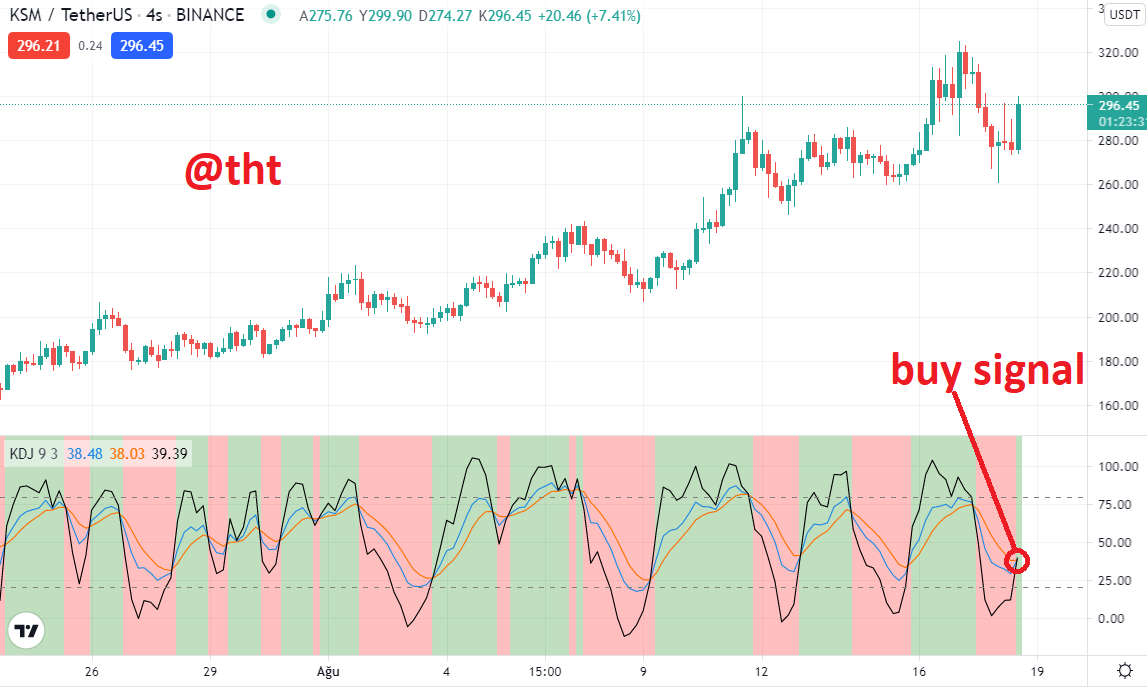
(tradingview KSM/USDT chart)
As you can see in the screenshot, the J line has started to cross the K and D lines. The background has turned green. In this case, a buy signal occurs. This method of purchase is considered more risk-free than the previous method of purchase.
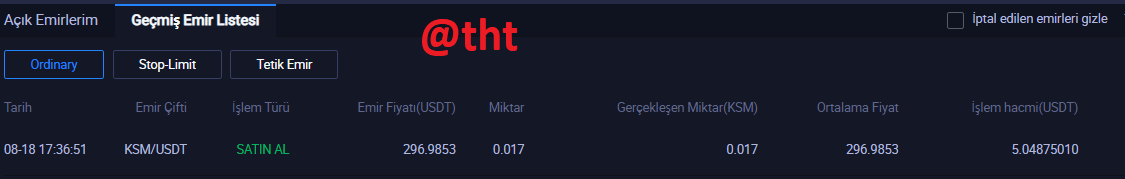
I bought about $5 worth of KSM. When I see a sell signal, I will sell the KSMs I own.
KSM/USDT Sell:
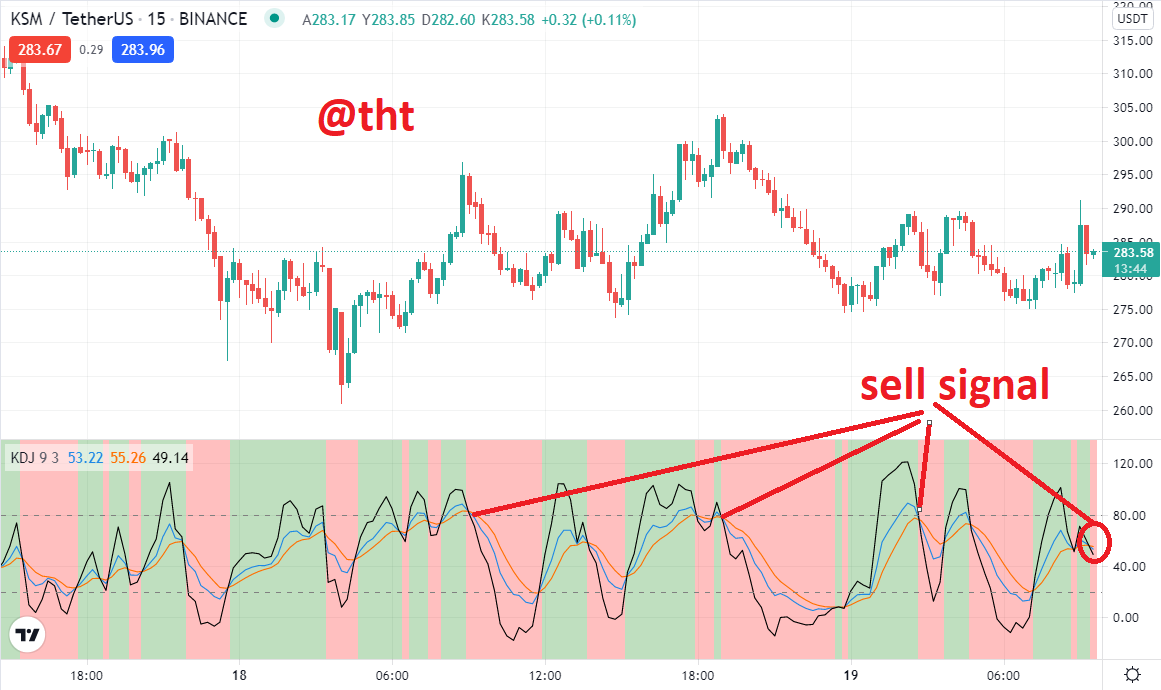
(tradingview KSM/USDT 15 m chart)
As you can see in the screenshot, the J line has gone below the K and D lines. The background has turned red. Therefore, a sell signal was formed. I also wanted to evaluate this sell signal. I marked a few places on the chart where a sell signal occurred.
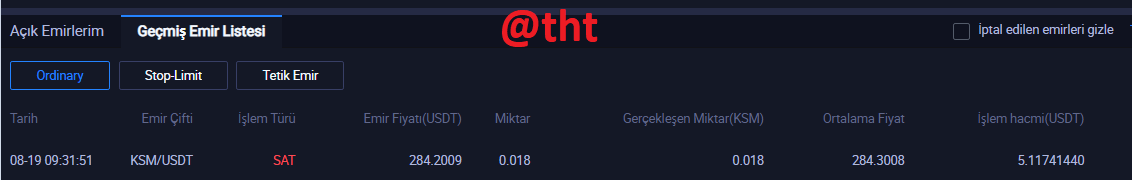
The cryptocurrency market has been on the decline for a few days. Almost all cryptocurrencies are in decline. KSM was also one of the cryptocurrencies affected by the drop. I made a loss of 0.001 KSM while trading. That means about $0.20.
Conclusion
The KDJ indicator is not yet a very popular indicator. Because it is still a new indicator. It is a derivative of the Stochastic Oscillator, but more comprehensive. While the stochastic indicator has D and L lines, the KDJ indicator also has a J line. Overbought and oversold zones show us the direction and strength of the trend. It also allows traders to trade from the best entry and exit points.
It gives false signals in flat markets. Therefore, it is necessary to use the indicator in more active markets.
As with other indicators, using the KDJ indicator alone is risky. We should use it together with ADX and ATR indicators to get the best results.
Cc:
@steemitblog
@asaj
Twitter Sharing
https://twitter.com/Steemtht/status/1428245917690380291
Hi, @tht,
Thank you for your contribution to the Steem ecosystem.
Please consider voting for our witness, setting us as a proxy,
or delegate to @ecosynthesizer to earn 100% of the curation rewards!
3000SP | 4000SP | 5000SP | 10000SP | 100000SP
Superb performance @tht!
Thanks for performing the above task in the eighth week of Steemit Crypto Academy Season 3. The time and effort put into this work is appreciated. Hence, you have scored 10 out of 10. Here are the details:
Remarks
You have displayed a good understanding of the topic. You have completed the assigned task. Your have performed the tasks in a commendable fashion.
Thank you professor. I wish you success in your work and see you in the new season.