Crypto Academy Season 3 Week 8 Homework Post for (@cryptokraze) Trading Sharkfin Pattern
The professor explained in detail the Trading Sharkfin Pattern this week. I read the professor's course paper, did my research, and now I'm writing the homework.

1 - What is your understanding of Sharkfin Patterns. Give Examples (Clear Charts Needed)
In the cryptocurrency market, sometimes the market moves horizontally, and sometimes the fluctuations are quite high. During periods of high fluctuations, the risk is high, but it is possible to turn this risky period into profit by applying some strategies.
Shark fin pattern trading is also possible during market volatility. In times of volatility, the market moves up or down sharply. This movement does not last forever, and there will always be a reversal. This is where the shark fin pattern trading method comes in.
If this reversal occurs in the case of a downtrend shift, it is seen as a V shape pattern. On the other hand, if this reversal occurs in case of uptrend slippage, it is seen as an inverted V shape pattern. Now let's examine them on graphs.
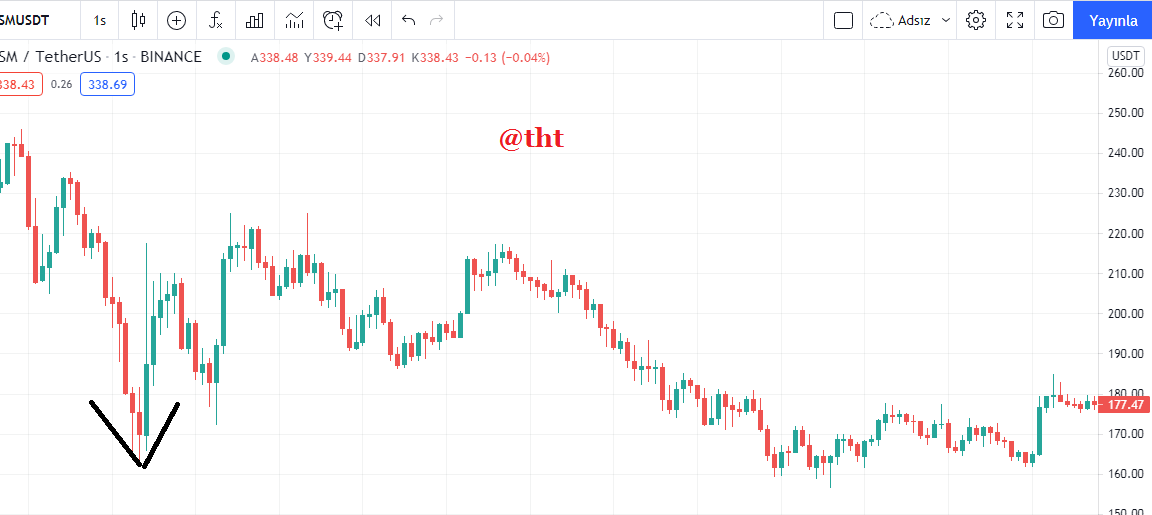
(tradingview KSM /USDT 1H chart)
As you can see in the screenshot, the market is quite volatile. At first, the KSM price fell sharply, then a reversal took place. Since the downtrend is in the form of a shift, the pattern is seen in a V shape.
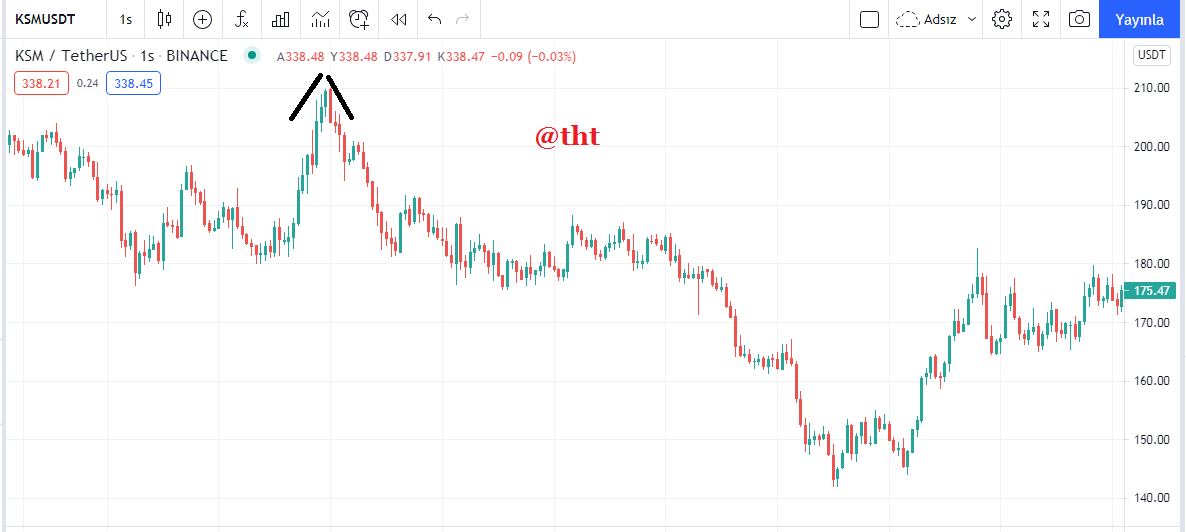
(tradingview KSM/USDT 1H chart)
Example of an uptrend shift on this chart. The market is quite volatile, the KSM price is rising sharply. Then there is a reversal in price. As you can see in the screenshot, this time an inverted V-shaped pattern is formed.

2 - Implement RSI indicator to spot sharkfin patterns. (Clear Charts Needed)
It is possible to find shark fin patterns from the charts. An experienced trader isn't very good at finding patterns, but what if you're an inexperienced trader. We need an indicator to find and confirm shark filter patterns. We can find shark filter patterns more clearly by using the RSI indicator, which gives traders trading signals from the most favorable places in volatile markets.
First, the period length should be set to 14, then the upper band should be 70 and the lower band should be 30. It is important to determine the period number 14. Because when we decrease the period, the number of false signals will increase, and when we increase the period, the RSI will turn into a lagging indicator.
Downtrend Shift
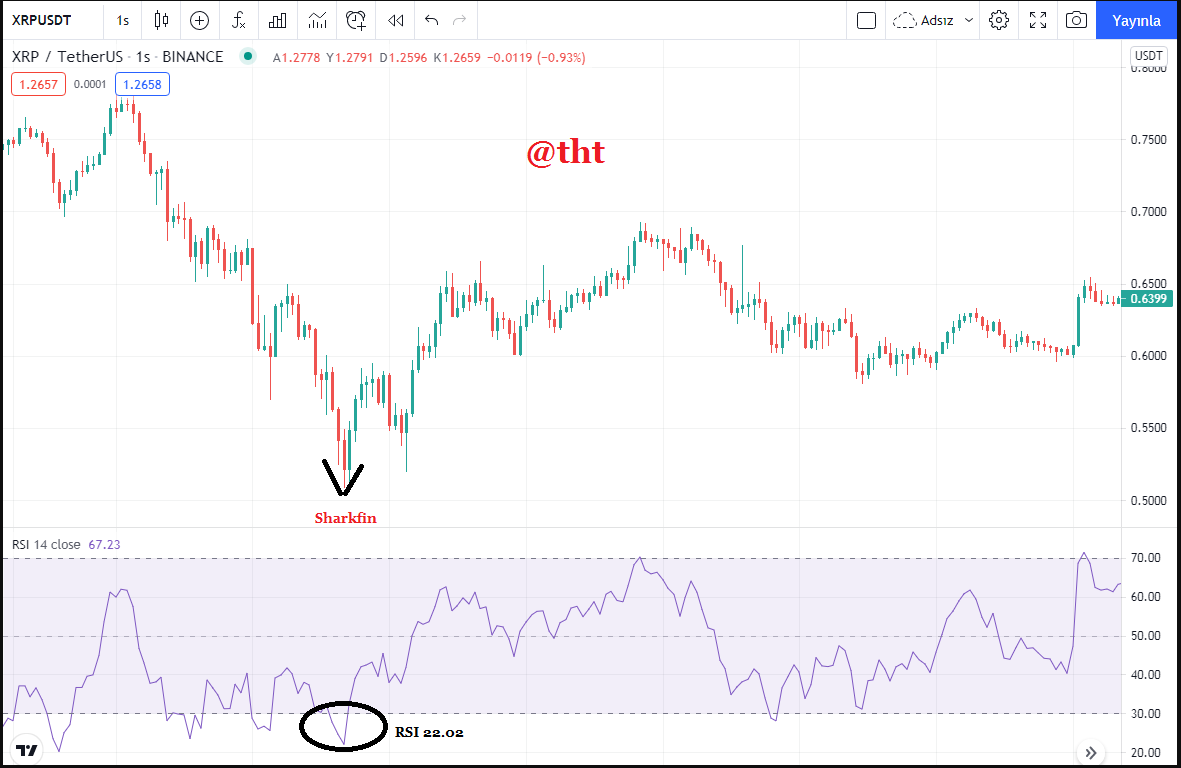
(tradingview XRP/USDT 1H chart)
In the downtrend shift, the price must fall hard first. The RSI value should drop below 30 as a result of oversold. It should then make a rapid rise to break above the 30 value. As you can see in the screenshot, a pointed V has formed both in the chart and in the shape of the RSI indicator. This confirms the existence of the shark fin pattern.
Uptrend Shift
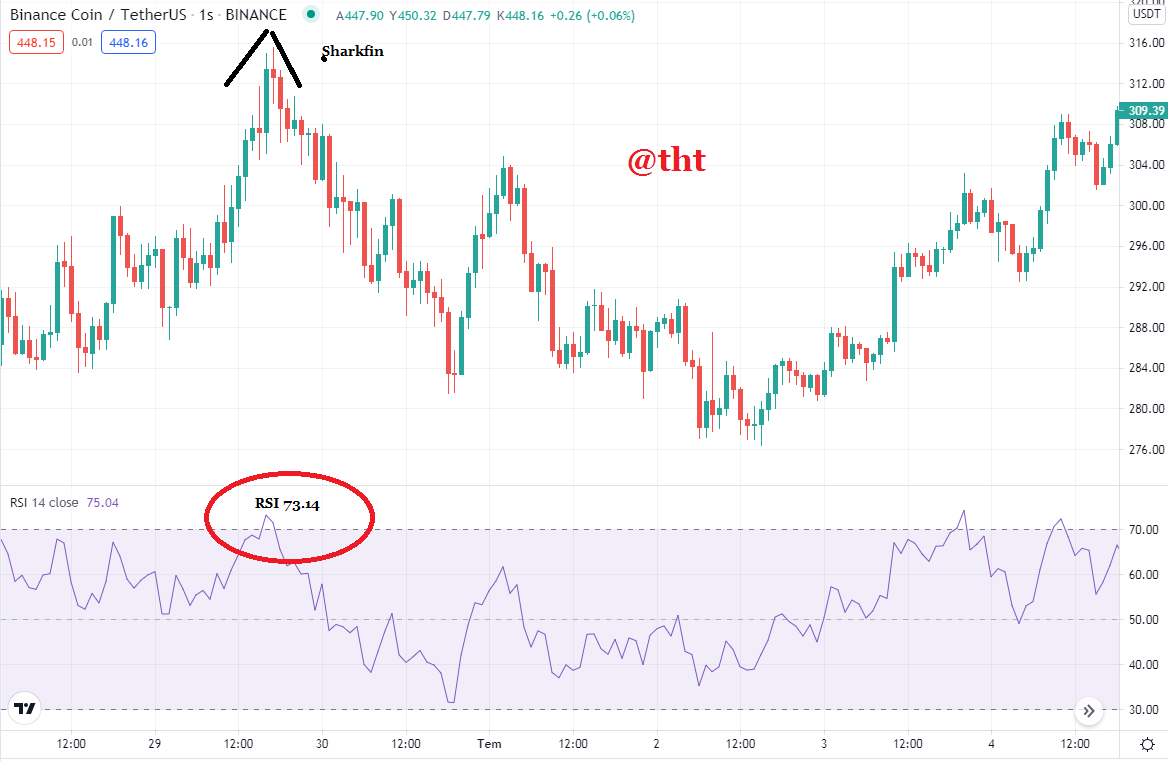
(tradingview BNB/USDT 1H chart)
Binance Coin price has risen sharply. As a result of overbought, the RSI value first crossed 70, then went up to 73.44. Afterwards, the uptrend shift occurred, the BNB price pulled back. RSI value has dropped below 70. I immediately observed the shark strainer pattern.
As you can see on both the BNB chart and the RSI indicator chart, an inverted V has formed. Thus, it was confirmed that our graph was correct.
3 - Write the trade entry and exit criteria to trade sharkfin pattern (Clear Charts Needed)
In the shark fin pattern, there are some criteria that we should pay attention to both in purchasing and selling transactions. When we apply these criteria well, our success rate will increase, we will make more profit or we will be able to prevent our loss.
Entry Criteria for a Buying Position
(tradingview LINK/USDT 1H chart)
We apply the RSI indicator to the chart with its default settings. The period should be set to 14, because when we reduce the period, we may get a false signal. Also, when we increase the period, we may not receive a signal.
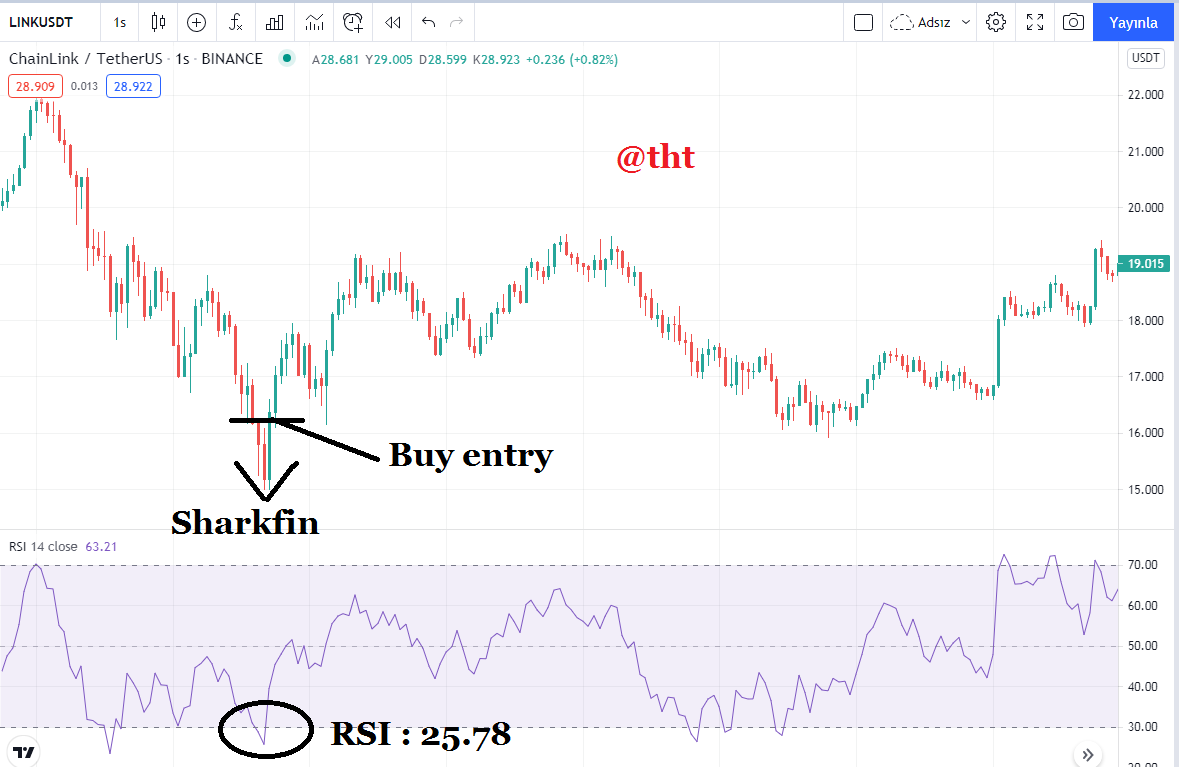
We expect the price to drop rapidly. There must be an oversold situation. Then we will wait for the price to rise rapidly. We will observe it rising to form a shape similar to the letter V.
The RSI value must fall below 30. Then, with the rising price, the RSI value should quickly rise above 30.
We should place the buy order when the RSI value is above 30.
Exit Criteria for a Buying Position
(tradingview LINK/USDT 1H chart)
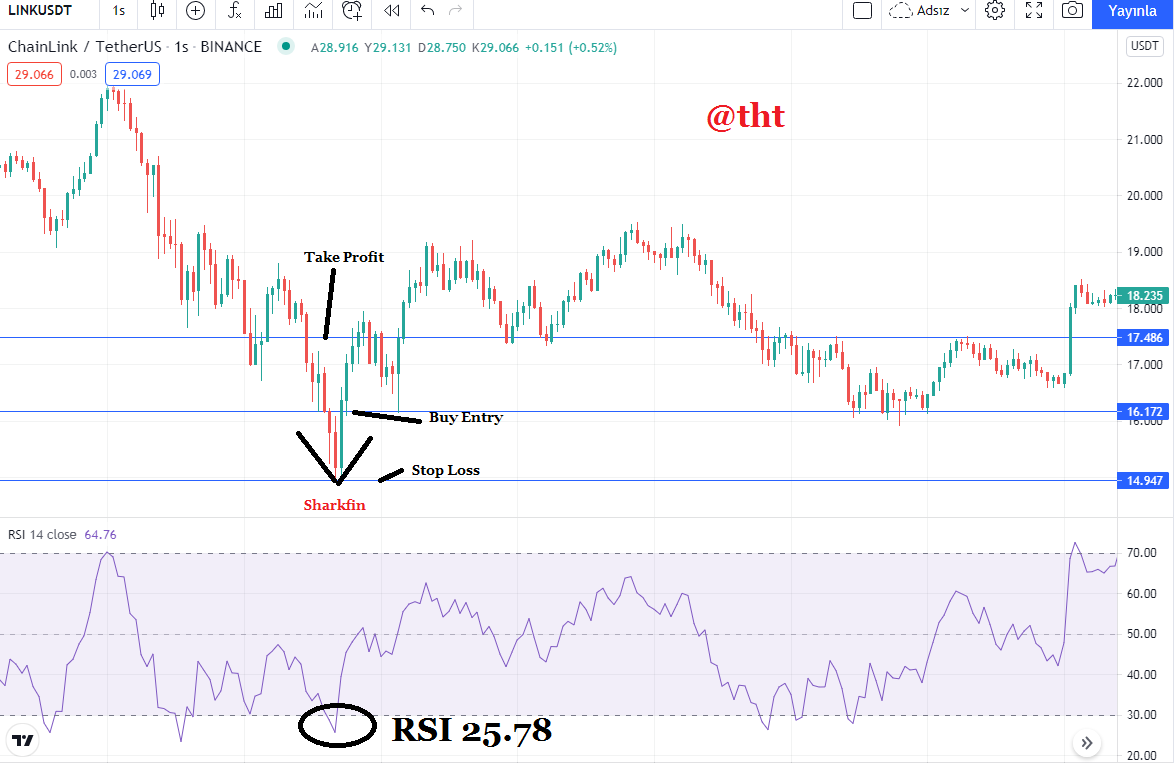
- After logging in, we should set a stop loss level in case our trade goes in the opposite direction.
- This stop loss level is set as the lowest point of the shark fin pattern swing level.
- If the price goes in the direction we do not want, our position will be closed and we will look for an opportunity for a new setup.
- If the trade proceeds as we expect, we need to adjust the take profit level.
- Our take profit level or our starting point R:R ratio should be at least 1:1. In other words, we need to determine the rate of profit as well as the risk we take.
In the chart in the screenshot, the RSI value dropped to 25.78.
Entry level: $16.172
Stop Loss level: $14.947
Take profit level: $17,486
Risk: 16,172 - 14,947 = 1,225
Reward: 17,486 -16,172 = 1.314
R/R: 1.225/1.314
As you can see, the take profit ratio is higher than the risk ratio.
Entry Criteria for a Selling Position
(tradingview MLN/USDT 1H chart)
We apply the RSI index to our chart with its default settings. We need to set the period to 14.
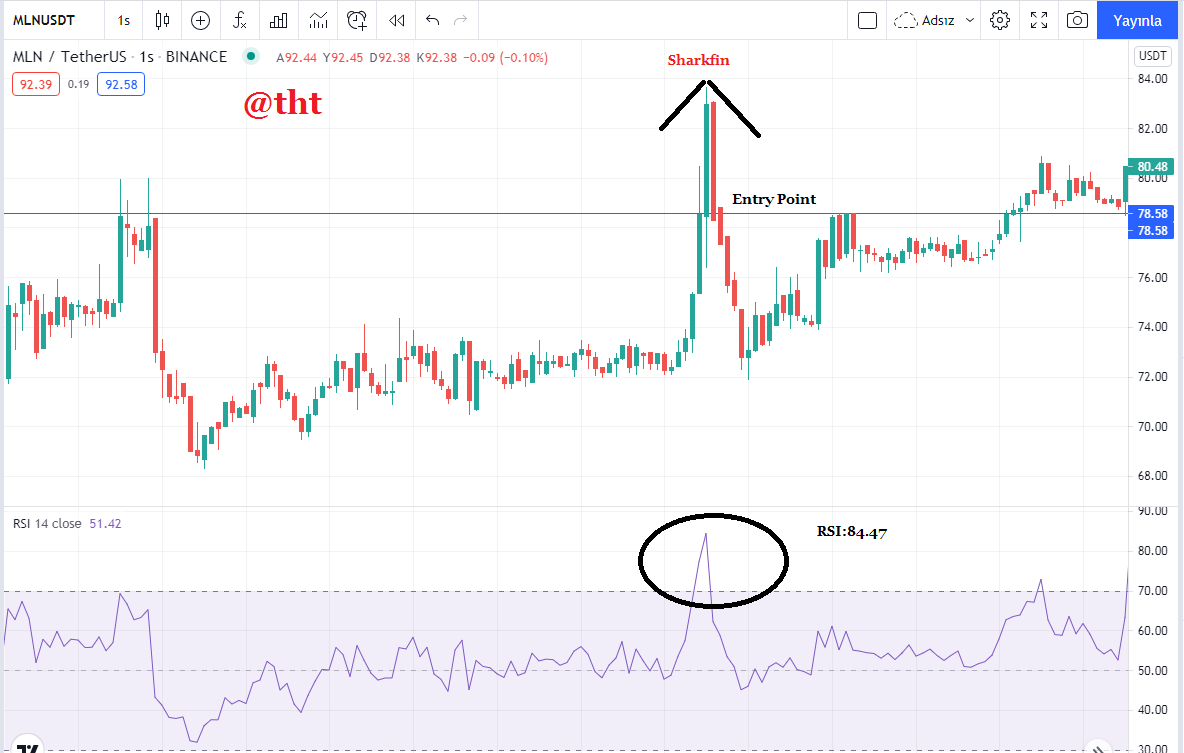
We expect the price to move up sharply. As a result of overbought, the price will go up. We will then wait for the price to drop and form an inverted V-shaped pattern.
We will wait for the RSI indicator to rise above 70, then the RSI value to drop below 70. It should make an inverted V shape on the RSI indicator.
We take our position after making sure that the RSI indicator has dropped below 70. We place our sell order.
Exit Criteria for a Selling Position
(tradingview MLN/USDT 1H chart)
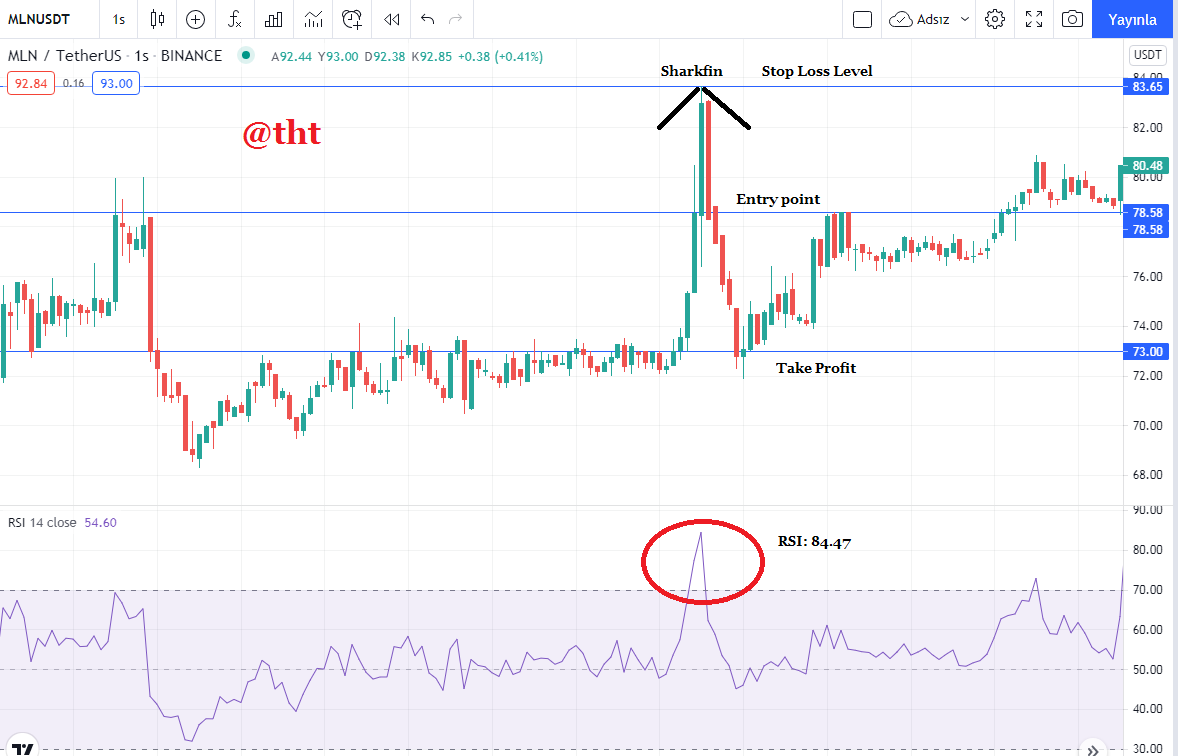
After placing the sell order, we need to set the stop loss level considering the possibility that our trade will reverse. The stop loss level should be above the high swing level of the shark fin pattern.
If the asset price moves in an unexpected direction and exceeds the stop loss level, our position will be closed. We will take action for a new installation.
If the asset price moves as we expect, we need to set the profit taking level. Take Profit level should be at least 1:1 Risk/Reward ratio. It should be equal to our minimum stop loss level.
Our position will be closed after the price reaches the take profit level.
4 - Place at least 2 trades based on sharkfin pattern strategy (Need to actually place trades in demo account along with Clear Charts)
Now we need to practice how well the assignment is understood.
After making the settings of the RSI indicator, I will apply the indicator to the individual charts. When the desired criteria are met, I will perform 2 trades.
1. AXS /USDT Sales Position and Sales transaction
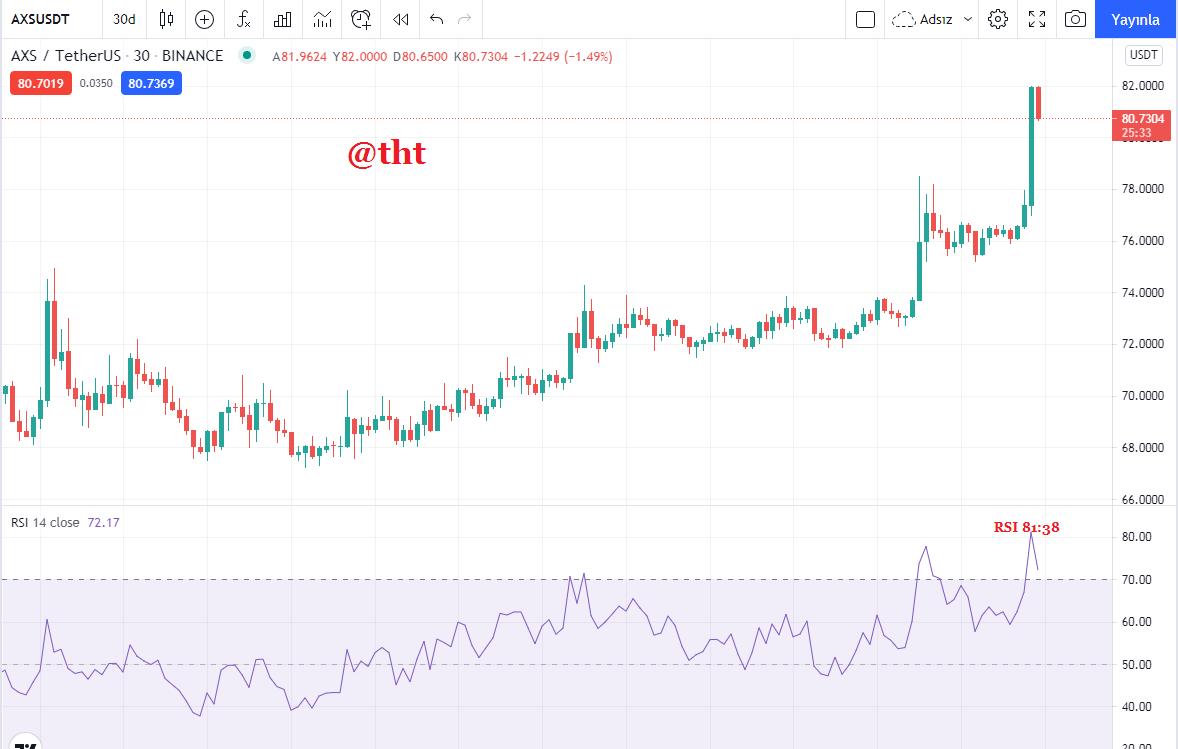
(tradingview AXS/USDT 30m chart)
While searching for charts, I came across a chart where the RSI value exceeded 70. With the price reversal, the RSI value seems to gradually drop below 70.
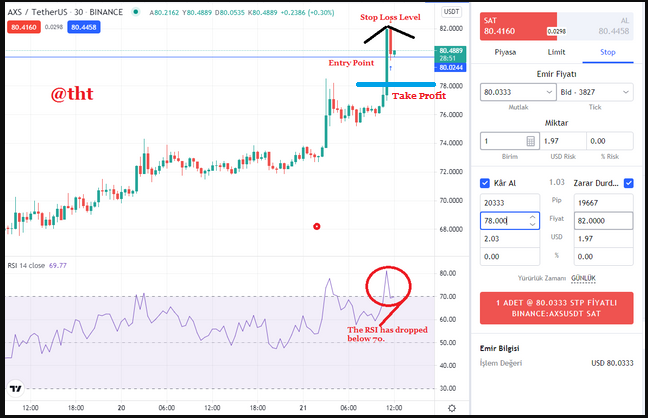
(tradingview AXS/USDT 30m chart)
After a while, I observed that the RSI value fell below 70 with the price drop.
Looking at the graph, we can see that a shark fin pattern has formed. An inverted V shape is formed.
I placed a sell order as soon as the RSI value dropped below 70.
Sale price: $80,003
Then I set the R/R ratio to be at least 1:1. My profit rate should not be lower than the risk rate.
Stop Loss: $82,000
Take profit:$78,000
Risk /Reward Ratio about 1:1
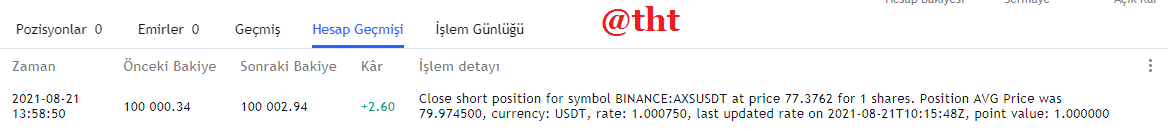
(tradingview trial procedures)
With the AXS price falling below $78,000, our position was closed and we made a profit of +2.60.
2.) IRIS /USDT Sales Position and Sales Transaction
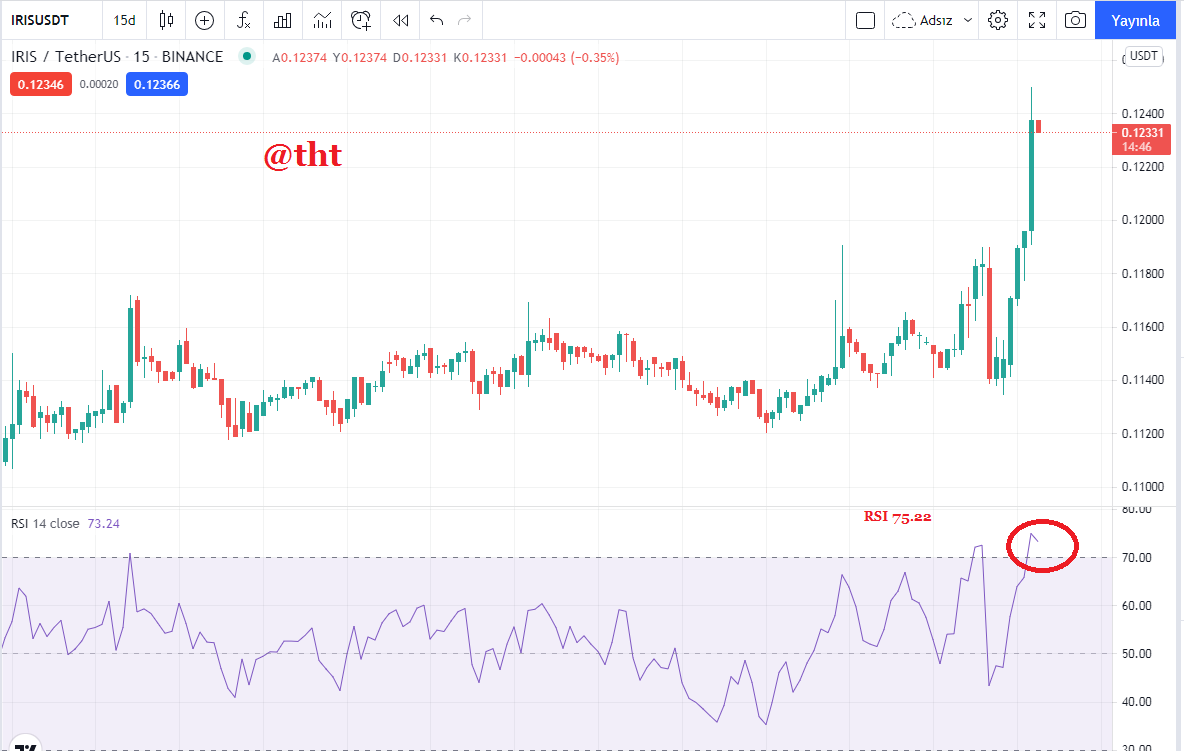
(tradingview IRIS/USDT 15 m chart)
I struggled for a long time to find the graph on which to perform the next action. Because today the market is a little sideways. Very few assets are overbought or oversold. While looking at the charts where the RSI value exceeds 70, I came across the IRIS/USDT 15m chart. The RSI value had exceeded 70 and a reversal was likely.
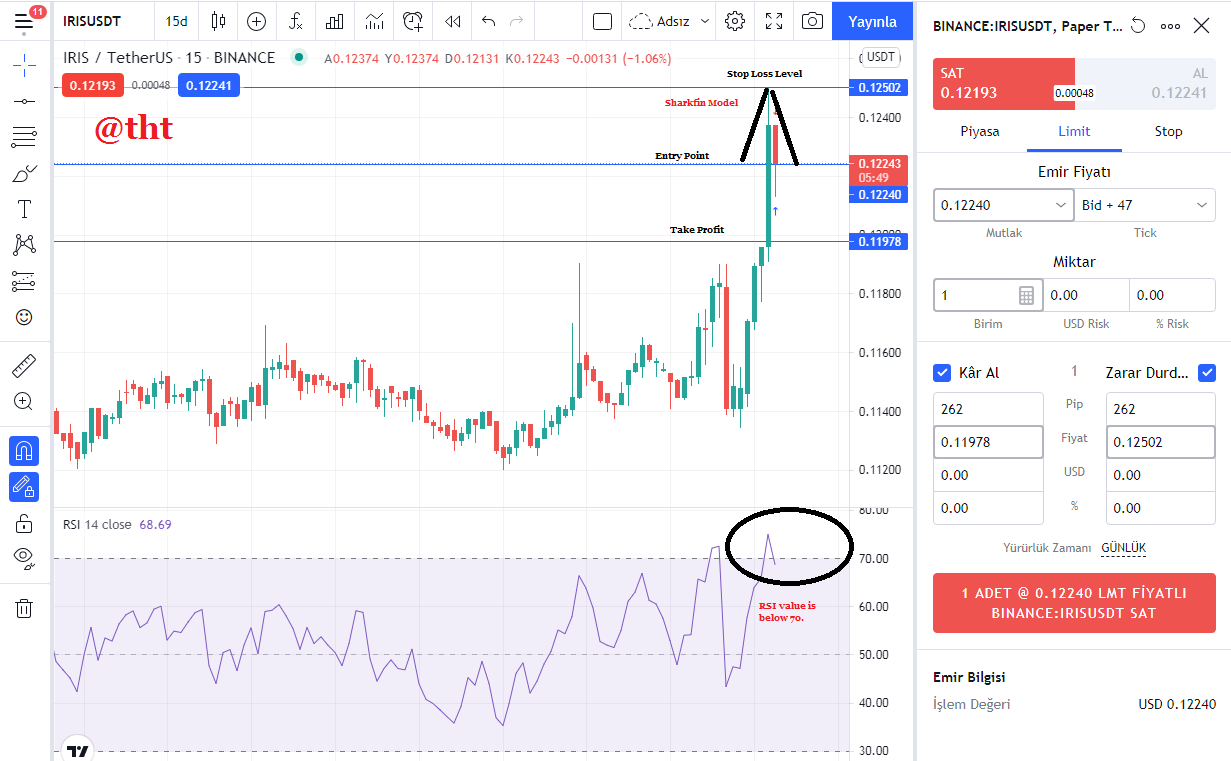
(tradingview IRIS/USDT 15 m chart)
- The RSI value rose as high as 75.22, then with a quick reversal, the RSI value fell below 70.
- Looking at the graph we can see that the Sharkfin pattern is forming and it looks like an inverted V.
- I made sure the RSI value went below 70 and set the sell price as $0.12240.
- I placed the Stop Loss level above the high swing point of the Sharkfin pattern. Stop Loss price: $0.12502
- Now it's time to take profit. This level must be such a level that the take profit ratio must be at least equal to the risk ratio. R/R 1:1
- Take profit price: $0.11978
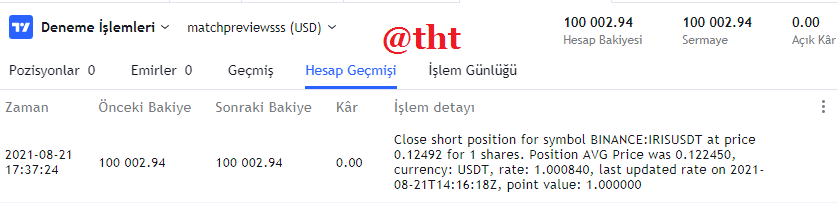
(tradingview trial procedures)
The price went up in a way we didn't expect. Our position is closed as the price exceeds the Stop Loss level.
Concluison
Sharkfin Pattern trading is a trade that should be practiced when the markets are volatile. We can try this trade during periods when the market is overly volatile, up or down.
A trader who has gained experience by constantly trying this method can see the shark fin pattern just by looking at the chart. But if he wants to be sure of this, he should use the RSI indicator. In periods of overbought or oversold, the RSI value rises above 70 and falls below 30.
It is necessary to examine the charts where the RSI value falls below 30. If there is a reversal in price and the RSI value rises above 30, it is necessary to place a buy order immediately. While doing this, it is necessary to determine the Stop Loss and Take Profit levels that will be in our favor.
It is necessary to examine the charts where the RSI value is above 70. If there is a quick reversal in price and we are sure that the RSI has dropped below 70, we should place the sell order. While doing these, we need to determine the Stop Loss and Take Profit levels in our favor.
With this trading method, we can make trades where we can make a profit. We just have to be patient and apply the trading strategy well.
Finally, according to some, the TDI indicator can be used instead of the RSI indicator in this trading method. The TDI indicator is a combination of the RSI indicator and the Bollinger bands.
Thanks to the professor for this lesson.
Twitter sharing
https://twitter.com/Steemtht/status/1429092948378099717