Crypto Academy / S4W4 - Homework Post for [kouba01] - Williams %R indicator.
QUESTION 1
Explain the Williams %R indicator by introducing how it is calculated, how it works? And what is the best setting? With justification for your choice.
The Williams %R Indicator
Calculation of the William %R Indicator
The calculation of the William %R Indicator is shown below;
William %R = Highest High – Close / Highest High – Lowest Low
The highest high is the highest price in the look back which is in typical 14 days
The close is the most recent closing price
The lowest low is the lowest price in the look back period which is typical for 14 days.
Example
Lets assume the specific period to be 14days;
Maximum price = $2
Closing price = $1.5
Minimum price record = $1
William %R = (2 – 1.5) / (2 – 1) * -100
= -50%
How it works
The functioning of the William %R Indicator is quite simple and straight forward. The William %R Indicator reads values of overbought and oversold regions in the prices of an asset.
It normally moves between the values of 0 and -100. With this we have two lines drawn which are the -20 and -80 regions. The -20 reading above indicates an overbought while the -80 below indicates an oversold region. Overbought and oversold regions indicate possible reversal in the trend which is a time in which we can use this opportunity in placing the buy and sell signals. This will further be illustrated below.
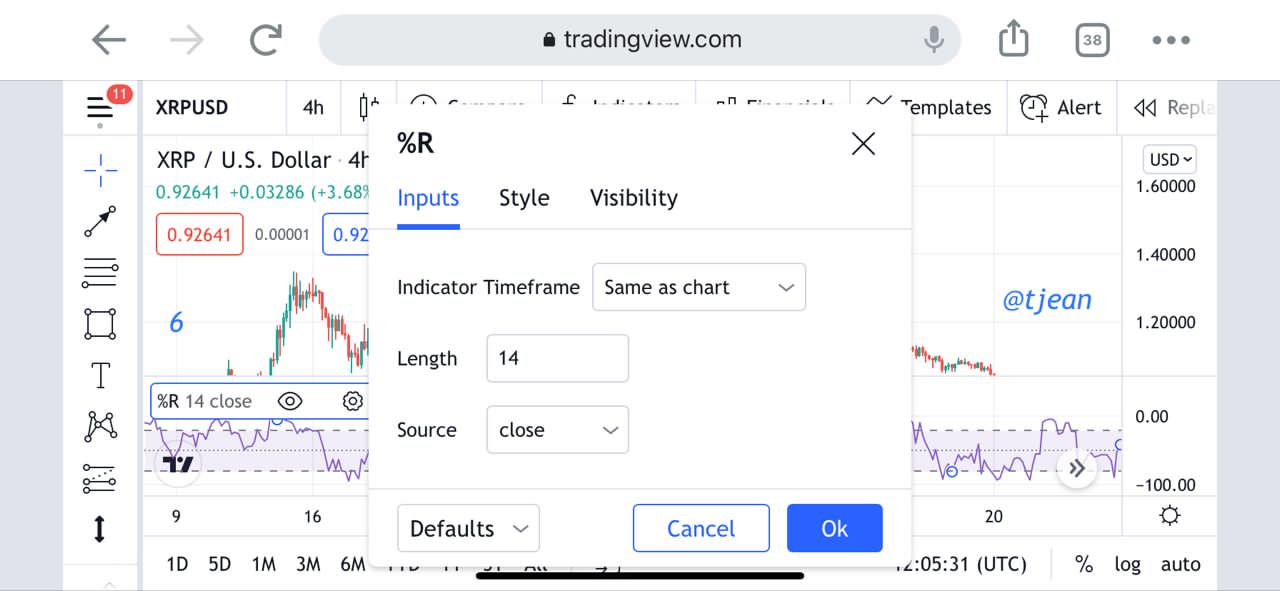
Best settings
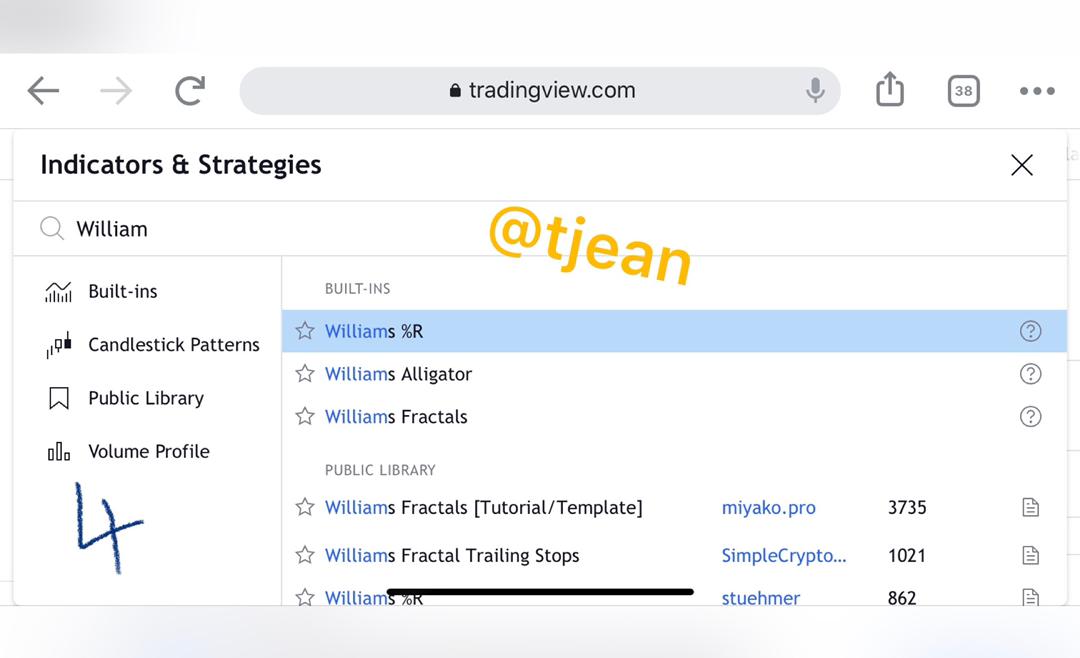
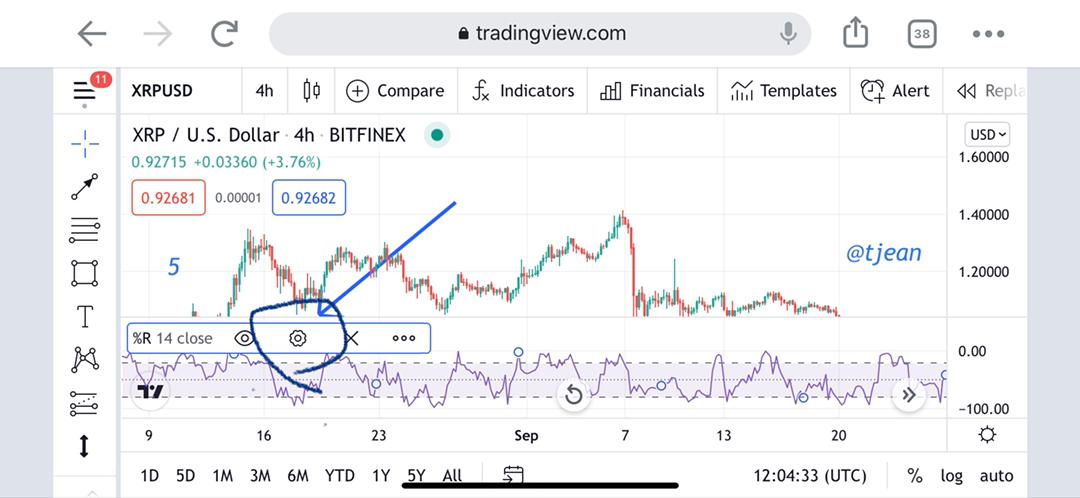
The best settings for the William percentage are the 14 period, which are actually the default settings of the William %R Indicator.
We can configure in the following steps, we enter the trading view platform, and click on the indicator tab and search for the William %R as shown in the sreenshots below.

Interpretation of overbought and oversold signals.
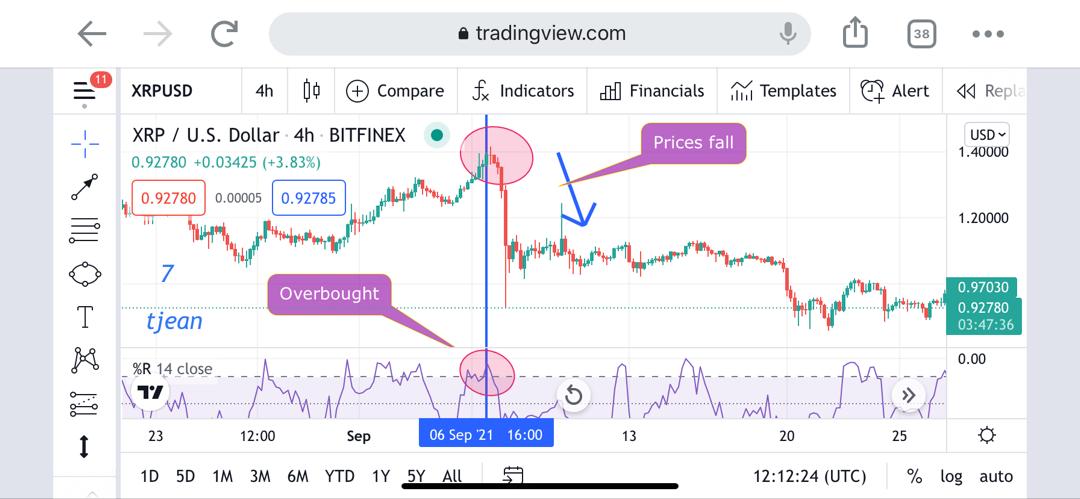
a)Interpretation of Overbought
Interpreting the overbought signals from the William %R Indicator is quite simple and straight forward. The overbought condition is shown when the prices are between the -20 and 0 levels. The overbought condition is caused by the fatigue in purchasing a particular asset. After buyers have bought a particular asset for a long time, they become tired while sellers start dominating the market. We can easily spot this using the William %R Indicator, but we have to bear in mind that we need to wait for the indicator line should show a reversal by at least crossing the -20 level before we enter a position as prices turn to remain in the overbought position for a long time at times. This is illustrated in the screenshot below.
Interpretation of Oversold
Interpreting the oversold signals from the William %R Indicator is quite simple and straight forward just as above. The oversold condition is shown when the prices are between the -80 and 100 levels. The oversold condition is caused by the fatigue in purchasing a particular asset just as in the case of the overbought. After sellers have sold a particular asset for a long time, they become tired while buyers start dominating the market. We can easily spot this using the William %R Indicator, but we have to bear in mind that we need to wait for the indicator line should show a reversal by at least crossing the -80 level again before we enter a position as prices can remain in the oversold region for a long time.
Failure Swings
Failure swings are seen as a scenario in which the prices reversal before the indicator shows the overbought and oversold regions. We actually have the formation of the failure swing in two scenarios which are in bullish and in the bearish trends which I will be explaining below.
In a Bullish failure swing
In a bullish trend, we see the formation of a failure swing when the indicator fails to rise above the -20 level while during a bullish rally. This shows the weakness of the momentum it is currently undertaking. This can be taken into an advantage by placing a sell order; this is demonstrated in the screenshot below.
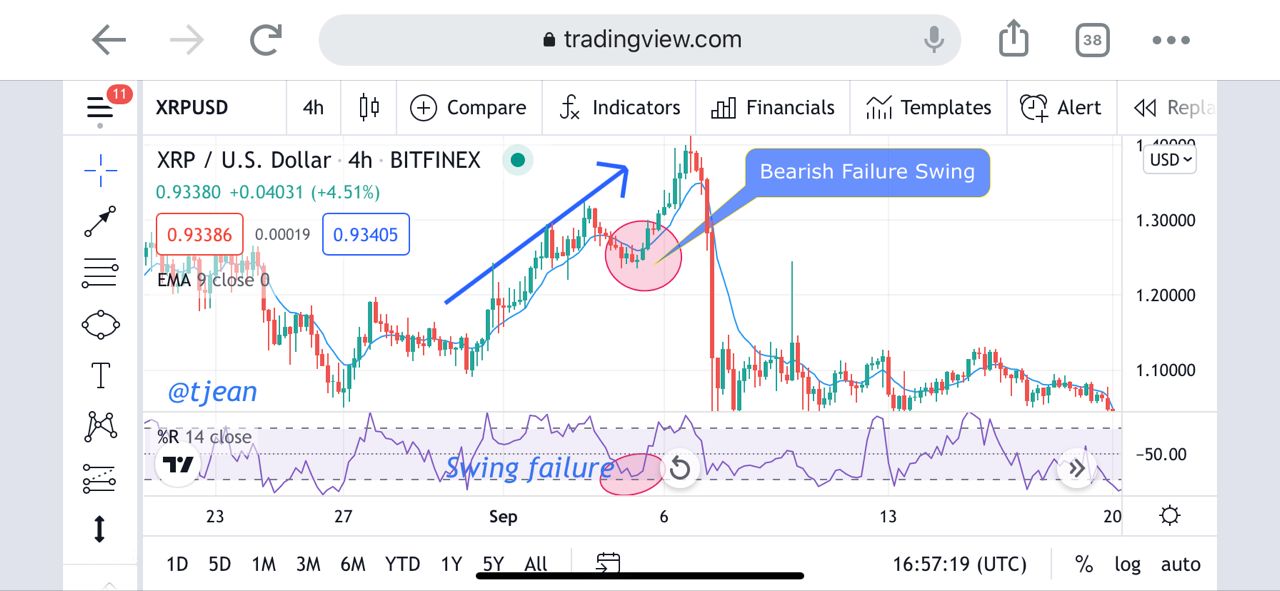
In a Bearish failure swing
In a bearish trend, we see the formation of a failure swing when the indicator fails to fall below -80 levels while in a bearish rally. This shows the weakness of the momentum it is currently undertaking. This can be taken into an advantage by placing a buy order; this is demonstrated in the screenshot below.
Using the Bearish and Bullish Divergence with the William %R Indicator
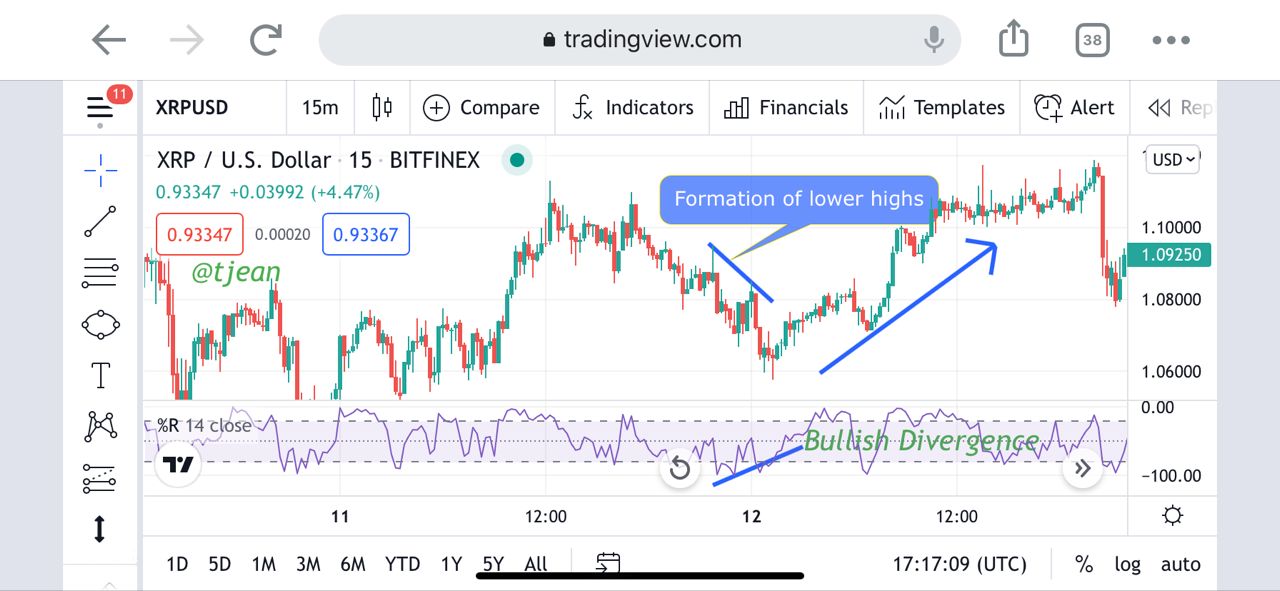
a) Bullish Divergence
The bullish divergence is known to be a great buying opportunity in its formation, the bullish divergence occurs when the prices falls with the formation of lower highs while the William %R indicator shows an uptrend with the formation higher lows which shows a weakness among sellers. This formation signals a trend reversal which is a great buying opportunity. This is explained in the screenshot below.
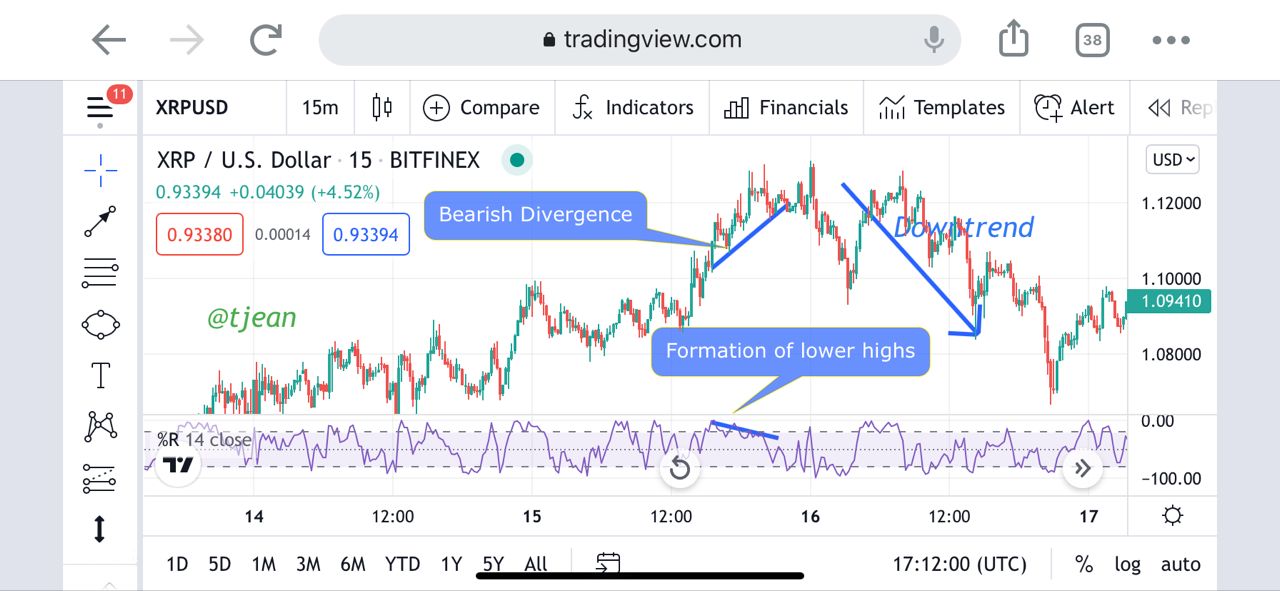
b) Bearish Divergence
The bearish divergence is known to be a great selling opportunity in its formation, the bearish divergence occurs when the prices rise with the formation of higher lows while the William %R indicator shows a downtrend with the formation lower highs which shows a weakness among buyers. This formation signals a trend reversal which is a great selling opportunity. This is explained in the screenshot below.
Spotting Trends using Williams %R Indicator
Spotting trends using the Williams %R is quite simple, but the problem encountered is the filtering out false signals. The indicator does not normally provide 100% sure signals, as it does alongside many fake signals. This can actually be filtered through the usage Confluence which is the use of more than one indicator to confirm an entry position.
Using just the Williams %R indicator, we will be just be identifying overbought and oversold regions as previously explained above.
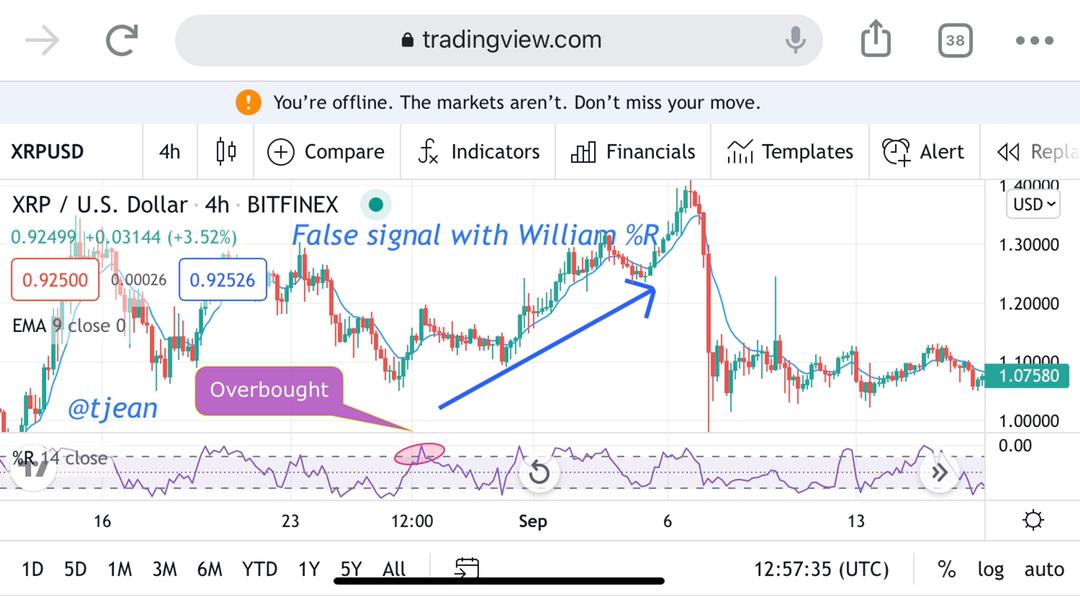
False Signals
We see the false signals shown by the William %R below. We can filter out with the usage of other indicators such as the exponential moving averages, Bollinger bands, ichimoku kinko hyo and others.
Filtering with the usage of Exponential Moving Average
I will be leaving the setting of the indicators to default which are the 14 period in the case of the William %R and …
This is shown in the chart below
QUESTION 6
Use the chart of any pair to present the various signals from the Williams %R indicator
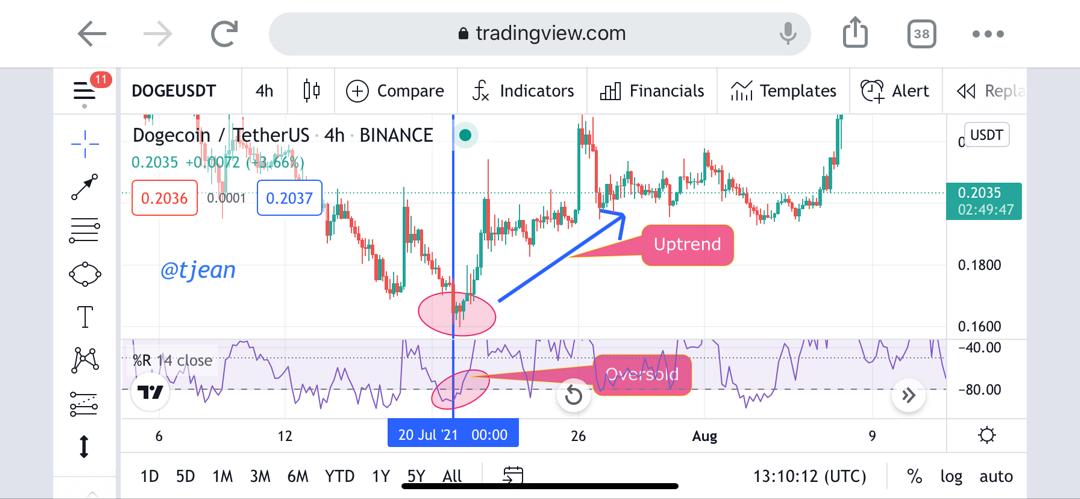
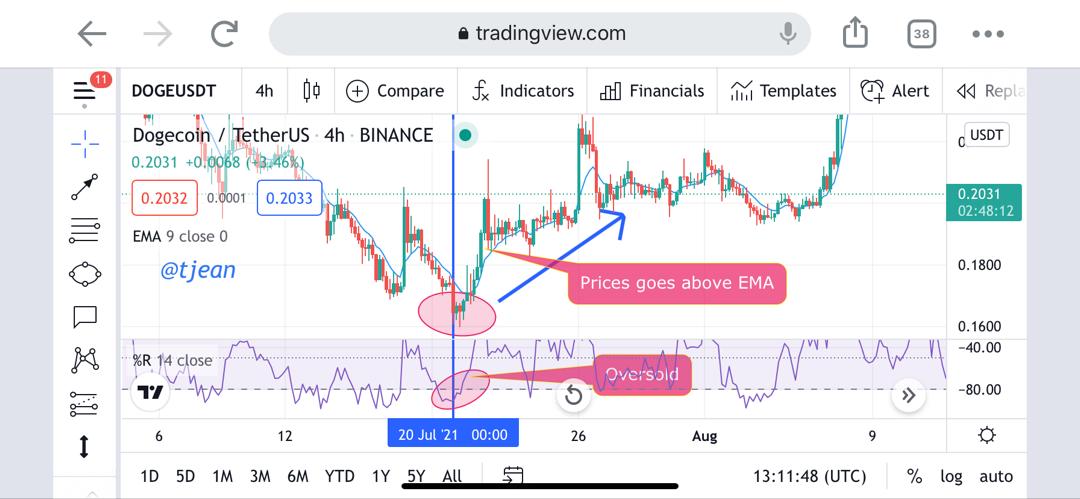
Buying the doge/usdt crytocurrency using the Williams %R
Trade Entry
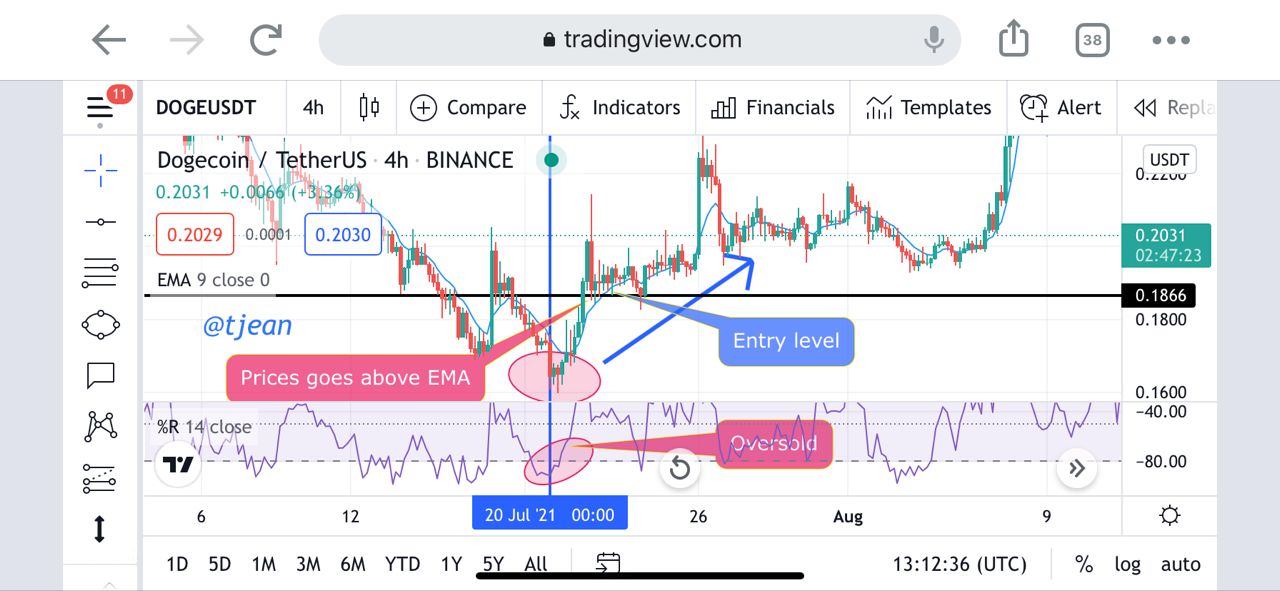
For trade entry, I will be using the William %R indicator and for further confirmation with the Exponential Moving Average. For the entry I watch the William %R, go beyond the -80 level and finally reversing to cross the -80 again. For further confirmation, I watch the prices go above the exponential moving average. This is shown in the screenshot below.
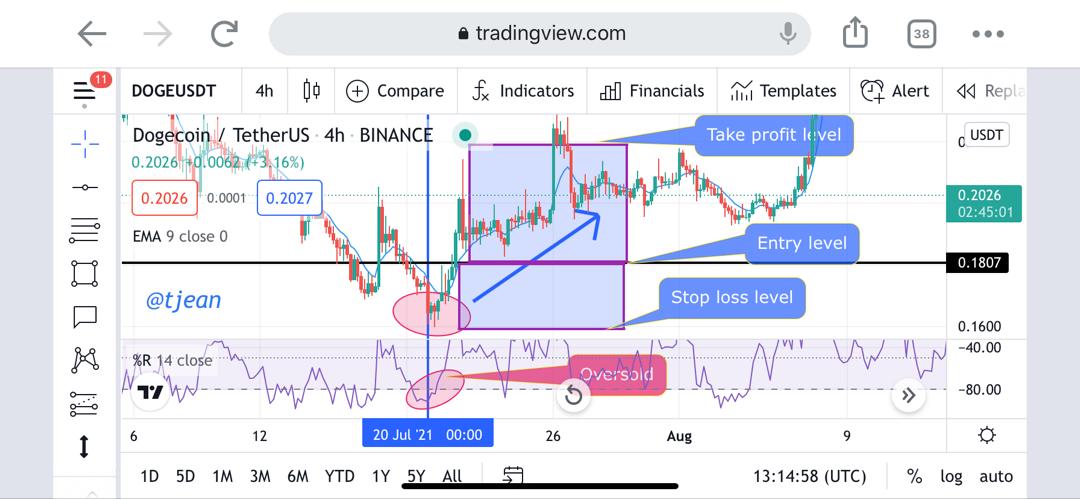
Trade Exit
Exiting the trade is about setting proper stop loss and take profit levels. The stop loss level set below the moving average while I will be setting this to a risk to reward ratio of 1:1
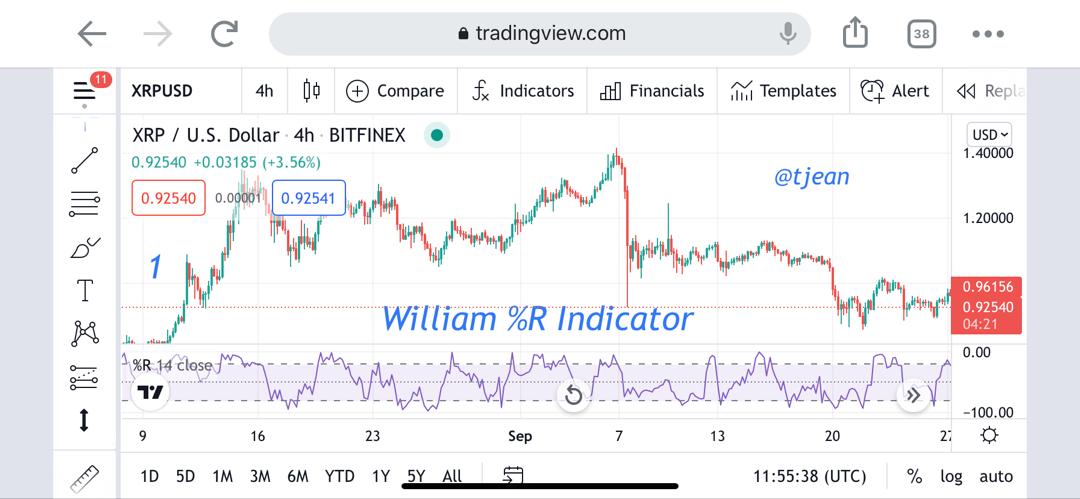
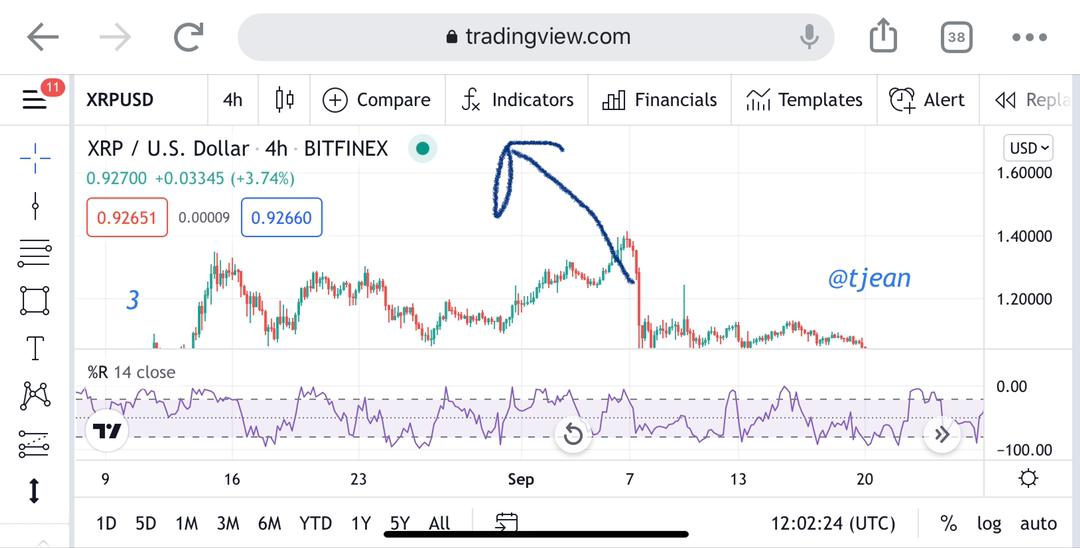
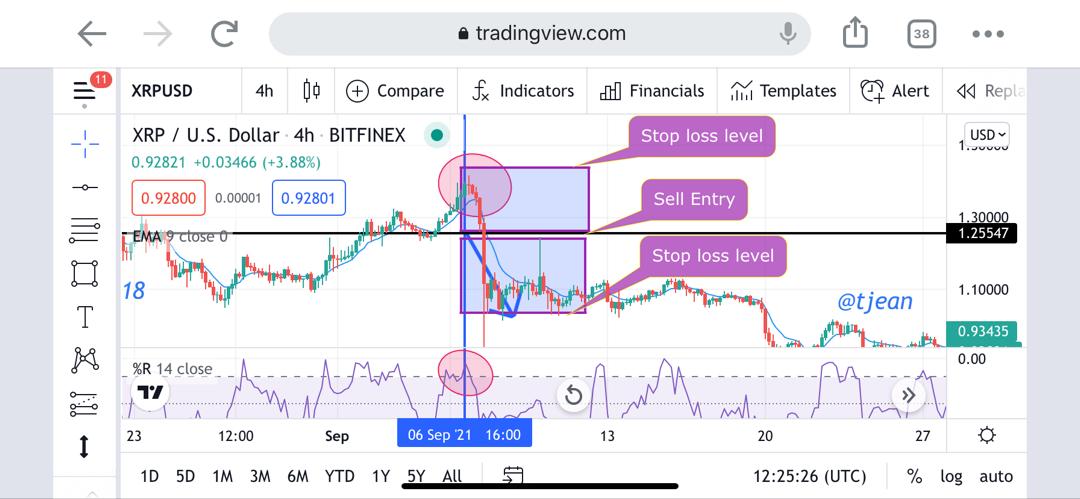
Selling the xrp/usd cryptocurrency using the Williams %R
Trade Entry
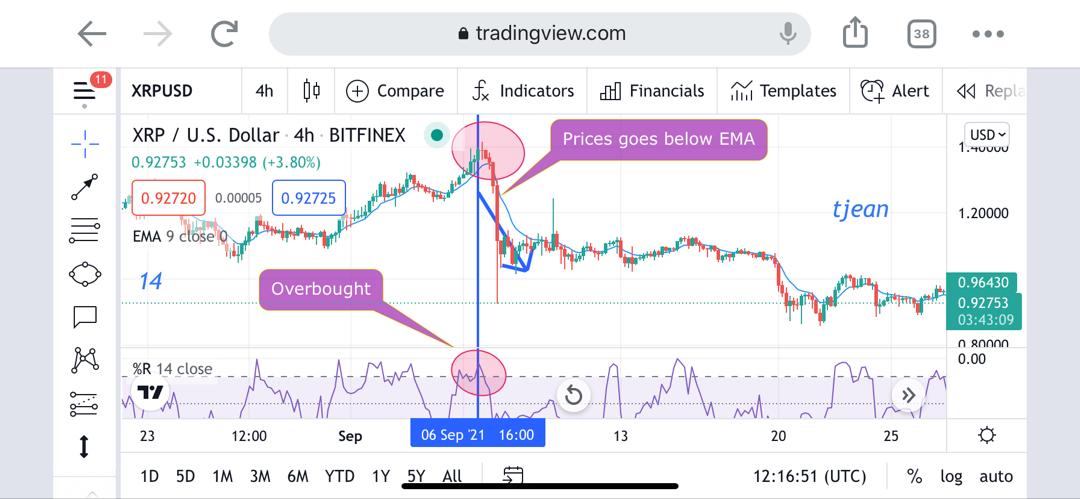
For trade entry, I will be using the William %R indicator and for further confirmation with the Exponential Moving Average just as above. For the entry I watch the William %R, go above the -20 level and finally reversing to cross the -20 again. For further confirmation, I watch the prices go below the exponential moving average. This is shown in the screenshot below.
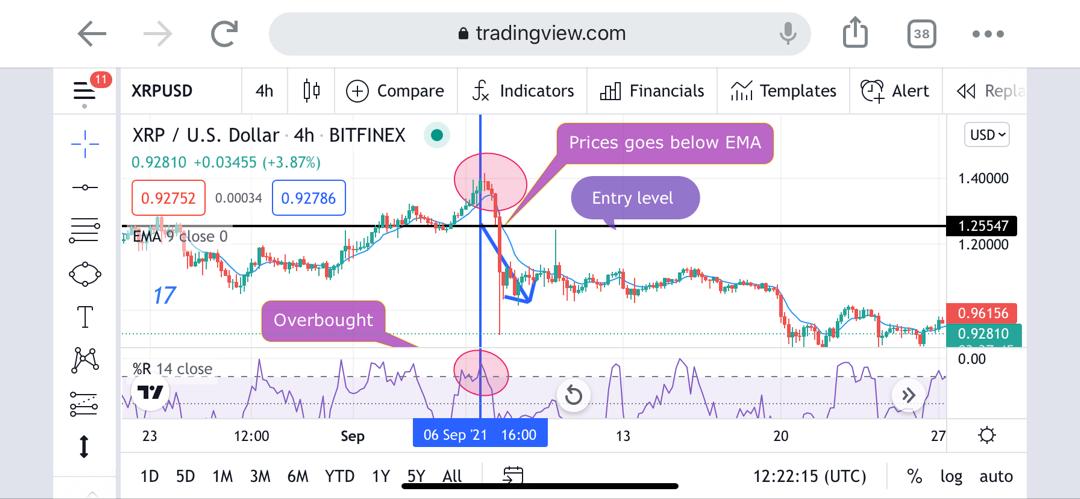
Trade Exit
Exiting the trade is about setting proper stop loss and takes profit levels. The stop loss level set below the moving average while I will be setting this to a risk to reward ratio of 1:1
Conclusion
The William %R indicator is a technical indicator in which we use to find potential overbought and oversold regions. With the usage of the William %R indicator, we can find good buying and selling entries especially with the usage of bullish and bearish divergence and alongside other indicators such as the Bollinger bands indicator and the exponential moving averages.
Hello @tjean,
Thank you for participating in the 4th Week Crypto Course in its 4th season and for your efforts to complete the suggested tasks, you deserve a Total|8/10 rating, according to the following scale:
My review :
Good article in which you were able to answer most of the questions ably, and you have some notes that you wrote.
Thanks again for your effort, and we look forward to reading your next work.
Sincerely,@kouba01