[Intermediate Course] Steemit Crypto Academy Season 5 Week 6 | Trading With BICHI Indicative Strategy | Introducing IDX
Heading - Trading with bichi strategy, Learn about Cryto IDX and Altcoins IDX
Hello steemians how are you? I hope you all are doing well and you all are safe and healthy during this pandemic time.
This is the Third Homework task made by me as a professor in the steemitcryptoacademy and this homework is for the intermediate level students.

So today I will give you a quick review about a strategy named as Bichi strategy. This strategy is created by myself and I really love to use this strategy in cryptocurrency market. In this post we will discuss about its uniqueness that why this strategy is unique and also we will discuss about its trends, entry and exit points and also we will see how trading become more valuable and easy with strategy.
BICHI STRATEGY
Bichi strategy is nothing but the combination of Bollinger bands and ichimoku clouds. Bollinger+ichimoku=Bichi strategy. Both are the technical indicators and are used to analyse momentum and strength in the market. On one hand Bollinger band provide support and resistance to price with moving basis line and on the other hand ichimoku clouds provide future price movements. Whether the price move uptrend or downtrend. So by combining these two together we came up with a new strategy Bichi in which these two Indicators provide 80% accurate entry points in the market. The only disadvantage of this strategy is that you can only take entry in the market when you see cloud breakout. This disadvantage is nothing but the biggest advantage for the traders who like to trade patiently and seriously. If you know What is the role of these two indicators in market then it's good enough but if you don't know then go to these posts.
Ichimoku, Bollinger band.
Analysis Trend using Bichi strategy:
We use many different indicators, patterns and graphs to analyse trends in the market. Now using Bichi strategy it become more easy to analyse trends in the market. Let us focus on how to analyse uptrend in the market. Once you get clear understanding of uptrend, you can easily analyse downtrend in the market using inverse of uptrend.
Uptrend:
First check whether the Bollinger bands is proving resistance and support to the price or not. If yes. Then wait for the candles to break the cloud and move up, In this situation the basis line of Bollinger bands provide support to the price to push up. Once the cloud Break and basis provide support to the price we can analyse and see uptrend in the market.
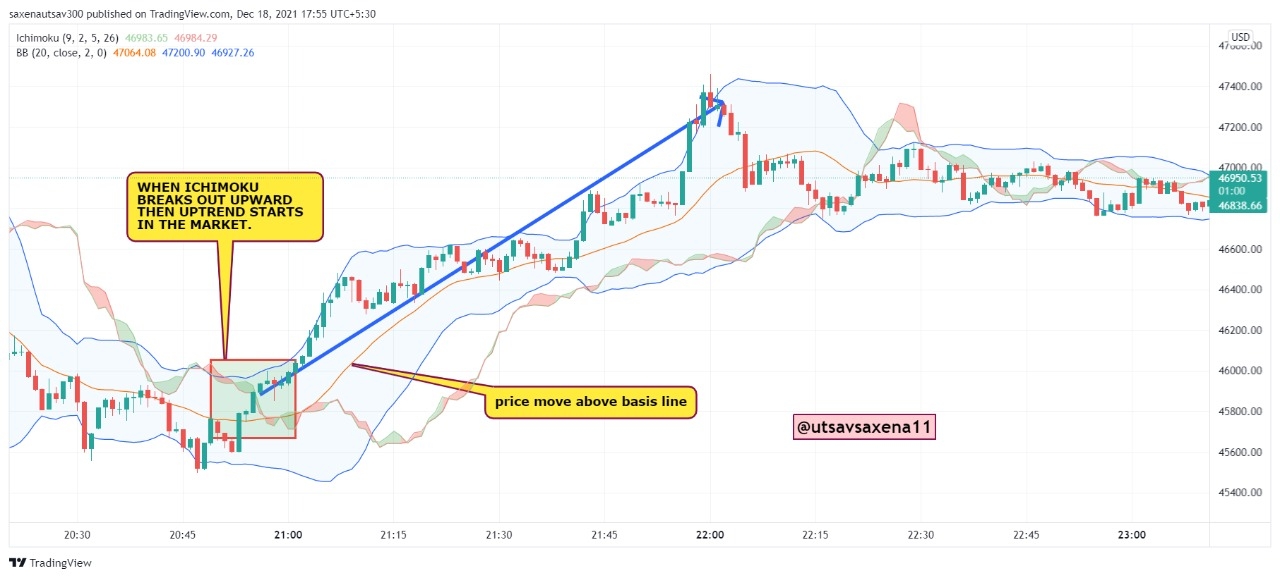
As you can see in the above BTCUSD chart of 15 mins time frame that Bollinger bands provide support and resistance to price and basis line of Bollinger bands provide support to candle. When candle Break the ichimoku cloud the uptrend in the market occur.
In the same way we can analyse downtrend in the market using inverse strategy of uptrend.
Now in next article let us discuss about how we can analyse trend reversal in the market using this strategy.
Trend reversal using Bichi strategy:
We have already discussed trend reversal in many of our homework posts and we know that when candle change its Direction of moment then we say that trend reversal in the market. Now let us see how we can identify trend reversal in the market using Bichi strategy.
Changing Trend from downtrend to uptrend:
To identify trend reversal in the market using Bichi strategy, we always have to consider Bollinger band. When Bollinger bands and price movement is down then soon after that market will move sideways with Bollinger band and at this time price breaks inchimoku clouds several times. Then these two situations is the clear indication of Trend reversal in the market and we can see uptrend after end of sideways market.
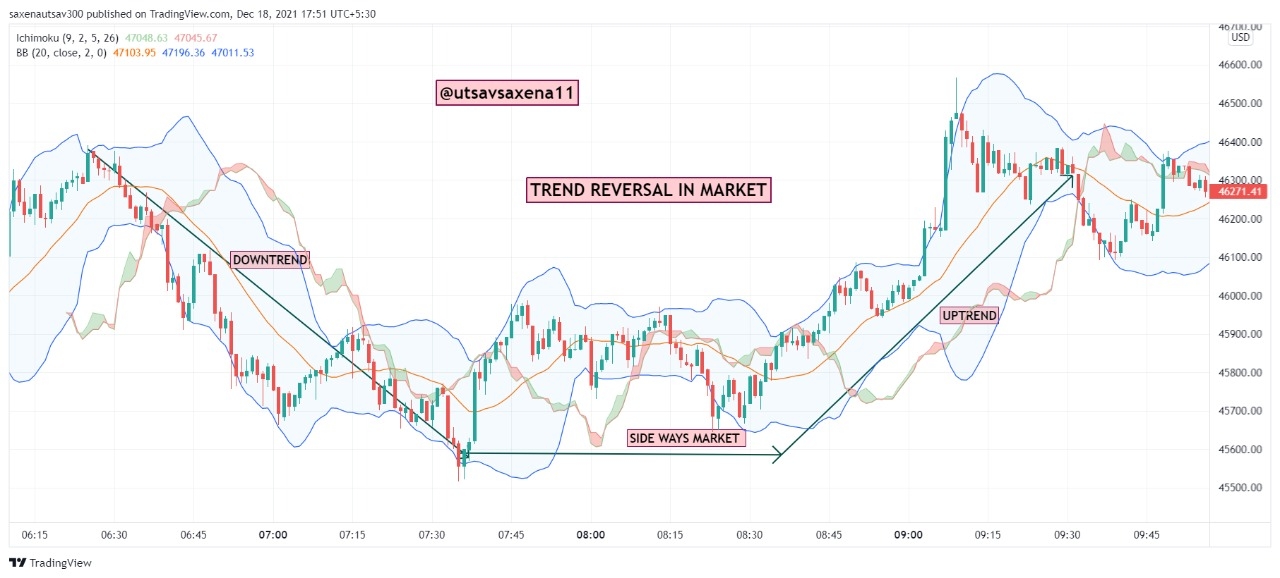
As you can see in the above BTCUSD chart market move downtrend and in sideways market candle break ichimoku several times. These two indicates trend reversal and we can see uptrend in market of BTCUSD.
This is how we can identify trend reversal in both direction from Downtrend to uptrend and from uptrend to downtrend easily using this strategy.
Now let us discuss how to take entry and exit in the market using Bichi strategy.
Buying and selling trades using Bichi strategy:
In previous lecture we already discussed about several different ways in which we take entry and exit from market. This time we are taking Entry and Exit trades in the market using bhich strategy.
Buying Trade :
First we have to analyse uptrend that is price is above Bollinger band basis that is basis line provide support to price, when it provide support to the price then wait for the price to Break the ichimoku cloud, when price Break ichimoku cloud and move upward then on next candle take the buy trade and apply Stop Loss and take profit. Remember that your stop loss level must touch your support basis level.
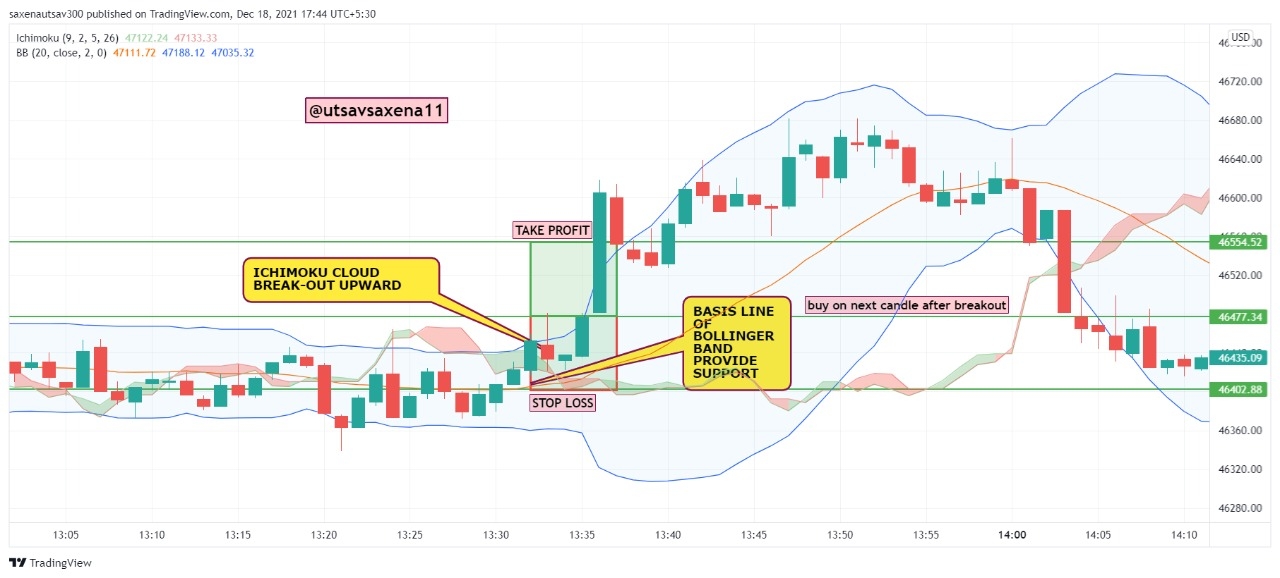
In the above chart we apply trade set up using this strategy and we can see take profit hits out in the market. This is how we take entry in the market.
Selling trade :
First we have to analyse downtrend that is price is below Bollinger band basis that is basis line provide resistance to price, when it provide resistance to the price then wait for the price to Break the ichimoku cloud, when price Break ichimoku cloud and move downward then on next candle take the sell trade and apply Stop Loss and take profit. Remember that your stop loss level must touch your resistance basis level.
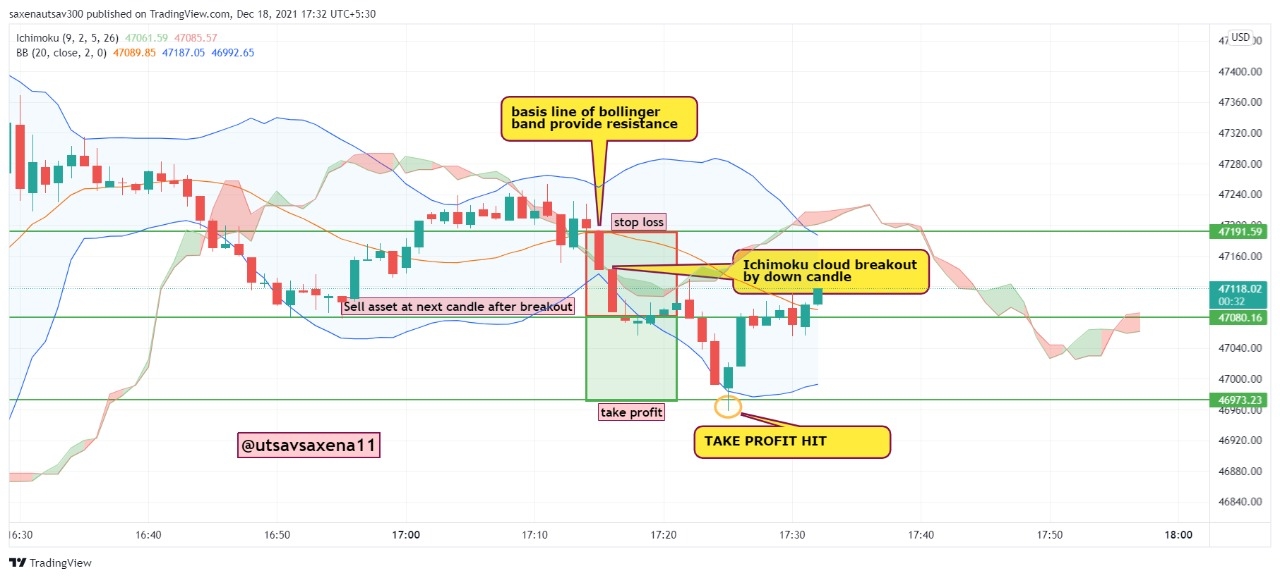
In the above chart we apply trade set up using this strategy and we can see take profit hits out in the market. This is how we take exit in the market.
This is how we take entry and exit from the market using Bichi strategy. Now let us discuss few important points which are required while trading in market using this strategy.
Choose short time frame starting from 1 min to 30 mins because this strategy works best in intraday and prediction trading.
Be patient while using This strategy because you have to wait for basis support and resistance. As well as break out. Remember breakout level and basis level be close to each other. If basis level I'd very far then don't take trade on that level because it will make your stop loss very large.
Use by default settings of both indicators. There is no need to change but if you want to use any other length you can use it.
These are the three main tips that one required while trading using Bichi strategy.
This is all about my bichi strategy for trading. Remaining part of this strategy we will discuss in homework assignment. Now moving further let us discuss briefly about Cryto IDX and Altcoins IDX. These are the basic index which are created on some platform for trading. Let us discuss them briefly.
Cryto IDX
Crypto IDX is nothing but the combination of 4 cryptocurrency or we can say it is the average of 4 crypto-currencies. It is known as Cryptocurrency Index. It consists of average of 4 crypto-currencies that is Bitcoin, Ethereum, Litecoin and Zcash. This asset is available on binomo platform which provide signal prediction trading.
To calculate Crypto IDX we have to take average of 4 currency, but these are are quite complex and calculated through different software that you can research. Example is given below.
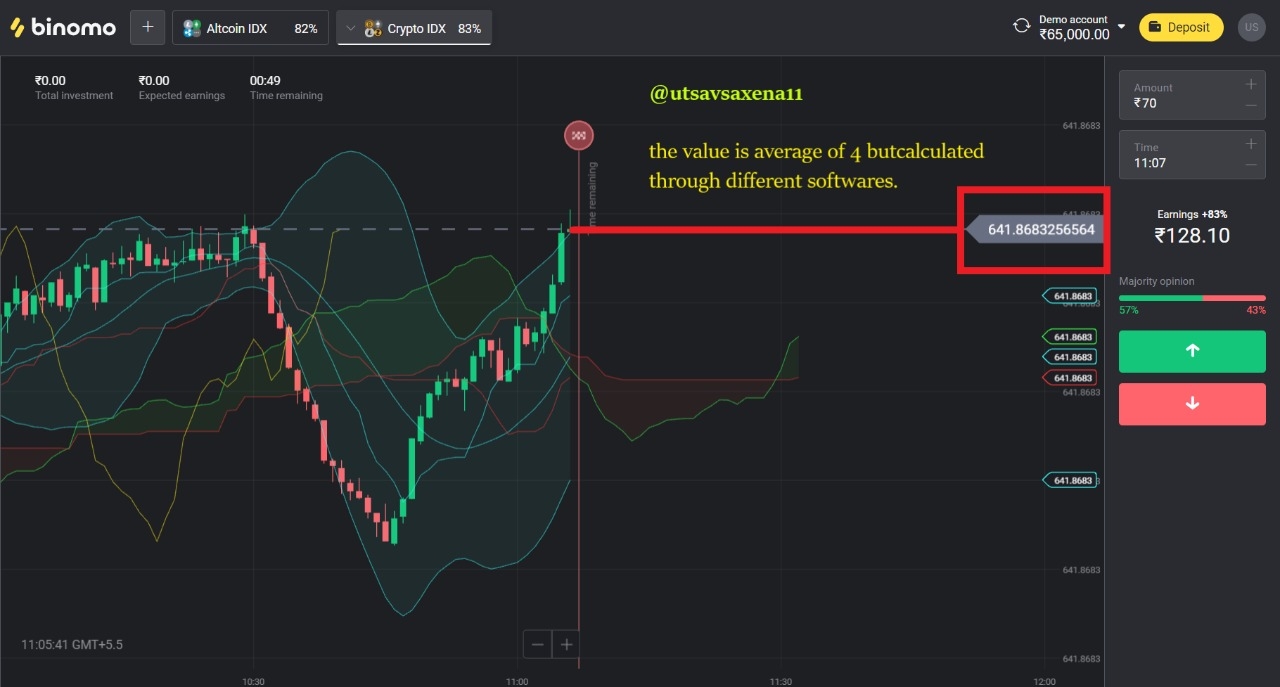
The marked value on chart is the value of crypto idx. You can see price of asset on binomo at different timeframe.
Altcoins IDX
Altcoins IDX is nothing but the combination of 4 cryptocurrency or we can say it is the average of 4 crypto-currencies. It is known as Altcoins Index. It consists of average of 4 crypto-currencies that is Ripple, Ethereum, Litecoin and Monero. This asset is available on binomo platform which provide signal prediction trading.
To calculate Altcoins IDX we have to take average of 4 currency, but these are are quite complex and calculated through different software that you can research. Example is given below.
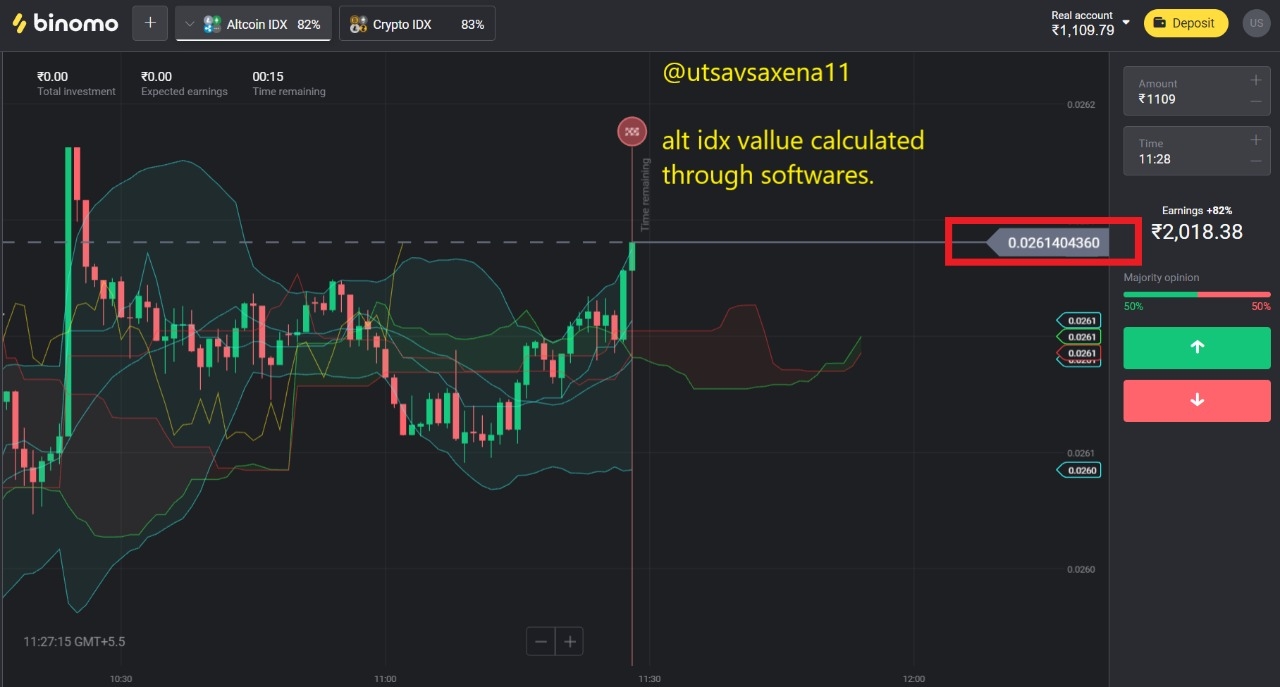
The marked value on chart is the value of Altcoin idx. You can see price of asset on binomo at different timeframe.
Conclusion
It is time to conclude our homework post in which we discuss about Bichi strategy that consists of two main indicators that is the ichimoku indicator and the bollinger band. By the combination of these two indicators we can easily enter and take exit from the market. This strategy is created by me and have 80% success rate only if you have patience to find the correct trade in the market. This strategy work excellent on short time frame and in intraday trading too. After that we discuss about crypto idx and altcoin idx which is the average of 4 currencies. This average is not the the simplest average pata complex average that is calculated through different softwares on different platforms. Binomo is one of the platform that provide these assets.
This Homework post is very small and very easy. We discuss about Bichi strategy and 2 types of assets briefly. Now it's time for the assignment questions. Before submitting your homework post read guidelines carefully, in this homework assignment is very very easy so maximum chances of loosing marks is in presentation. So read the guidelines carefully.
Homework Assignment
Question 1:
Give a detailed analysis of BICHI STRATEGY. Staring from introduction, identification of trends, trend reversal in market, entry and exit from the market, one demo trade and finally your opinion about this strategy. (Screenshot required). [4 points]
Question 2:
Define briefly Crypto IDX and Altcoins IDX. What is signal prediction trading. Is it legal or ill-legal in your country. (Explain briefly) [2points]
Question 3:
If you want to create your own penny IDX, then which 4 penny assets will you choose and what what is the reason behind choosing those four assets. Define Penny currencies.(Explain, no screenshot required). [2points]
Question 4:
Conclusion
Homework Rules and Guidelines
Read all the given guidelines and instructions carefully.
Homework assignments must be posted in the community Steemit Crypto Academy.
THERE WILL BE NO APOLOGY FOR PLAGIARISM IN STEEMITCRYPTOACADEMY.
According to the latest rules, only people who are actively participating in the #club5050 are eligible to take part in Crypto Academy homework assignments. check your eligibility before uploading the homework post. #club5050 status (last one month) is a prerequisite to participating in this homework task. The minimum threshold for Club5050 is 150 SP power up in the last one month regardless of the payout and earning. This is applicable for both active and inactive users. The upper threshold is subject to your cashout and earning for the specified period(i.e. last one month).
Post title must be written in the format "Bichi Indicative Strategy- Steemit Crypto Academy- S5W6-Homework post for @utsavsaxena11. "
The minimum reputation to take this class is 60.
The minimum Steem Power that must be owned is 600 SP. (Not including delegated)
Accounts that are powering down are not allowed to take this class.
The minimum number of words in the post is 500 words.
Use images that are Copyright-free and list the source of these images.
All screenshots taken must be given a watermark that includes your username.
Put the tag #utsav-s5week6, and #cryptoacademy in the first 5 tags of the post.
User must include their respective country tags in the homework assignments.
Do proofreading before uploading your homework post and check tags 2-3 times.
Put the task link in the comments column if it has not been rated for 2 days or more.
Justifying the text is necessary and the users from India are requested to add #India as one of the tags.
All these guidelines will effect your marks in presentation and originality. So read it carefully. If you don't use your country tag before submission Then 100% you will loose marks.
If you have any doubt in the assignment given, feel free to ask it in the comment section below.
Homework assignments deadline is until December 25th 2021 at 23:59 UTC.
CC:
@steemitblog
@steemcurator01
@steemcurator02

Beautiful lecture, I look forward to submitting my post
Thankyou and wish you good luck
Wonderful lecture, I am gonna do it.
All the best
Gracias por la clase profesor, estaré realizándola pero tengo un duda.
Esa es la configuración que esta utilizando usted? porque al momento de colocar el gráfico note que no se ven igual y pensé que en debería ser la configuración, espero responda pronto.
La configuración original es esta.
Use the settings which is by default set on your indicator.
Muchas gracias por su respuesta profesor
Professor it has been 2 days and post didnt got rated please have a look at it.
https://steemit.com/hive-108451/@hibbanbilal/bichi-indicative-strategy-steemit-crypto-academy-s5w6-homework-post-for-utsavsaxena11
I will go through it soon..