Steemit crypto Academy season 4 Beginners course-Task10:candlestick patterns
In your own words, explain the candlestick patterns and their importance in carrying out effective technical analysis.
(b) In your words, explain the psychology behind the formation of the following candlestick patterns.
-Bullish engulfing candlestick patterns
-Doji candlestick patterns
-The Hammer candlestick pattern
-The morning and Evening star candlestick pattern
-The Harami candlestick pattern
Introduction
Cryptocurrencies are binary data designed for the purpose of digital exchange. Investing in the crypto industry could be a disaster without proper education or knowledge of the basics of how the market behaves. So, it is very crucial to learn the basics of technical analysis, which involves learning about candlesticks, candlestick charts, and candlestick patterns, and understanding the psychology behind their formation.
Let's dive right in!
In your words, explain the candlestick patterns and their importance in carrying out effective technical analysis.
To explain the candlestick pattern, let's take some time off to explain the fundamentals that ultimately leads to a candlestick pattern, i.e. candlestick and candlestick chart.
CANDLESTICK
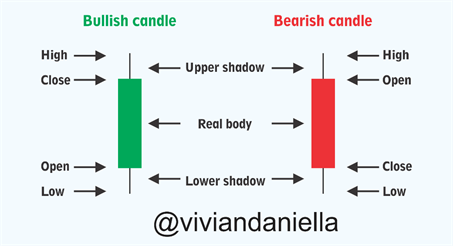
A candlestick represents or shows the relationship between buyers and sellers and their impact on price movement in the market. A candlestick is generally made up of four parts:
✓✓✓ - Open
✓✓✓ - Close
✓✓✓ - High
✓✓✓ - Low
CANDLESTICK CHART
A Candlestick chart is the graphical representation of several candlesticks that could be used in making a judgement in reference to candlestick patterns. It shows the interactions between buyers and sellers, how they influence the movement of prices over a given period of time. The Candlestick chart helps traders study the behaviour of the market in the past and predict how it will behave in the future.

CANDLESTICK PATTERN
A candlestick pattern is a graphical representation of a price movement on a candlestick chart that could be used to predict a market movement and carry out a technical analysis of the market.
According to this Wikipedia article, two common candlestick patterns exist:
- Simple candlestick pattern: This candlestick pattern usually consists of a single candlestick signalling a specific event on the candlestick chart. Here, a candlestick is examined as a single entity, e.g. black body candlestick pattern.
- Complex candlestick patterns: These candlestick patterns are formed by two or more candlesticks which are examined in a composite manner during technical analysis, e.g. bearish harami candlestick pattern.
Importance of Candlestick Patterns in Technical Analysis
The use of candlestick patterns to analyze the behaviour or movement of price in a marker helps traders make effective and reliable decisions. Understanding candlestick patterns is a form of technical analysis which involves using the prices shown on a candlestick chart to predict market movement. Reading and understanding candlestick patterns is very vital in making effective trading decisions.
Understanding the psychology of candlestick patterns and how they are formed is one important aspect of technical analysis.
There are different (many) types of candlestick patterns that aid in decision making as regards trading and studying them will equip and guide the trader towards making brilliant trading decisions.

In your own words, explain the psychology behind the formation of the following candlestick patterns.
✓✓✓ - Bullish engulfing candlestick pattern
✓✓✓ - Doji candlestick pattern
✓✓✓ - The Hammer candlestick pattern
✓✓✓ - The Morning and Evening star candlestick pattern
✓✓✓ - The Harami candlestick pattern
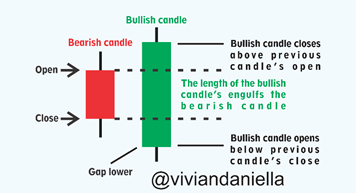
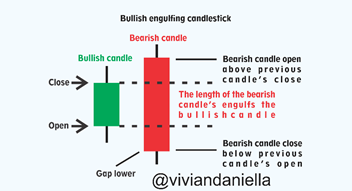
BULLISH ENGULFING CANDLESTICK PATTERN
The bullish engulfing candlestick forms when buyers are in control of the price in the market. A bullish engulfing candlestick is formed when a strong bullish candlestick appears after a small bearish candlestick, thus engulfing it. When this happens, it signals a reversal in the opposite direction. A bearish engulfing candlestick occurs in an uptrend when a bearish candlestick appears after a small bullish candle. The psychology behind the bearish candlestick shows that buyers were in control of the price, but after some time, they were unable to push the price up, then sellers came in and pushed the price downwards, causing a reversal.
DOJI CANDLESTICK PATTERN
This is also an important candlestick pattern traders watch out for. The Doji represents indecision or doubt in the market.
'Doji', which means error or mistake in Japanese, shows that there are inconsistencies of confusion between buyers and sellers in the market and that leads to the opening and closing of prices at the same point. It also shows that neither buyers nor sellers are in control of the market price.
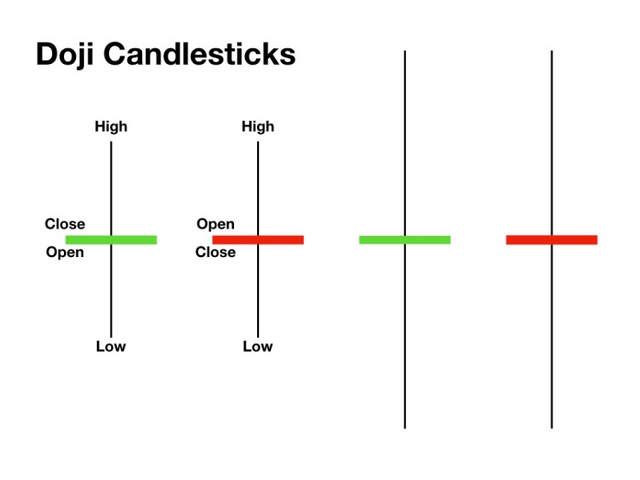
Dragon Doji: This is a bullish reversal candlestick pattern and when it appears in a downward trend, it indicates a reversal in price.
Gravestone Doji: This is a bearish candlestick pattern that indicates a reversal if formed in an uptrend.
Long-legged Doji: This is a candlestick pattern that consists of a longer upper shadow (wick) and a long lower shadow. The price opens and closes almost or exactly at the same point, leading to a small body.
The doji candlestick is significant sometimes and other times insignificant. Traders sometimes take action on a one-candle pattern and sometimes wait to see what happens after the formation of a doji.
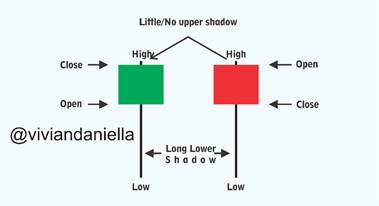
HAMMER CANDLESTICK PATTERN
The hammer is a bullish reversal candlestick trading pattern that shows when the market or stock reaches its bottom. A hammer candlestick resembles a ‘T’ and can be spotted at the bottom of a downtrend. The hammer candlestick is very useful when it appears at the support and resistance levels. It has a long shadow, which indicates a strong rejection of the price by the buyers. An inverted hammer candlestick is also called a ‘bearish pattern of the hammer', which has its low, open and close almost at the same price. When an inverted hammer appears in an uptrend, it normally indicates a reversal to the opposite side. This tells the trader that within a certain period, buyers were in control of the price, pushing it upwards before sellers came in and pushed it downward, forming a long candle shadow (wick).
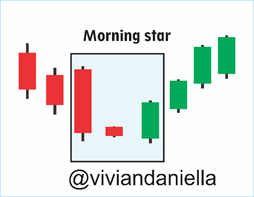
MORNING STAR CANDLESTICK PATTERN
The Morning star candlestick pattern involves the use of three candlesticks, usually a bearish candlestick, a doji candlestick, followed by a bullish candlestick.
The first bearish candlestick shows that sellers are in control of the market price.
The second candlestick, which is the Doji candlestick, indicates weakness, since sellers can not push the price down, which shows that a reversal is likely to happen.
The third candlestick is a bullish candlestick engulfing the Doji, showing that buyers are in control of the market price, leading to an uptrend.
To verify whether a morning star is reliable or not, some traders compare the body size of the third candlestick to the size of the first candlestick. If the third candlestick is more than halfway the first candlestick, then it is valid.
The psychology behind the formation of a morning star pattern shows that at a certain period, sellers were in control of the price before buyers came in, pushing the price upwards.
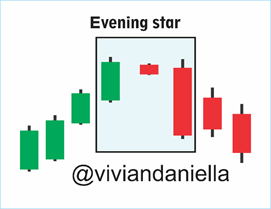
EVENING STAR CANDLESTICK PATTERN
This candlestick pattern is the opposite of the Morning Star candlestick pattern. This is a bearish strong reversal pattern in an uptrend market. It is also made of three candlestick patterns.
First, a strong bullish candlestick indicates that buyers are controlling the price of the market.
Second, a small Doji candlestick indicates weakness and the inability of buyers to push the price upwards, creating an opportunity for a reversal.
Third, a strong bearish candle shows that sellers are in control of the market price. Thus, causing a reversal and pushing the price downwards.
The psychology behind the formation of an evening star pattern shows that at a certain period, buyers were in control of the price before sellers came in and pushed the price downwards.
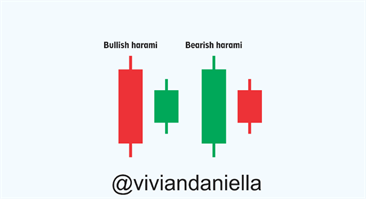
HARAMI CANDLESTICK PATTERN
This is also a candlestick pattern that helps in making trading analyses. A harami candlestick pattern gives traders signals of when the price will reverse or continue on its original path. Harami is a Japanese word that means' pregnant’. This pattern involves two candlestick patterns, making the graph look like a pregnant woman. The first is a large body candlestick followed by a small body candlestick which indicates doubt or indecisiveness between buyers and sellers. The formation of the harami candlestick pattern usually occurs after an assembly of bullish or bearish candlesticks, which is followed by the consolidation of the price for a while as buyers and sellers compete over control of the price. Harami candlestick patterns formed at the top or bottom of a trend are a trading spot for traders. It can also signal a continuation of price movement if found in the middle of a trend. When a bullish harami forms at a major support area, it is a bullish reversal. When a bearish form forms at a major resistance level, it is a bearish reversal candlestick.
Additional Information on Candlestick Pattern Analysis
We have talked about candlesticks, candlestick charts, candlestick patterns and the psychology behind them, but knowing these things does not mean you jump in and start trading. The Candlestick patterns analysis works best when used along with other tools for technical analysis based on the different trading styles of traders, e.g. MACD, Relative Strength Index (RSI), Stochastic Oscillator, Average Directional Index etc.
CONCLUSION
Making good trading decisions requires that you learn and understand various trading patterns and how to analyze them. Analyzing candlestick charts, patterns, and the psychology behind their formation is one basic knowledge every amateur investor or beginner should learn and understand before venturing into cryptocurrency investments.
Unless otherwise referenced (cited), all graphics were produced by me.
Cc;
@reminiscence01
@sapwood
@imagen
@awesononso
@nane15
@dilchamo