Crypto Academy /S4W8-Homework Post for kouba01
Hello friends and welcome to my assignment task by professor @kouba01, In this assignment, I will provide a detailed review of Crypto Trading With Rate Of Change (ROC) Indicator. I hope you enjoy the class.
All images used in this post unless otherwise stated are not mine and were extracted from Tradingview, Binance, and MT5 for the purpose of this assignment.

Question one
In your own words, give an explanation of the ROC indicator with an example of how to calculate its value? And comment on the result obtained.
Before we delve into explaining how this indicator is calculated, it is important that we explain what the indicator is.
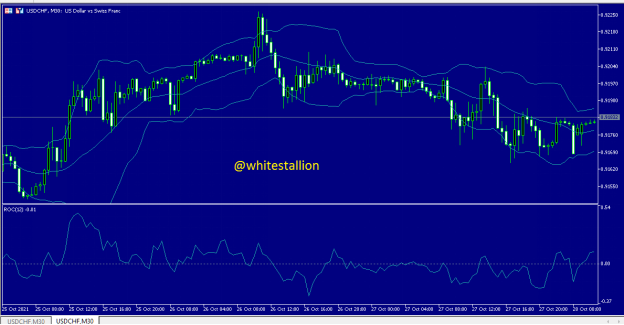
The Rate-of-Change (ROC) indicator, which is commonly known as Momentum, is pure momentum oscillator that helps calculate the percent change in the price from a specific period to the next one. Furthermore, the current price is compared to the price "x" times ago using the ROC formula. So as the ROC indicator change rises from positive to negative, the graph illustrator generates an oscillator that fluctuates above and below the zero line.
Examples of ROC signals include Centerline crossings, divergences, and overbought-oversold readings as momentum oscillators. Particularly in the short term, the centerline crossovers are prone to whipsawing, they can be utilized to detect the overall trend. So the Rate-of-Change oscillator is excellent at detecting overbought and oversold extremes.
It is calculated using a formula-
(Current Close – Close 12 periods ago) / (Close 12 periods back x 100)
The current price of BTC/USDT as of when writing this assignment was $61,932.83
The N period (12 days ago) price was $59,700.84
N=12
61,932.83 - 59,700.84 / 59,700.84 X 100
= 3.73 %
As you can see from the above calculation, there was a 3.73 ROC value indicating a bullish trend in the price which was initially $59,700.84 to $61,932.83
Demonstrate how to add the indicator to the chart on a platform other than the tradingview, highlighting how to modify the settings of the period (best setting).
To answer this question we will be considering the MT5 PC application. It is readily available for downloads online . After completing the registration process and adding a broker, you can begin to add the desired indicator following the following steps
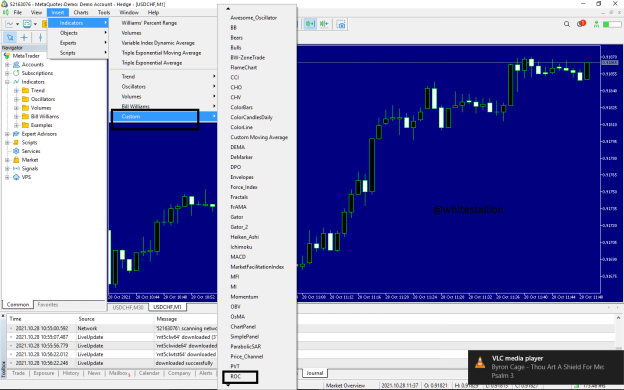
The first step in adding this indicator is by launching the MT5 application, after it loads, it will display live charts on the homepage with a variety of functions on the top of the screen.'
The next step is to locate Insert on top of the screen and click on it
- By clicking on this, it will display before you a pop up list by the right side of the screen, giving you options to choose from. Click on indicators. To proceed from here, click on Custom
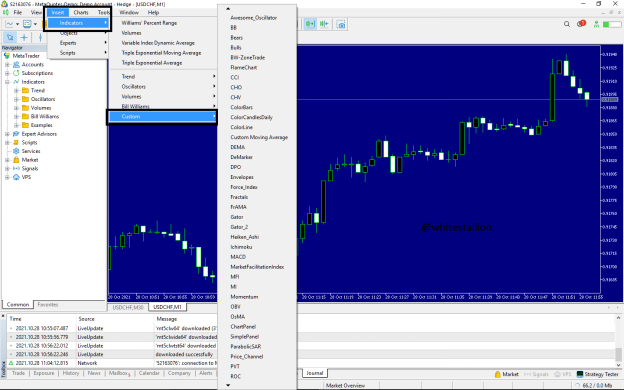
- After clicking on Custom, there will be a drop-down menu where you will choose a list of indicators.
NOTE: Sometimes, some indicators are not available by default on the app, so you would have to download and import them. Fortunately, the ROC indicator is available on the list already and what we will do is to just click on it to add it to our live chart.
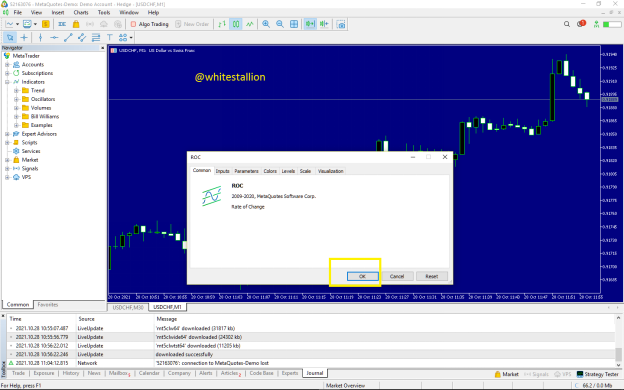
- Finally, search for the ROC indicator and click on add however, a pop up message will be displayed for you to make necessary adjustments as desired by you. After being satisfied by the settings, click on OK
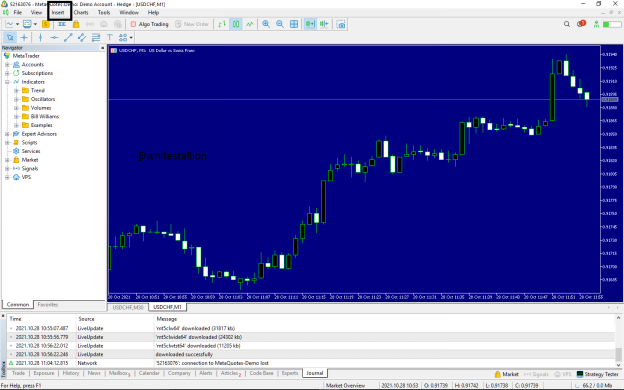
- As you can see, the indicator has been added to our chart successfully
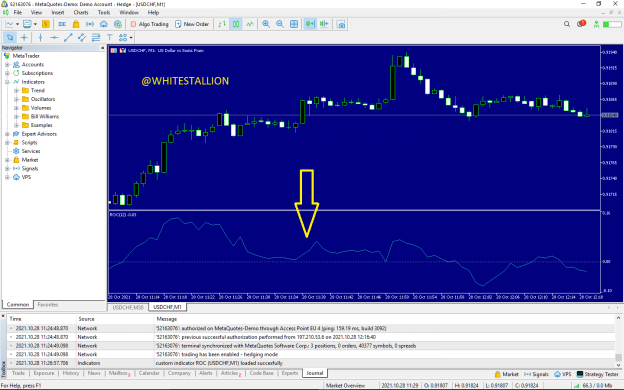
- To make modifications to the indicator, all you will need to do is to right click on the indicator and click on Indicator Properties
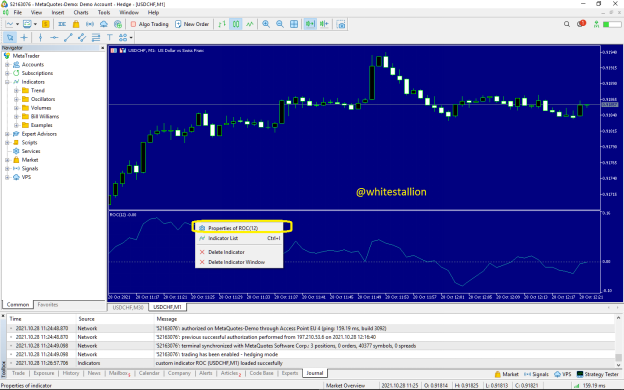
- After clicking on the Properties, you will have the chance to make modifications to the indicator as desired. Modifications such as period, scale, etc.
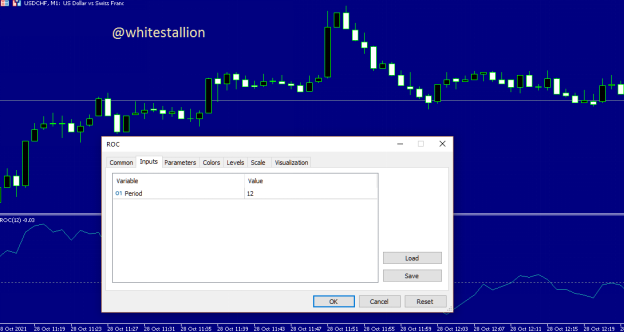
- The best period setting for the ROC indicator is 12. You could set it at 25 for long-term trades as well. Based on the prior calculations we can see that the higher the ROC the higher the buy level (overbought), the lower the ROC the lower the SELL LEVEL (Oversold)
Question Three
What is the ROC trend confirmation strategy? And what are the signals that detect a trend reversal?
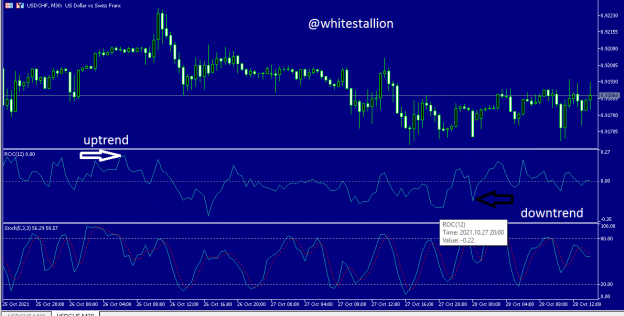
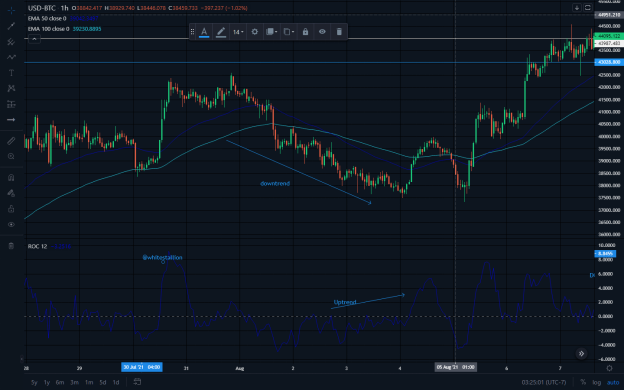
The ROC indicator has a 0 centerline. This is an important fact that will help us interpret the indicator’s trend. When prices cross the 0 centerline and head upwards, it indicates an uptrend
When the price comes downward below 0, it indicates a downtrend
To graphically illustrate this explanation I added a screenshot showing periods where the market were principally bullish. (Above the 0 centerline)
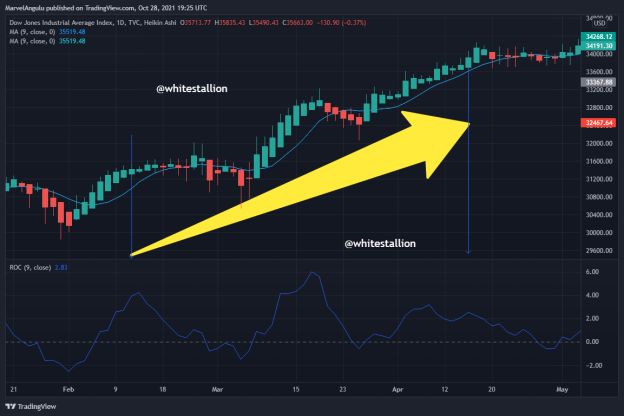
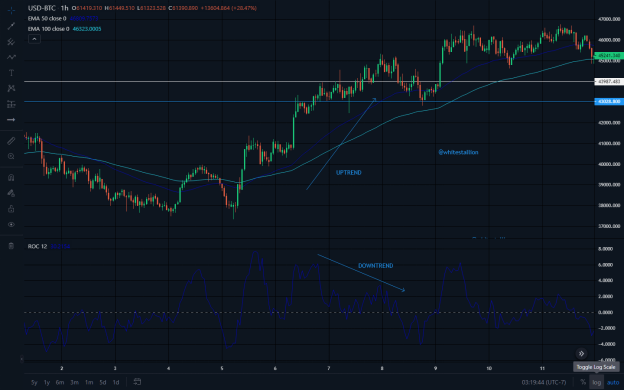
UPTREND SIGNAL
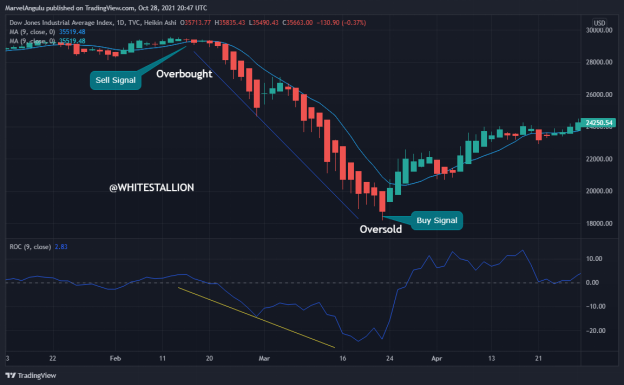
The screenshot below shows the chart of DJI stock. The ROC indicator helps by showing us the uptrend in the price chart.
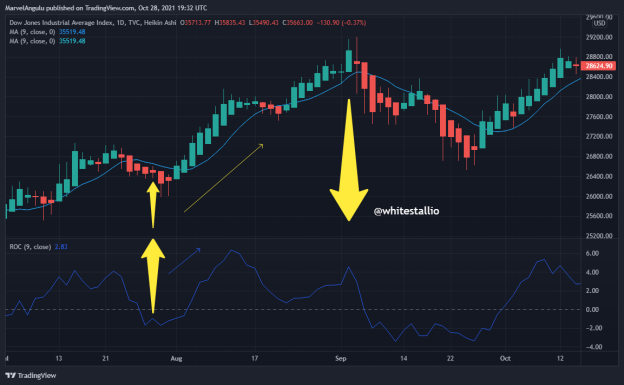
DOWNTREND SIGNAL
The screenshot below shows the bearish trend, as you can see, the price chart went beneath the 0 centerline
NOTE: The trading timeframe is 1Day interval
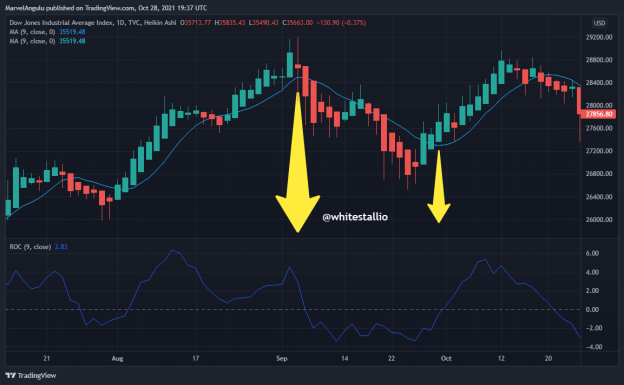
One of the ways we can identify trend reversals is by adding other technical indicators such as the Bollinger band. Once the candlesticks hit the band they will return to the middle of chart or even proceed downward, in a downtrend
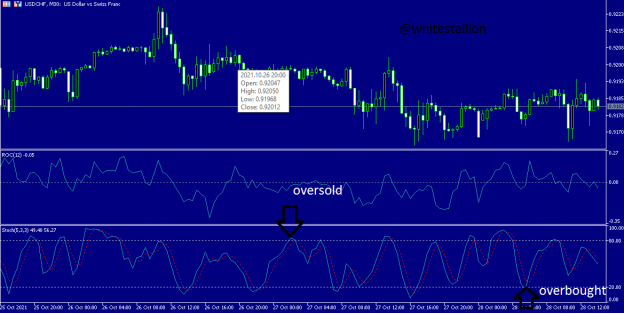
Overbought and oversold levels are not described in the ROC. So you can identify such zones by looking at the ROC's previous extreme values with respect to the price of the underlying asset. A zero-line cross on the ROC shows us the emergence of a new trend. For example, a cross of the zero-line from beneath signifies the beginning of a bullish trend. While across from above, indicates the beginning of a downtrend.
The easiest way to predict reversals in trends is to use a combo of the ROC indicator with another technical indicator. When the ROC generates a divergence signal, you should look for stochastic crossovers in overbought or oversold zones to identify and utilize the best entry points for a trend change. The optimal entry position for a bullish divergence, for example, would be in oversold area. And the best entry for a bearish divergence would be in the overbought region.
Trend signal confirmation
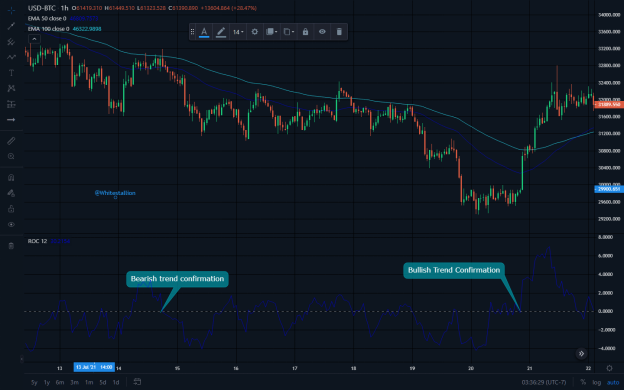
Reversal Of Trend
As we have stated already, the indicator works with a 0% centreline. A cross of this line upwards indicates a bullish trend and the cross of the line downwards indicates a bearish trend.
Question four
What is the indicator’s role in determining buy and sell decisions and identifying signals of overbought and oversold?
Just as I stated in the prior explanations, identifying signals using the indicator is quite direct and easy. The centerline 0 is what makes it so. Once the chart crosses the 0 line in an upward direction it means there is an emergence of a bullish market.
Contrarily, when the chart goes beneath the 0 centerline, there is a probability of a downtrend in the market.
Buying: The best time to open a buy order is at the oversold level which can be identified using a combo of the ROC
From the screenshot below. we can obtain the overbought and oversold signal which will help us decide whether to open buy or sell orders.
In the chart, we see the indicator line moving up and down the 0 centerline. Without making this concept difficult, it is always important to be watchful. Once the trend line moves around the trend line and heads below the 0 centerline, it is an indication that the market is about to turn bearish and it’s a good moment to place a sell order.
Similarly, when the indicator line moves around and crosses the 0 centerline and moves upward, it is an indication that the market is about to turn bullish and a good time to place a buy order
Overbought and Oversold Signals
To simply put it, oversold or overbought signals do not have a specific value thus it is significant that I choose a reasonable value as my resistance and support level . Such as +4 and -4
- Support: -4
- Resistance: +4
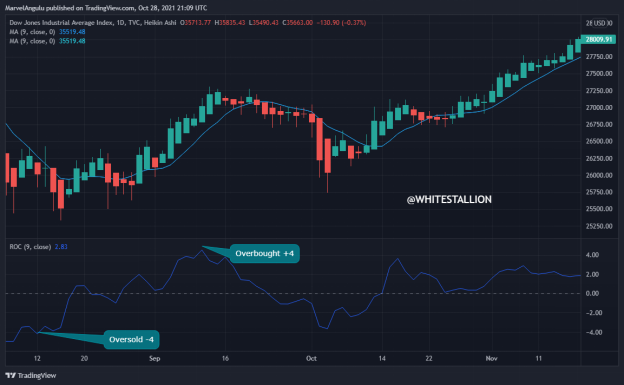
As indicated in the above screenshot, I was able to locate my support and resistance level. It is often characterized by a hit of the support or resistance level and a sharp reversal in the prior trend level.
Question 5
How to trade with divergence between the ROC and the price line? Does this trading strategy produce false signals?(screenshot required)
Before I proceed into answering this question, we'll need to have background knowledge of what Divergence is. This occurs when the price of an asset moves in the opposite direction of a technical indicator. A movement of a price against an indicator is known as divergence. Divergence shows that the present trend of the price is weakening and, in some situations, changing direction.
Divergence can be either positive or negative. Positive divergence suggests that the asset's price may rise while negative divergence indicates that the asset could trade lower, it's that simple.
Before acting on divergence alone, you should utilize a combination of indicators and a couple of research methodologies to validate a trend reversal, as is valid with all forms of technical analysis.
This is because divergence will not be available for all price reversals, another type of risk control or analysis must be utilized in addition to it.
Furthermore, the presence of divergence on a chart does not necessarily imply that the price will reverse or that a reversal will occur soon, why?
It is because divergence can linger for a long time, taking actions solely on it could result in significant losses if the price does not react as expected. Which will be sad.
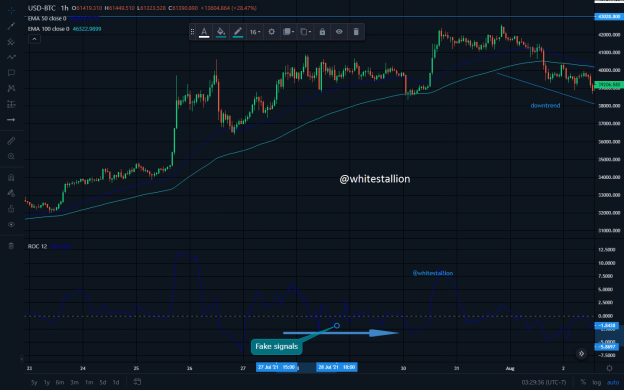
Fake signals
As you can see in the screenshot below, there are times when the market seems to fluctuate and as the indicator attempts to respond to the trends, it generates fake or false signals.
It is important to note that no indicator is 100% accurate thus, it is good to have two or more indicators to aid your trades.
Back to the screenshot, it shows the point where the price went above the 0 centreline which indicates an uptrend but the unpleasant fact is, there's a sudden sharp reversal in direction. This false signal could be triggered by market makers, making alot of traders lose money. There's a continuous release of false signal in the screenshot below, showing that this indicator isn't 100% accurate. So the indicator line goes above the 0 centreline line in an uptrend and goes below the 0 centreline in a downtrend.
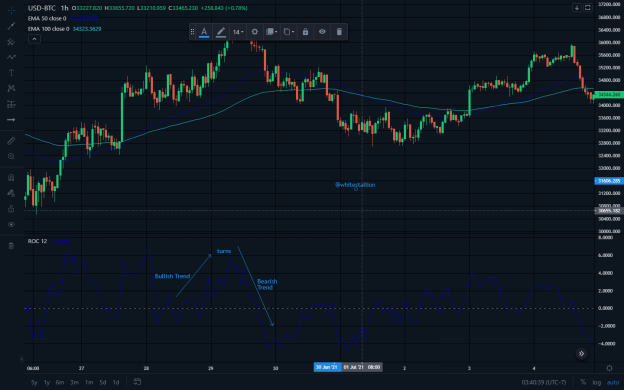
Bullish Divergence
This is when the price of a pair falls to lower lows while the technical indicator such as the ROC rises to higher lows, this is known as a bullish divergence.
This can be interpreted as an indication that the market momentum is getting strengthened, and that the price may soon begin to rise in tandem or in flow with the signal.
Bullish Divergence is a period during a trade where the direction of the trend is in a Bearish trend but the line on the ROC indicator moves in the opposite direction towards the top.
This happens when there's a flux of buy orders being placed lavishly. This pushes the market in the opposite direction.
Bearish divergence
In contrast to bullish divergence, when the price makes higher highs while the technical indicator makes lower highs, it is known as a bearish divergence. The disparity between the price and the Indicator direction can show that momentum is slowing. As a result, there is a good chance that the price will drop quickly.
As we can see in the screenshot above, there's an uptrend currently going on in the USD/BTC pair chart. Meanwhile there's a speculative display of a downtrend in my line of the ROC indicator.
Question six
How to Identify and Confirm Breakouts using ROC indicator?(screenshot required)
Breakout is when the price of a currency pair moves outside of a support or resistance level with increased volume. What I'm trying to say is that, after the stock price breaks above the resistance level or breaks below support level, if you're a breakout trader, it would be wise to take a long position or a short position. Furthermore, because breakouts are the genesis point for future volatility rises, huge price swings, and most times, major price trends breakouts are a crucial trading approach.
It is important that you wait for confirmation before deciding whether it's a breakout or a fakeout. Fakeouts happen when prices open above or below a support or resistance level, but then move back into a former trading range eventually. So if you act hastily, there is no assurance of the direction where the prices will move.
Breakout confirmation using ROC
A breakout can be described as when the price of an asset moves above a resistance area, or when the price of an asset moves below a support area. Breakouts depict the potential for the price of an asset to start trending in the breakout direction. For example, a breakout above the center line of a ROX indicator from a chart pattern could indicate the price will start trending higher.
Furthermore, a breakout happens when the price is held below a resistance level or above a support level for a protracted period of time. A Lot of traders use the resistance or support level to allocate or define entry targets or stop-loss levels. So as it happens, traders who were awaiting the price to break through the support or resistance level rush in once it happens so, while those who didn't want the price to break through close their trades to prevent further losses.
There are two major drawbacks to using breakouts as trading strategies. The most serious issue is unsuccessful breakouts. Breakout traders are usually enticed in when the price moves just beyond resistance or support level. After that, the price can reverse and not continue in the breakout direction. How unfortunate! This can happen several times until a true breakout takes place. Which may take a long while.
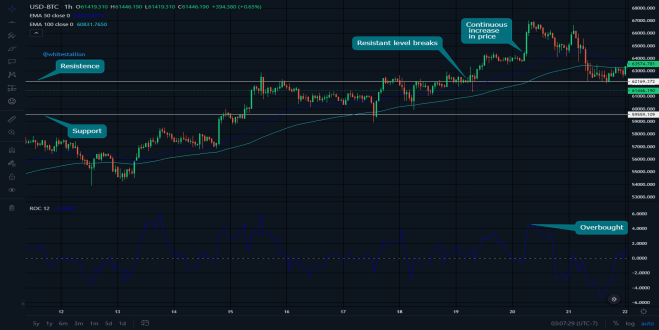
As you can see in the screenshot above, I set my resistance line at $62,169.37 and my support level at $59,559.109. The Price continued to rise and broke through my resistance and the bullish run continued. The sharp rise of my indicator in response to the breakthrough is also a confirmation.
Question Seven
Review the chart of any crypto pair and present the various signals given by ROC trading strategy. (Screenshot required)
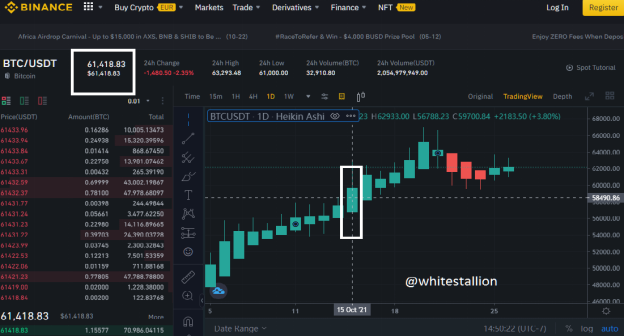
Analyzing the trade signals using Matic Network/TetherUS
Buy entry
Through the use of the heikin-ashi candlestick indicator with the rate of change indicator. I observed the uptrend signals given by the heikin ashi candlestick in addition to the price crossing the 0 centerline of the ROC indicator in an upward direction which indicates a bull market.
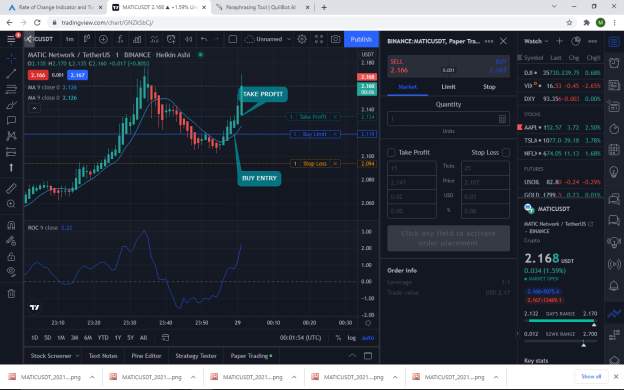
By placing a buy order immediately it crossed zero I was able to hit my take profit. The indicator line crosses the centreline indicating an uptrend, then my Heikin Ashi Candlestick helps me reduce the noise in the market so I can be able to make proper trading decisions. That is how the concept operates. Pretty simple. Noticing the market trend is based on monitoring the indicator line as it crosses the 0 centreline. This indicator isn't excellent enough to be used solely and that's why I introduced the EMA indicator. I'll explain that in the sell signal.
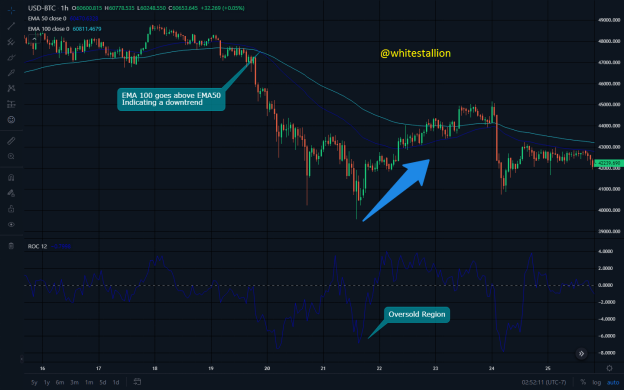
Sell signal
First of all, I set my ROC period to 12 which is among the best periods you could have. There are other longer periods such as 14, you could set it as desired by you. The +4 and -4 indicate my resistance and support level. The Exponential moving average is a technical indicator that depicts averages. I added it to my ROC indicator to help my accuracy, setting it at 50 and 100 EMA. As the 100 EMA crossed above the 50 EMA it indicated a downtrend in addition to the drop of the ROC indicator below the 0 centreline. This simply indicates a downtrend which is good for selling. As shown in the screenshot below.
Conclusion
Just as I have mentioned already, trading with the rate of change indicator alone isn't a safe way to trade; rather, adding a few technical indicators to it is a more efficient way to maximize the ROC indicator. It actually has a number of advantages such as the ability to point out overbought and oversold zones at +4 and -4, and its ability to make interpretation of the market easier. So long as the indicator crosses the 0 centreline in any direction you can predict the kind of trend you should be expecting.
Special thanks to Professor @kouba01
Hi @whitestallion
Thanks for participating in the Steemit Crypto Academy
Feedback
Total| 9.5/10
This is good work. Thanks for demonstrating such a clear and well detailed understanding of trading using Rate of Change indicator.
Thanks prof @yohan2on, for the honest assessment.
#club5050 😀