Steemit Crypto Academy Season 5 Week 1 [Beginner's Course] - Understanding Trends: By @zeebhutta

Designed by @zeebhutta Using Canva

Greeting crypto enthusiast,
I would like to wish a seamless journey to everyone on the 5th season of Steemit Crypto Academy. In this homework, I will be sharing complete details about trends in the crypto market so, I hope that everyone understands the basics and make use of it while trading.

1) a) What do you understand by a Trending market?
The trend is a specific direction where something is commencing toward. When it’s about crypto trends, it simply shows the specific direction where the market is heading. It can either be an uptrend, downtrend, or ranging. The downtrend shows that the market is declining and the sellers that are also commonly referred to as bears are in control. Uptrends is the complete opposite of downtrend as the market surges due to an increase in demand and buyers are in control who are also known as bulls.
It is the most important part of trading to understand the trend of the crypto market as it has major confluence. So, it is advised to learn about the trends so that you can take trade accordingly as it would not be wise to open a short position on any commodity when it’s in downtrend.
1) b) What is a bullish and a bearish trend? (screenshot required)
You will widely come across the terms bullish and bearish trends in the crypto market. It shows where the market or a certain commodity is heading and plays a major role in setting the bias of a trader while opening a trade. You might be wondering what’s the logic behind using the term Bullish and Bearish trend. Don’t be confused as I have shared detailed answers with a clear reference from the crypto market:
Bullish Trend
When the price of the commodities rises and make recovery from a downtrend, then it is said to be a bullish trend which is also called an uptrend. It shows that buyers are in complete control and pushing the price upward. It gives the public the confidence to invest in the market as they will be able to gain profit from the rising trends. Plus, the volume of the commodities also increases as the bullish trend starts.
The reason due to which it is called bullish is because of the fighting styles of bulls as they tend to stroke their horns into their enemies and push them upward. That’s the same case with buyers as they invest their money into a specific commodity and push the price.
Bearish Trend
A bearish trend shows that the market is in a downtrend and the price is declining. It shows that a specific commodity or market is in favor of sellers who sell their holdings and increase the supply due to which price falls. It is a golden opportunity to purchase cryptocurrencies at cheap prices. It is called a bullish trend because bulls push down their enemies in the same way sellers push the prices down.
2) Explain the following trend identification and give an example of each of them. (Original screenshot needed from your chart). Do this for a bullish and a bearish trend.
There are various ways to understand the trend of market. However, the most common methods are trendlines and market structure. I will deliberately explain bullish and bearish scenario with both technical analysis tools with examples:
i) Market Structure
The market structure is the easiest way to understand the trend of the commodity. Once, you have mastered it, you will be able to identify it at a single glance. I will show you how it can be found during the bull and bear run.
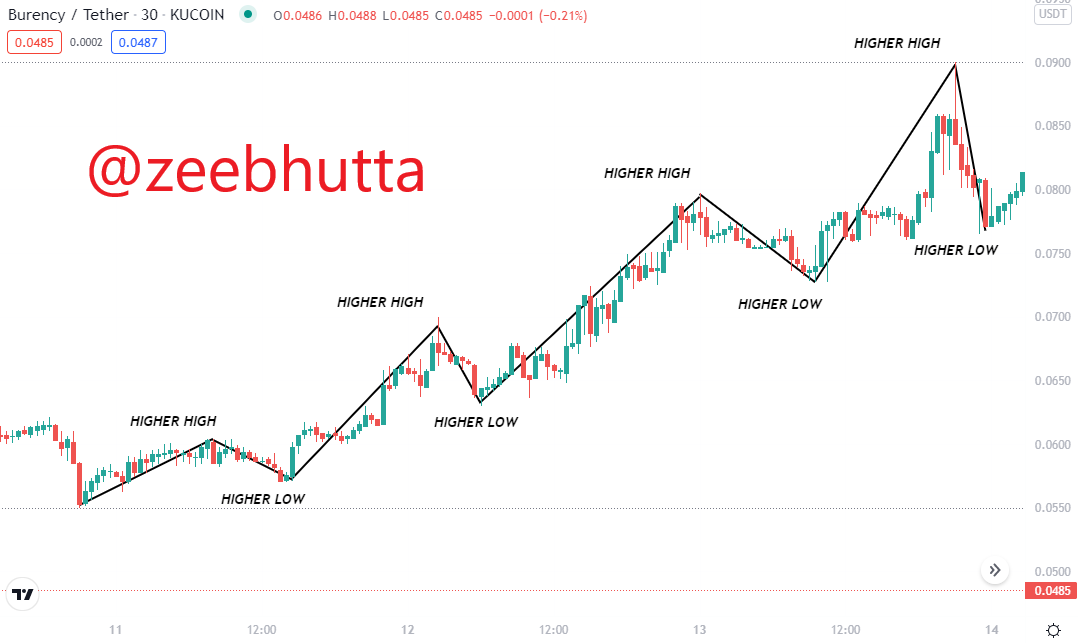
Market Structure During Bullish Trend
The market structure during an uptrend can be easily found as the candlesticks will be making higher-high and higher-low. It shows that price is increasing and after that, it takes a certain break by making a minor retracement. However, there is a simple rule that higher-high can’t be lower than the previous higher-high as it invalidates the entire structure and vice versa. The best benefit of this structure is that gives the buyers the opportunity to enter the market during a pullback. Have a look at the below-mentioned chart of BUY/USDT and you will get a better understanding of the bullish market structure.
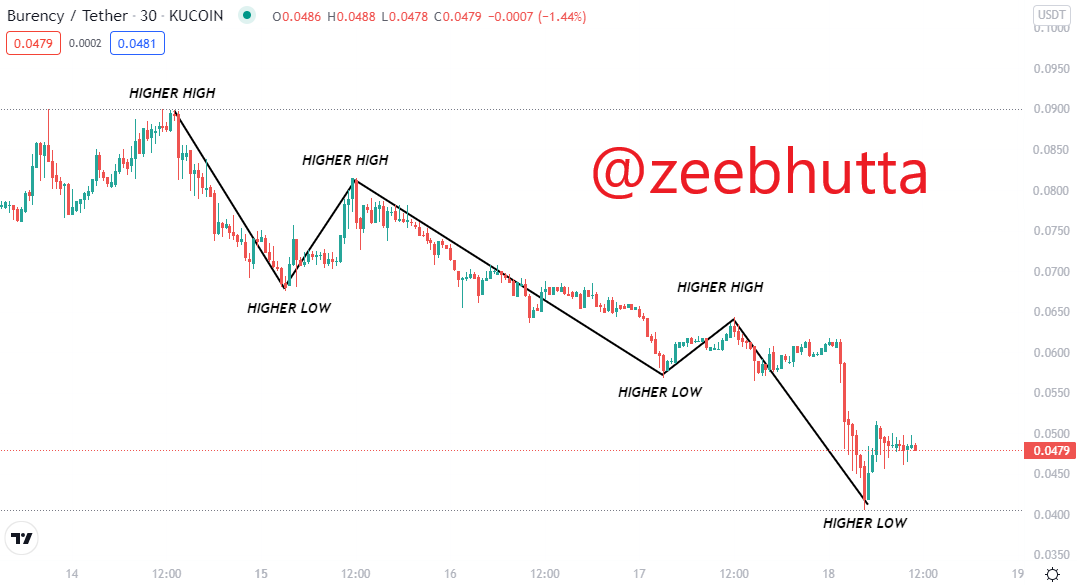
Market Structure During Bearish Trend
During a bearish trend, the price makes a series of lower-low a lower-high. You will observe that candlesticks will make a lower-low and the next lower-high will be made followed by lower-low and so on. You can further understand the bearish market structure from the below-mentioned chart of BUY/USDT.
ii) Trendlines
Trendlines are the most common tools that are used to identify the trends of the market. It is very easy to use as all it takes is to draw a line from one end to another. Now, I will show you how it is done in both cases of bearish and bullish trends.
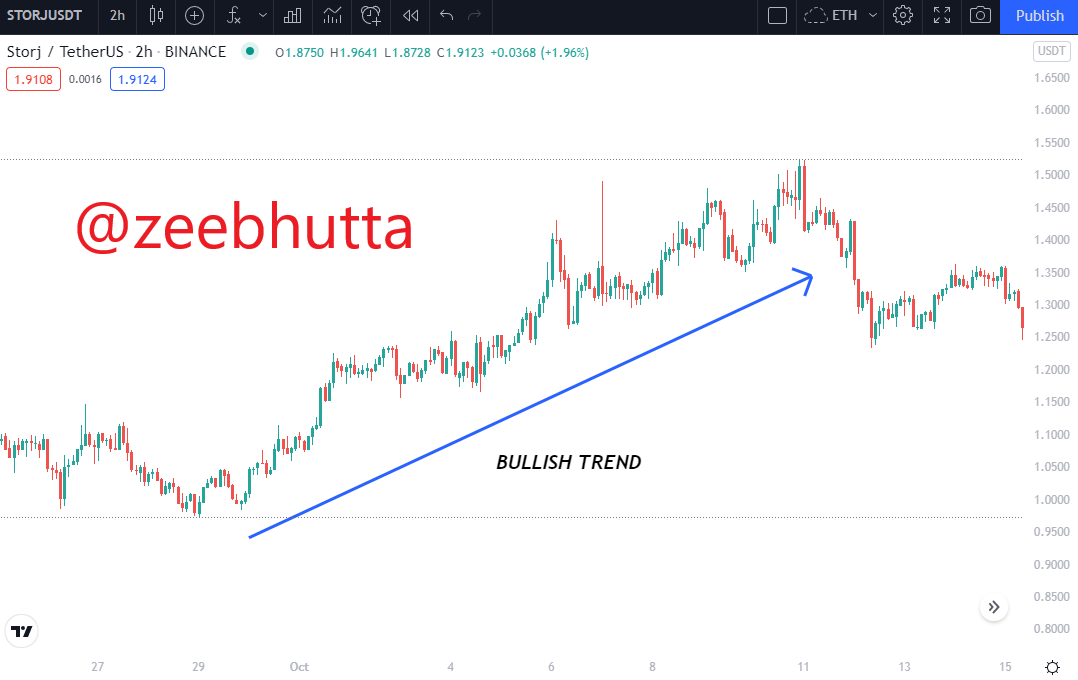
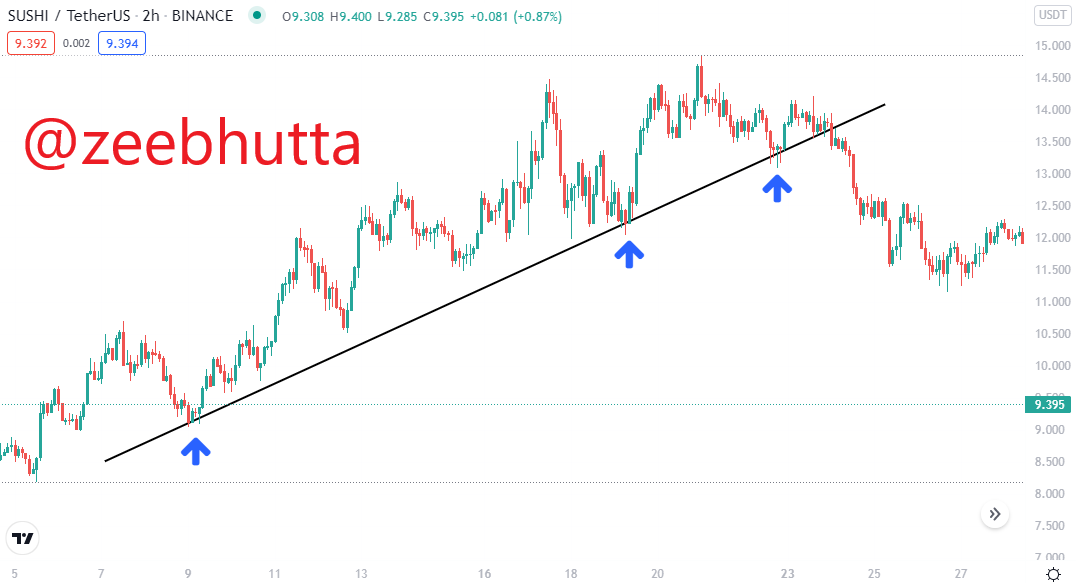
Trendlines For Bullish Trend
For instance, think that there’s a commodity in a bullish trend. When you draw a trend line, it will become a support, and every time the price of a commodity touches the line it will bounce. Therefore, a single trendline will represent an uptrend until it is broken which shows that there is going to be a trend reversal. You can easily predict the price action as the candles will simply bounce from the trend line so the majority of traders enter the trade whenever it touches the line and exit in profit.
You can learn from the below-mentioned chart of SUSHI/USDT that the price is respecting the trendline which also shows that it is in an uptrend.
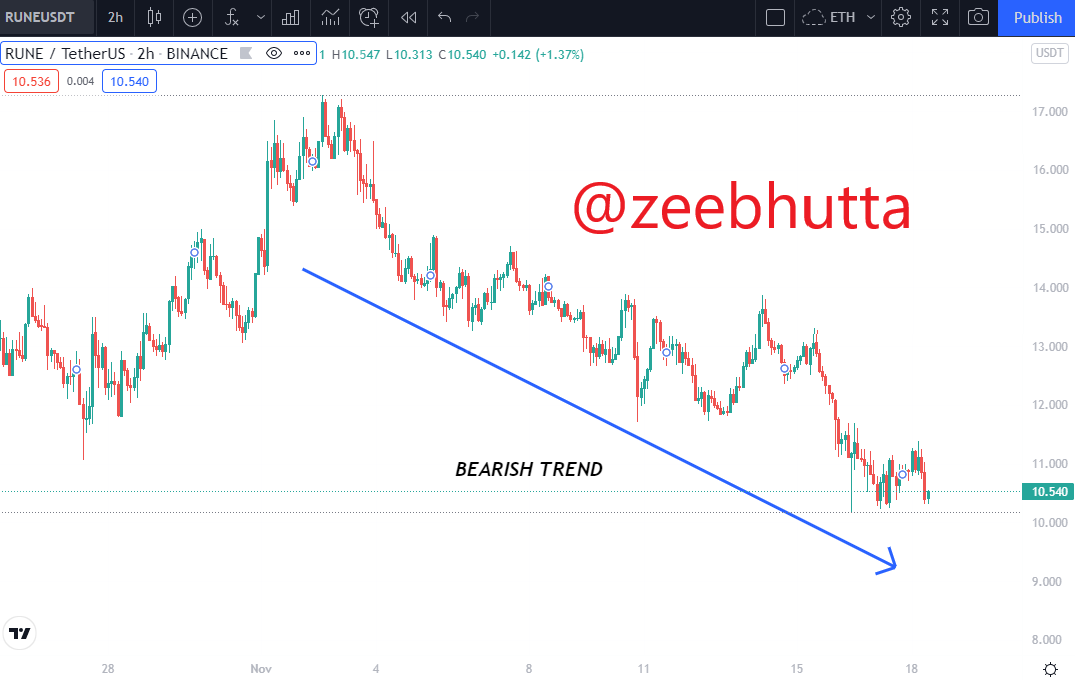
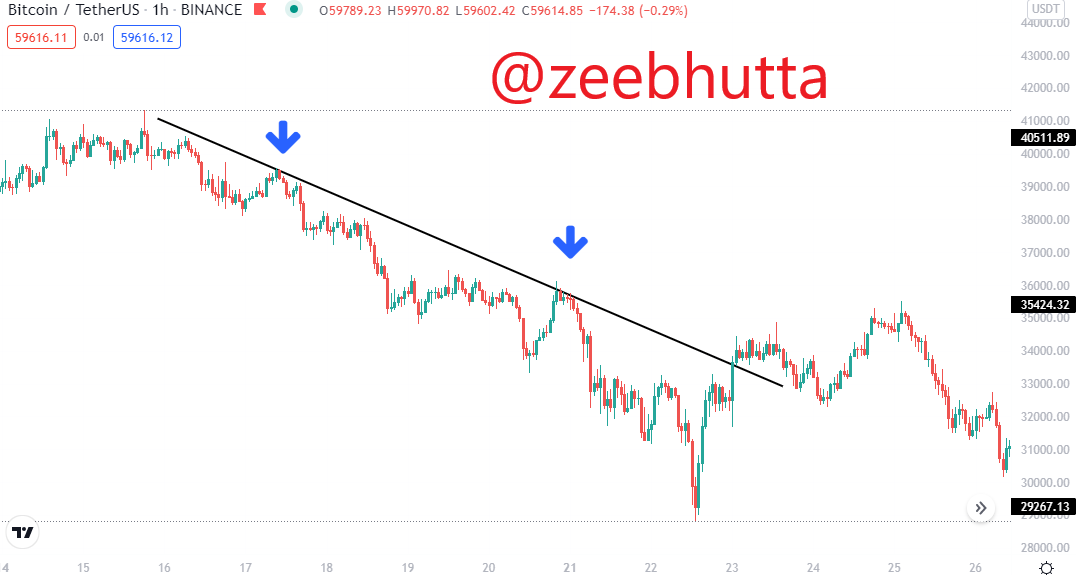
Trendlines For Bearish Trend
When it's about bearish trendlines, we can observe that prices make a series of lower-low and lower-high below the line which shows a downtrend. Actually, the line serves as resistance due to which every time price touches it, we can see rejection from that point until it is broken which will be changing the structure of the market. Traders usually open long position and exit when it hits the resistance line.
You can see the example of a bearish trendline and how the price of the commodity is respecting it.
3) Explain trend continuation and how to spot them using market structure and trendlines. (Screenshot needed). Do this for both bullish and bearish trends.
Be it bullish or bearish, whenever a trend starts, it can never move in a single line as the price fluctuates due to pressure from buyers and sellers. That’s why you will find candlesticks with various wicks and bodies testing the support and resistance level. Plus, the benefit of such movements is that traders can easily get their preferred entry and selling point. You can also ensure the trend continuation with the help of market structure and trendlines. I will share with you a perfect example for both bullish and bearish scenarios.
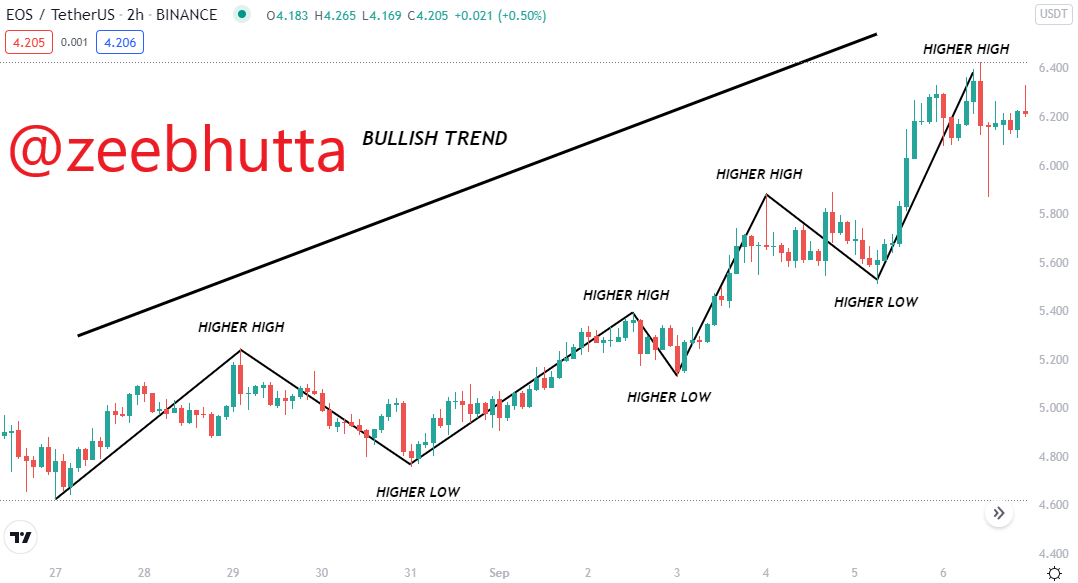
Bullish Trend Continuation
The commodity must be in an uptrend to bullish and as you can see from the below-mentioned chart pattern of EOS/USDT you will find that it has made a series of higher-high and high-low. Therefore, the market structure and trendline supports the bullish trend. Therefore, we can come to the point that both market structure and trendline are in favor of bulls.
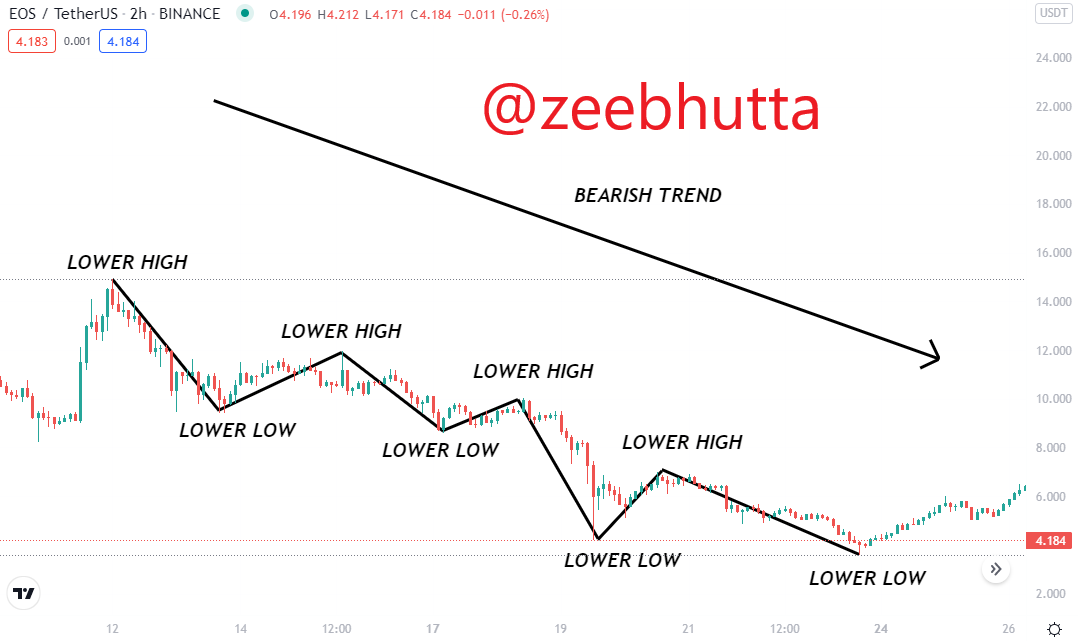
Bearish Trend Continuation
For the example of bearish trend continuation, I have used the chart of EOS/USDT which clearly indicates that it has been making lower-low and lower-high. A series of pullbacks has made the price test the resistance trendline which is stopping it from turning it into a bullish trend and that’s what confirms the bearish trend continuation. That’s how we can confirm the downtrend with the help of market structure and trendline.
4) Pick up any crypto-asset chart and answer the following questions -
i) Is the market trending?
ii) What is the current market trend? (Use the chart to back up your answers).
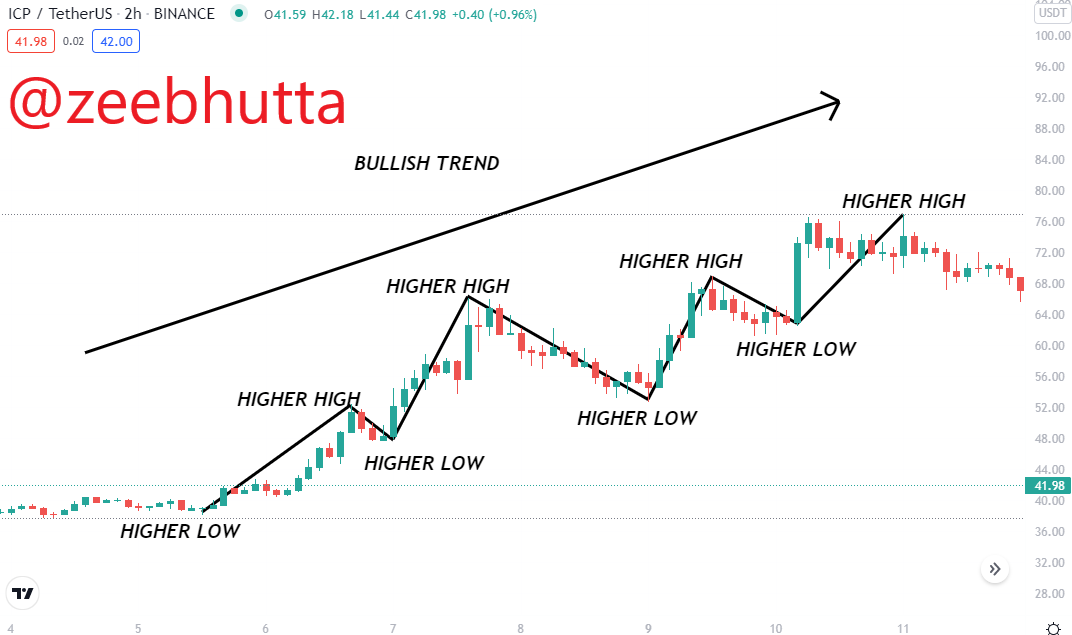
I have chosen the chart of ICP/USDT to show that market is in a strong bullish trend. As for confirming my answer, I have drawn the market structure which shows higher-high and higher-low that are not exceeding their previous points. Additionally, a trend line is adding more confluence which clearly affirms my answer that Internet Computer is in an uptrend.
Conclusion
Comprehending the trend is very important for every trader. One has to understand whether the market is in an uptrend, downtrend, or ranging as it will help to take trade according to the direction of a commodity. Market structure and trendlines are the most accurate and easiest tools that can help you to identify the trend of commodities. So, it is advised to make use of both tools to add more confluence to your trade and find the best entry and exit point.

Thanks For Visiting My Post And Your Appreciation
Cc:
@reminiscence01

Hello @zeebhutta , I’m glad you participated in the 1st week Season 5 of the Beginner’s class at the Steemit Crypto Academy. Your grades in this task are as follows:
Observations:
That's correct. While this doesn't only avoid you unnecessary losses, it helps you to understand the next reaction of the market to make good trading decision.
Recommendation / Feedback:
Thank you for participating in this homework task.
Thank you Professor 🌹
MashaAllah 10/10
Great job👍
Yes Mam, Thank You😊
Hello Sir
@steemcurator02
@sapwood
@reminiscence01
There are only one hour left until the post expires. But I have not yet received my marks vote.