[Crypto Trading With Moving Average] - Steemit Crypto Academy | S6W2 | Homework Post for Professor @shemul21
Edited using Canva
Most Professional Traders advised that, whenever a trader is about to enter the crypto market, he or she should be able to tell whether its in a bullish or bearish and also be able to determine the good time to enter and exit the market.
Today, I'm going to talk about one of the most popular indicators used in the market when it comes to reading the market chart by traders. But before I start, I will like to say a big thank you to professor @shemul21 for giving us search a wonderful lecture on Moving Average.
Let's get started.
Explain Your Understanding of Moving Average.
Moving Average indicator;
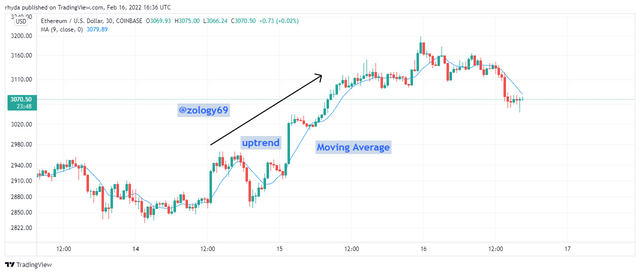
It’s one of the most commonly used technical analysis tools used by most traders when it comes to reading the market chart and works best in a trending environment. Moving average offers a really simple and reliable way to identify a true price direction and confirm the price direction for a complete trading system.
One thing the moving average indicator doesn’t do is predict the next candlestick to be formed in the future but with the help of the moving average, traders can detect a buy or sell signal as the indicator moves above or below an already formed candlestick. What it means is that the moving average can be used to confirm trends and reversals and when the price of the asset is above the moving average line, then we say that there is a chance of having an uptrend.
Also, when the price is below the moving average line, then we say that there is going to be a downtrend.
Many crypto traders consider the moving average to be a support and resistance level indicator and therefore base their trader on it.
It is advisable to have in mind that the moving average indicator is mostly based on past prices and is considered to be a lagging indicator their fire giving traders and late signals.
Screenshot taken from Tradingview
What Are The Different Types of Moving Average? Differentiate Between Them.
We have 3 main types of moving average and I’m going to list and explain all the types of moving average indicators we have the.
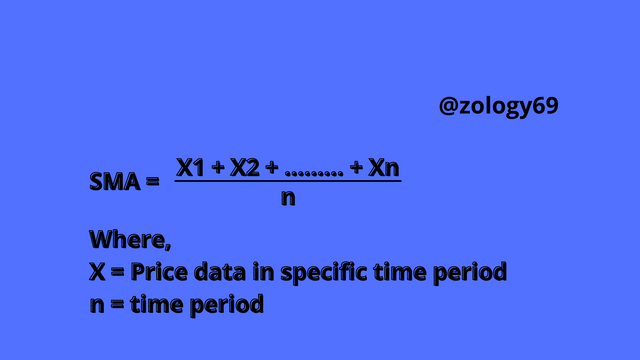
- Simple Moving Average: It is a technical indicator that tracks the movement of a piece of an asset over some time and plots it out in a form of a line. This essentially smooths out the price action which helps give an investor a general idea of where the trend is heading. With the help of the simple moving average, an investor can determine a bit and sell signal on the market chart
It can be calculated using the formula:
Edited using Canva
- Exponential moving average: when dealing with the EMA line, each point takes the previous 20 MA line what it means is that when the trend of a specific asset starts to change in trend, the moving average takes time before it adjusts to that of the new trend forming.
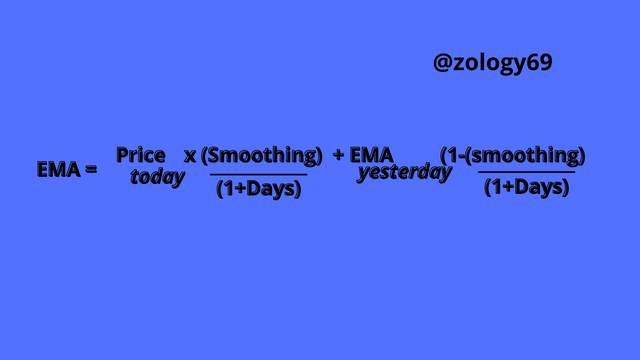
The formula for calculating EMA is;
.png)
Edited using Canva
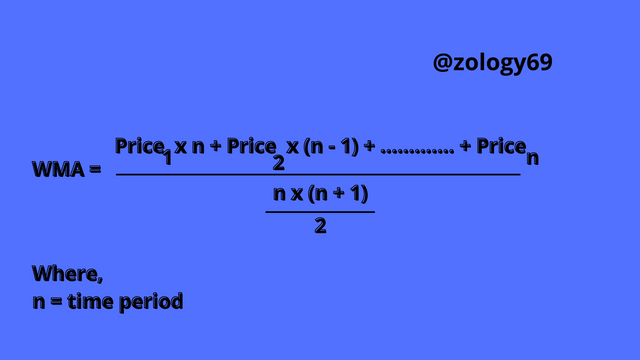
- Weighted moving Average: This type of moving average combines both the SMA and that of the EMA. The WMA behaves like the SMA by using a fixed period in its calculation but also adds that of the EMA when replacing more weighted on the recent candles
Below is the formula for calculating the WMA:
.png)
Edited using Canva
Difference between SMA, EMA, and WMA
| Simple Moving Average | Exponential Moving Average | Weighted Moving Average |
|---|---|---|
| Smooth's price action which makes it slow | Adjust to the change in price which is why it’s considered to be faster than that of the SMA. | it’s considered to be the most fasters indicator among all because it uses both the EMA and that of the SMA system. |
| Most traders consider using the SMA when dealing in a long-term trade. | The Exponential moving average was designed to deal with a short-term trade which is why it’s unstable for a long-term trade. | Considered to be powerful, the WMA can be used for both long and short-term trade since it can adjust to the type of trade you will like to deal in. |
| The SMA is calculated by taking the sum of data points given in a period over that same period | Is calculated by multiplying the price of today over something and dividing it by 1 pulse a day and adding it to the price of yesterday minus 1 multiple by something and dividing it by 1 plus a day. | is calculated by taking the total price of the SMA and dividing it by that of the EMA over 2. |
Identify Entry and Exit Points Using Moving Average. (Demonstrate with Screenshots)
It is known by traders that, moving average gives you a clear view of the type of trend the market is on. It maybe is bullish or bearish, so for the sake of this question, I am going to use the EMA because it follows the trend of the price of an asset more closely and doesn’t lag, and is considered to be dominant which will help us determine our short term buy and sell signal because the EMA is considered for short term signals.
Entry Point
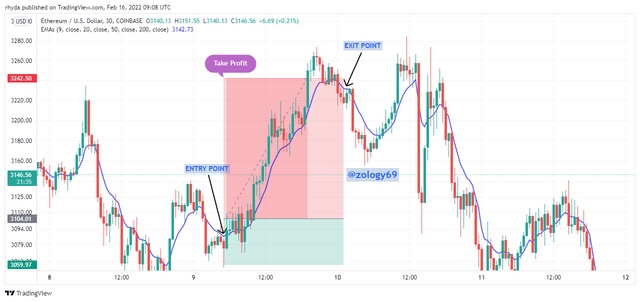
As the definition of Moving average states, when the indicator of the moving average used is below the candlestick then we should expect a bullish market trend and vice versa.
Looking at the screenshots below, and with the help of the EMA 20, we were able to find our entry point in the market because we could see that the indicator showed a sign of resistance when then resulted in the candlestick to change from bearish to bullish.
Edited using Canva
Exit point
With the help of the EMA, we were able to determine our entry point.
Now let’s take a look at how we can use the same indicator to exit from the market when it starts showing signs of resistance.
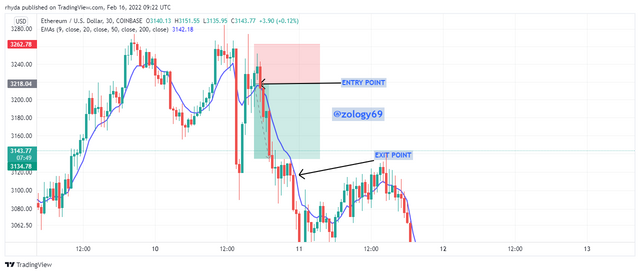
When it comes to looking at the bearish trend, the indicator used is shown above the candlestick of the chart which mostly gives traders a hint of what’s going to happen next within the next hours or days.
Edited using Canva
As the screenshots above show, the indicator EMA shows resistance when resulted in the chart moving from bullish to bearish which therefore forced the reader to exit the market.
What do you understand by Crossover? Explain in Your Own Words.
In a layman's term, a cross over is when one thing crosses over another.
But in cryptocurrency, let's say a trader decided to use two indicators of maybe EMA and SMA where of is faster and the other is slow. The fast one reacts to the movement of price faster and all it needs is a data point to do it's calculations.
When these indicators meet at a point
This gives a trader the signal on whether to buy or sell in the crypto market. With the help of the crossover, crypto traders can enter and exit the market and whenever these two indicators used on the chart meets at the bottom of a candlestick, it triggers a trend reversal signal from bearish to bullish giving the trader the go-ahead to buy in the market.
This is the same way applies to whenever these two same used indicators meet at the top of a candlestick, it signals another trend reversal and these trend reversal will change from bullish to bearish giving the trader a sell signal.
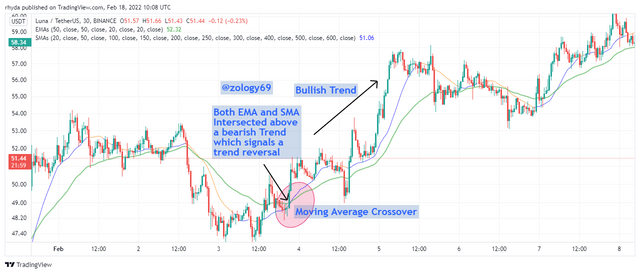
Let's take a look at the chart below:
Screenshot taken from Tradingview
For the sake of differentiation, I decided to change the color of the EMA indicator to green leaving the SMA a color of blue.
Looking at the chart above which shows a crossover of both EMA and SMA meeting at the bottom of the chart that triggered a reversal from bearish to bullish.
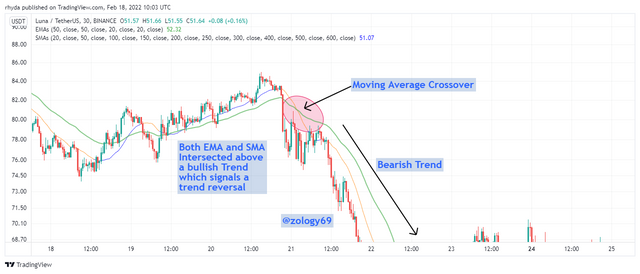
Screenshot taken from Tradingview
Looking at the chart above, the Interceptions of the two indicators used happened at the top of the candlestick trigging a change from Bullish to Bearish.
Explain The Limitations of Moving Average.
It is said that, all indicators are not 100% trusted this is why professionals traders advised that when using an indicator, you should always consider using more than one.
In this part of the assignment, I'm going to start some of the challenges faced by the moving average indicator
Though the moving average indicator is mostly used by traders, it is not 100% accurate and sometimes gives some faulty signal. For the sake of this study, we are going to look at some of the limitations of the moving average.
It is difficult for a moving average to predict the next trend when the market price of a specific asset is ranging. This is because when the price of that asset is moving in an up and down trend the moving average indicator is not able to predict the next trend to be formed.
Late signal: The moving average indicator gives a signal of an already formed trend which sometimes leads investors into entering the market late and this late entry mostly leads to loss of asset since the next candlesticks to be formed is not detected by the indicator.
Conclusions
Among all indicators used in the crypto market, this by far one of the best and widely used one among traders.
This is because it gives us a clear view of what trend the market is one and though been the best, it comes with a challenge which has to do with not been able to give a correct result when the market is in ranging.
I stop here by expressing my sincere gratitude to professor @shemul21 for giving us search an interesting lecture on moving average
