BTC ETH market analysis and operation suggestions
BTC market analysis
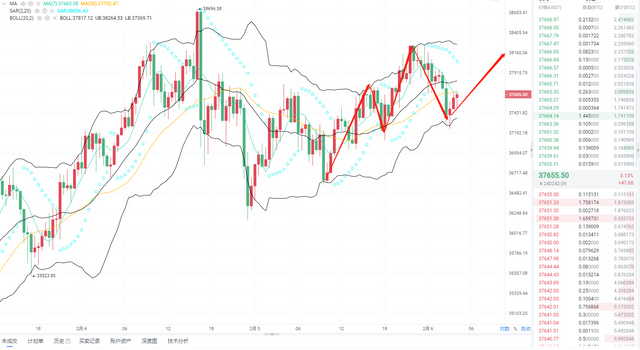
The BTC that we analyzed before will rebound first and then fall back. The subsequent market is as predicted by the author. After breaking through the position of 38000, it took advantage of the trend and came to near 38250. Then the rebound was weak and began to fall. At present, there are continuing to step back on the hourly line. Demand, the following will focus on the support of the 36900 front-line position. I have introduced to you from the previous analysis. The 4-hour online market tends to fall. If this wave of decline falls below the 36900 market, the market is expected to continue to fall.
ETH market analysis
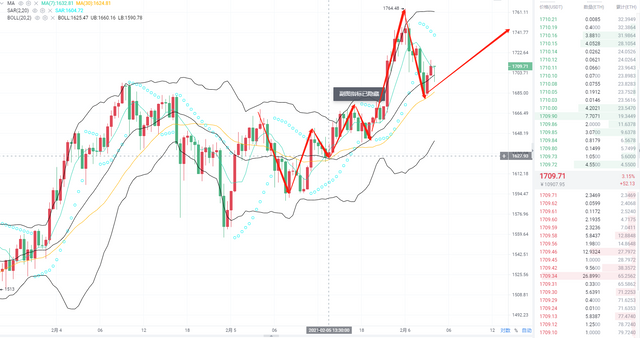
Looking at the Bollinger Band opening in a short period of 30 minutes and hourly chart, the currency price is running near the upper rail. RSI and KDJ are in a deadlock posture in the third line.
In the four-hour chart, the Bollinger Bands closed upwards, the K line was running below the upper rail, and the currency price fluctuated around 1730. The 5-day moving average has crossed the 10-day moving average, and it is arranged in a long position. The MACD fast and slow line of the picture indicator is located above the 0 axis and the golden cross diverges upward, and the red energy release column gradually rises. RSI and KDJ are located in the buying zone and the golden cross diverges upward. Based on the above indicators, the evening operation is mainly based on callbacks.
Operation suggestions
1700-1700 more than a single approach goal to 1740-1800
good analysis i fallow that