[Technical Analysis] SHIB/USD Market January 02, 2024
Hey Guys..!!
Meet again with me Wahyu Nahrul, This time I want to make a brief technical analysis of a cryptocurrency chart, the analysis I made is based on my experience and knowledge.
.png)
Alright, let's get straight into the discussion, Happy reading!!

Shiba Inu (SHIB) Analysis
Today, January 02, 2024, I will try to analyze the price movement of Shiba Inu.
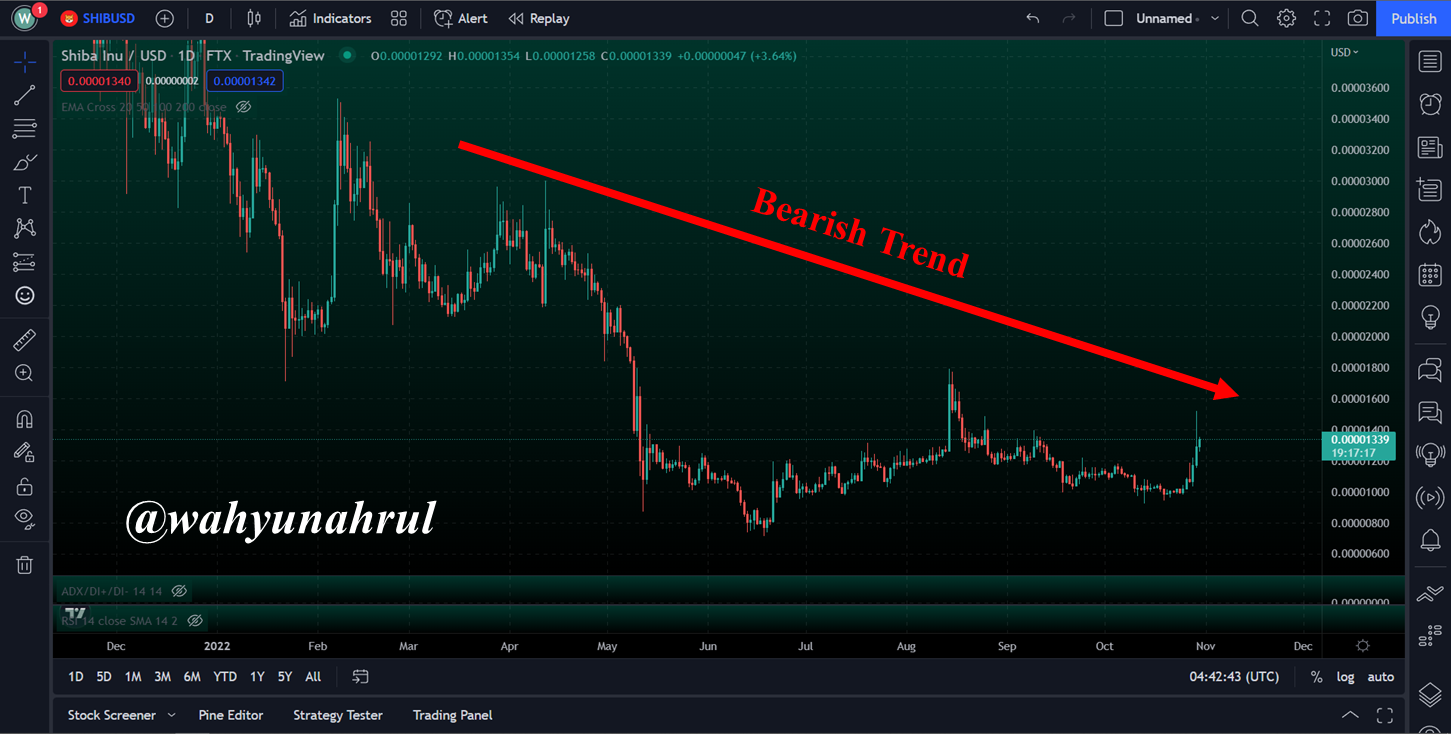
Shiba Inu which is a Meme Token type cryptocurrency is in a fairly severe Bearish Phase, we can see this in the SHIB/USD chart above where the SHIB price continues to experience a very deep decline.
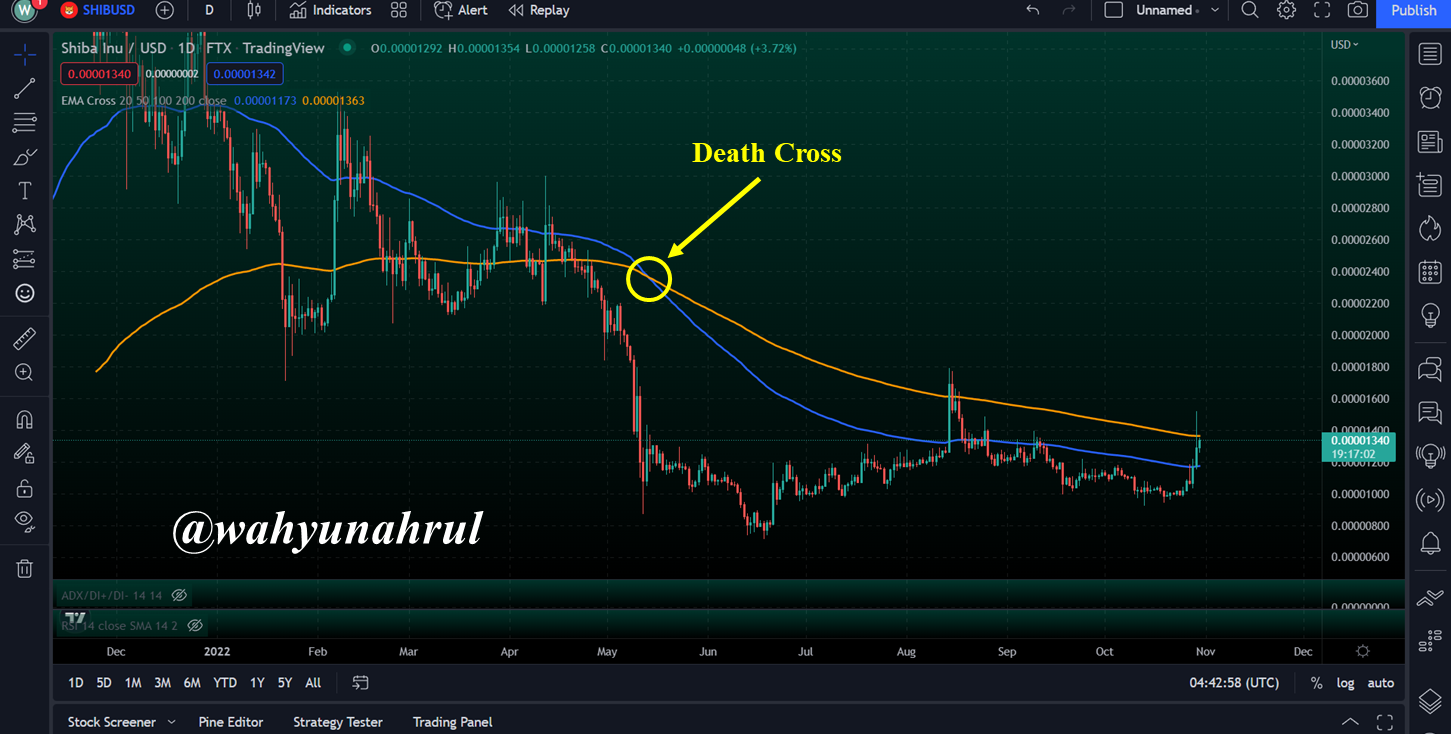
The first proof we can get is from the EMA indicator with a cross between the EMA 100 and 200, resulting in the Death Cross.
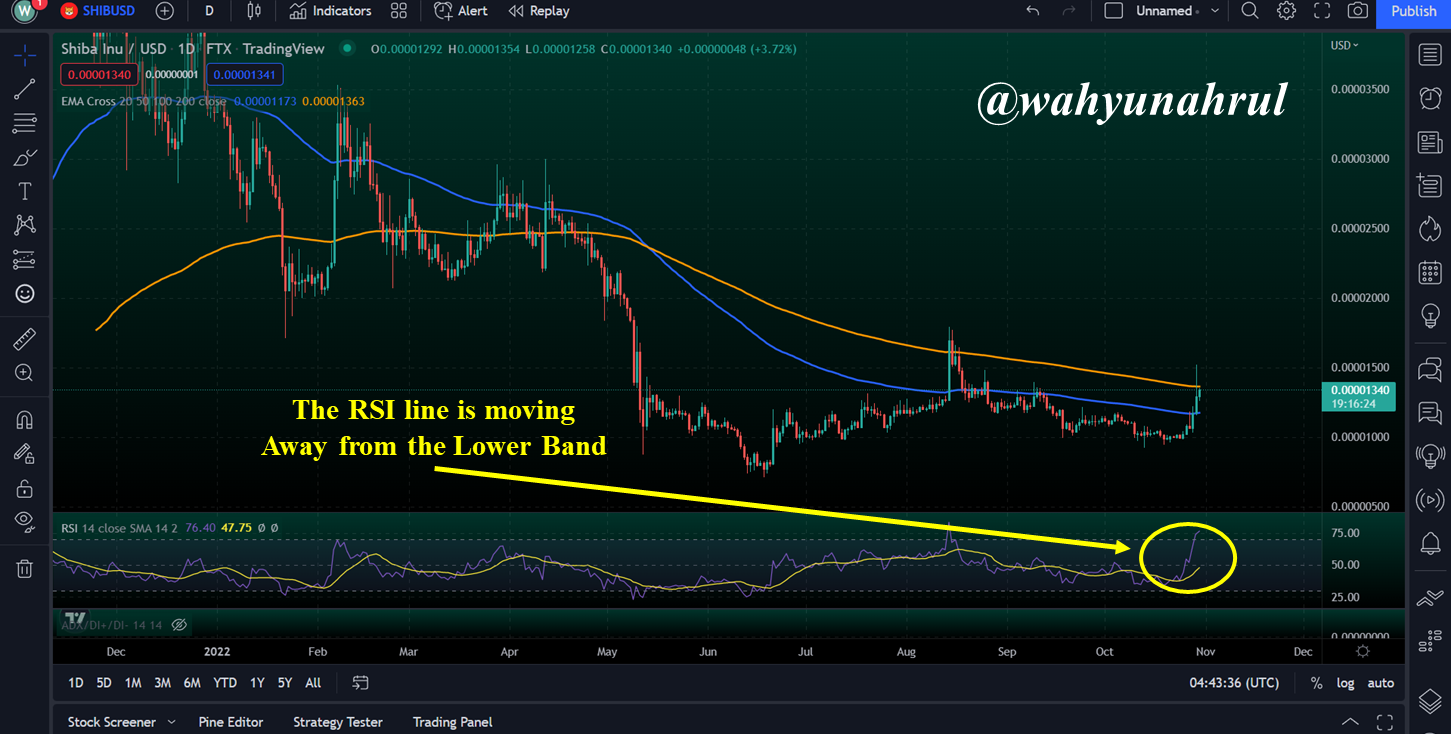
In addition, the RSI indicator also strengthens the signal given by the RSI indicator where the RSI line is starting to move upwards toward the Upper Band, which is a very positive thing for the SHIB/USD market.

Disclaimer:
Upvoted! Thank you for supporting witness @jswit.