Hints for Breakout Traders - STEEM/USD and DYDX/USDT markets Analyzed
Introduction |
|---|
Over time, different traders have employed a unique trading method that aligns with their trading needs at any point in time. Some utilize many methods and a few stick to only one method while building on it to maximize profits in the market.
Whatever method you choose, the most joyful experience is that sense of fulfillment when you enter a market and leave with satisfying results at the end. Today, I have got some hints for breakout traders.
Breakouts on Charts |
|---|
Breakouts on a crypto chart are important levels that are capable of helping a trader decide to long or short in a certain crypto market, that's because the breakouts exist in any phase of the market. Below are some types you will find when you are conducting your analysis:

Trading image from Pixabay
Resistance breakouts- This exists when the price surpasses the most recurring or recent resistance at the top of the chart, for a continued uptrend or a breakout for a continued upward movement after an accumulation zone.
Support breakouts- This exists when the price surpasses the most recurring or recent support at the bottom of the chart, for a continued downtrend or a breakout for a continued downward movement after a distribution zone.
- Dynamic breakouts (support/resistance)- This exists when prices diagonally breakouts in a downtrend or uptrend market phase, marking the beginning of a reversed phase.
Whatever method of breakouts you choose, one thing is paramount to determine the success of your analysis based on your term (long/medium/short) of trade and that is the time-frame.
Most of us who trade perpetual contracts often utilize lower time frames like 15mins, 30mins, 45mins... because lower time frames give one insight into the most recent price behavior and we'd base our decisions on the chart pattern at that time frame to make quick profits.
The paragraph above does not imply that higher time frames are not utilized by perpetual traders, it solely depends on why and how long the trader is entering a position. And for the fact that perpetual traders also HODL using the contract nullifies the utilization of lower time frames alone.
What time-frame is Ideal for the Bull Season? |
|---|
It's no longer an assumption about the resumption of the bull market phase, it's already with us. The dead are rising, dried bones are getting fresher again and the wasteland is turning into greener pastures.
But what time frame should we employ, lower or higher? Once again, it all depends on your term (long/medium/short) of trade, this will help you understand what time frame you are going for. That said, I have a recommendation. It's time to:
Explore the market to outsource coins that performed well during the last bull season.
Is there any utility attached to them?.
What phase are they now? Identifying breakout.
Be ready to utilize a medium/higher time frame. You will need it.
For good profits, be prepared to hold for days/weeks.
It's time to go practical now and here we will be exploring certain markets to see their state while comparing their behavior in the previous bull.
STEEM/USD |
|---|
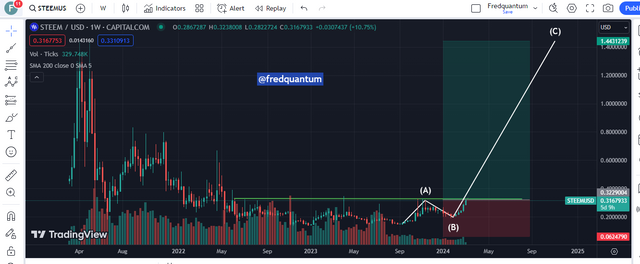
STEEM/USD Chart
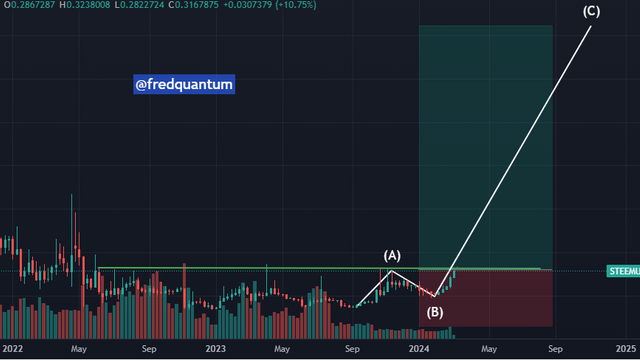
STEEM/USD Chart
The charts above are the graphical representation of the price behavior of STEEM over time, on a weekly time frame. During the last bull run, STEEM made it to as high as $1.42 in April 2021, with the asset currently trading at $0.32, ready to breakout, the next destination may be $0.6 or even higher. What backs this?
STEEM is still highly relevant as the first decentralized social platform native token.
It's actively utilized in the ecosystem.
It entered more markets in the last few months.
Considering the state of the Steem market, its utility, and past price behavior at a higher time frame, I hope you can get prepare for the days ahead.
DYDX/USDT |
|---|
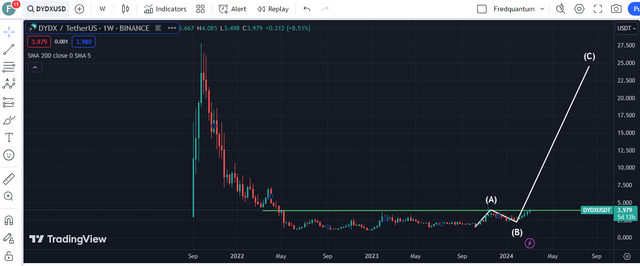
DYDX/USDT Chart
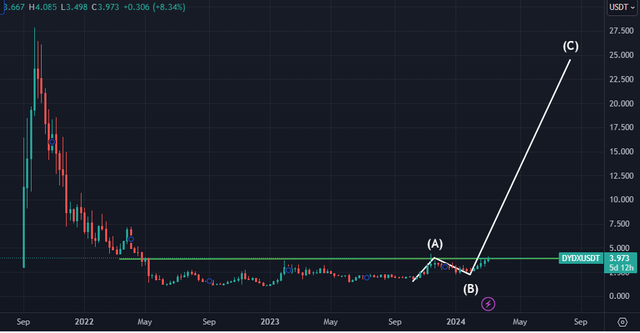
DYDX/USDT Chart
DYDX shared an identical chart with STEEM. DYDX made it to as high as $27.85 during the last bull run and it's only trading around $3.978 now, ready for an explosion. These assets have a history of bull run and this can easily guide you on what to expect sooner. Quick highlights of DYDX:
DYDX is the native token of one of the leading DEXes on Ethereum, DYDX.
It powers the DYDX ecosystem. DYDX as a DEX that has a wide range of products for traders, expects more from its token.
And when it's ETH chain, you shouldn't expect less.
Conclusion |
|---|
In conclusion, there are a lot of assets like STEEM and DYDX that are just breaking out to swing into full action during the bull season. Spend some time to research them, buy and hold (on spot/perpetual). The days ahead will electrifying.
Article shared on X
Note:- ✅
Regards,
@jueco