The Five Most Important Indicators You Should Know As A Crypto Trader
 Made with canvas
If you want to succeed in crypto trading, you have to know how to make uses of technical indicatoes which are the mathematical tools for calculations. They are represented as lines on a cheart which can helps you know the market movement of the assets you're trading. By using an indicator, you would be able to identify market trends and spot market signals.
When talking about trading indicators, they are classified into two different types: Lagging indicators and leading indicators. Having introduced these two indicators, Lagging Indicator predict the future outcomes of the market, whereas the leading tells about the past outcome.
Below are the five most important indicators you should know.
1. Relative Strength Index (RSI)
 Tradingview
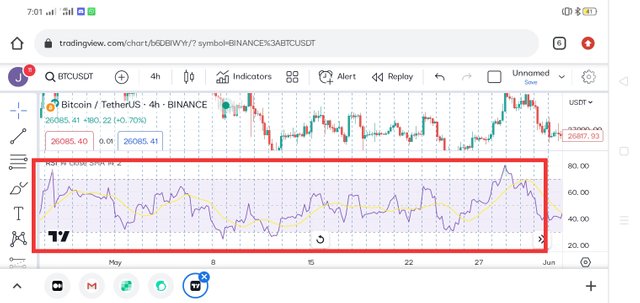
The relative strength index (RSI) is the type of indicator which you can use to determine market conditions and momentum, as well knowing when the market is going bad. The indicator is a value between the range of 0 and 100, where when the line is above 70%, it is considered an overbought level, whereas when it is below 30%, it is typically considered an oversold level.
A signal of an oversold condition on the RSI indicator may imply that short-term falls are coming to a close and the traded assets are positioned for a rebound, whereas an overbought condition is when short-term gains may be near a point of maturity stage where the asset may be paused for a market correction before any other move. For a better understanding of the RSI indicator, you can read my previous post.
2. The Moving Average (MA)
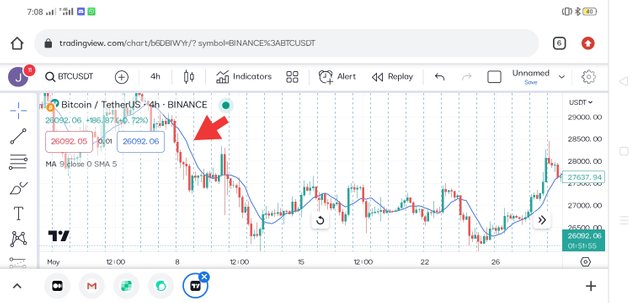
A moving average (MA), also known as a simple moving average (SMA), is a technical indicator that you can use to access the direction of a current price trend without being affected by the short-term price movement.
 Tradingview
On a chart, you will see that the moving average indicator helps you generate a trend line by summing the price point of a traded asset over a specified period of time and dividing by the number. It is an indicator that helps traders filter noise on a price chart, which you can take advantage of.
With this indicator, you may decide to study support levels, resistance levels, and the historical price movement of an asset. As an experienced trader, you can use the moving average crossover as a sell or buy signal. For instance, in a case where the 100-day simple moving average (SMA) line crosses below that of the 200-day SMA line, you can consider it a sell signal.
3. Moving Average Convergence Divergence (MACD)
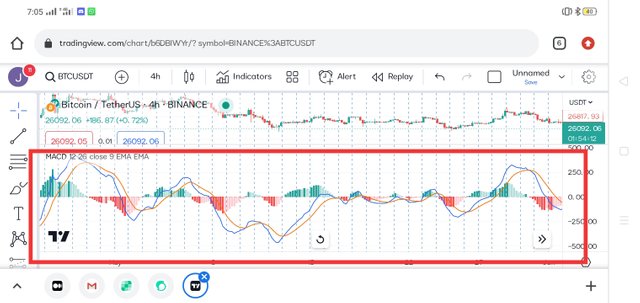
Moving Average Convergence Divergence is known as a momentum indicator that helps traders identify momentum changes. With this type of indicator, you would be able to identify both buying and selling opportunities at a support level and a resistance level.
 Tradingview
According to the MACD indicator, when two moving averages get closer to each other, they are considered convergent, and when they are divergent, they move in separate directions. To this end, the convergent moving averages suggest that momentum is falling, while the diverging moving averages suggest that momentum is rising.
When two moving averages come closer together, they are convergent; they are considered divergent when they move apart. The indicator consists of three different parameter lines, which are the signal line, the MACD line, and the MACD histogram.
4. Bollinger Bands (BB)
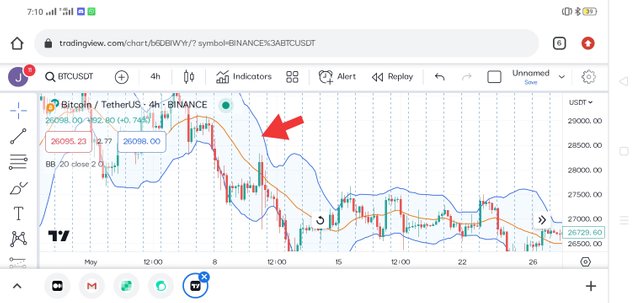 Tradingview
Bollinger Bands are a trading indicator created by John Bollinger to help traders determine the condition of overbought and oversold markets, as well as the volatility of market conditions. On this type of indicator, you will see an upper band, a lower band, and a middle band, which is the 20-period moving average.
5. Stochastic RSI (StochRSI)
The stochastic RSI is derived from the relative strength index (RSI). This means that stochastic RSI is used to compare the closing price of an asset by predicting the price change point. It also means the strength and weakness of an asset.
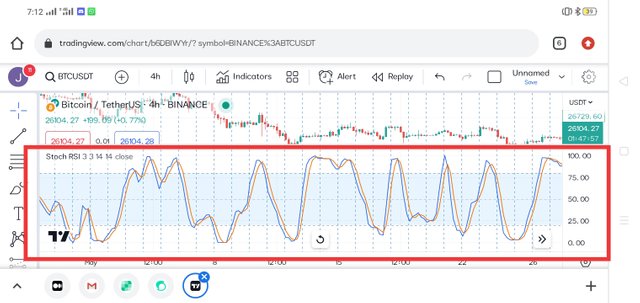 Tradingview
The indicator fluctuates between 0 and 100, or 0 and 1, of which a reading above 0.8 means overbought conditions while a reading below 0.2 means an oversold condition.
Conclusion
As a trader, it is good that you know most of these indicators, as they are the tools that can help you determine both the current and future conditions of the market, which is very important to every trader.
Reference Source, Reference, Reference and Reference
I also invite you to support the witnesses who focus on community development, they are @bangla.witness @visionaer3003, Please review and vote for them as witness !
Via steemit wallet https://steemitwallet.com/~witnesses
Via steemworld https://steemworld.org/witnesses?login

Vote for @bangla.witness via steem connect https://steemlogin.com/sign/account-witness-vote?witness=bangla.witness&approve=1

Best Regards
@josepha
Cc:
@stephenkendal
Thank you, friend!


I'm @steem.history, who is steem witness.
Thank you for witnessvoting for me.
please click it!
(Go to https://steemit.com/~witnesses and type fbslo at the bottom of the page)
The weight is reduced because of the lack of Voting Power. If you vote for me as a witness, you can get my little vote.
https://twitter.com/AkwajiAfen/status/1668507335168278532?s=20
Thank you for your contribution to the community. Keep on sharing quality original posts and please read our how-to posts which have been pinned in the community.
Nice review, we hope you can maintain a professional quality post if you want to share relevant topics in the Steem Alliance community.
Increase your Engagement in the community to exchange ideas and interact with teams from various communities.
Please always review the posts we have pinned on the community page. There are many guides that you should know, and they will be very useful.
Rating : 8/10
have a nice day!
Hi @josepha, your content is plagiarised. You can appeal here