Understanding Crypto Charting | Support and Resistance #02

Background Image Source
Greetings dear friends,
As promised, we will be starting our journey in understanding crypto charting today using the first topic I have stated in the list i.e. Support and Resistance.
In the previous class, I taught us how to add a chart to our technical analysis using the trading view website. If you missed out on that, please visit my previous blogs in this community to get yourself updated or drop a comment in the comment section of this post and I will attend to it asap.
When we talk about support and resistance level in the crypto technical analysis or chart, we are referring to areas in the price chart where the price of an asset hits and then reverses in the opposite direction. It happens because, at this point, the level of demand and supply for assets is very high.
Support level for more clarification is always seen at the floor of the price during a downtrend movement of the asset. The point where the price hits and reverse during a downtrend or downward movement is called a support level. The reversal here is due to the buying pressure in the market at that point.
Resistance level for more clarification is always seen at the ceiling of the price during an uptrend movement of the asset. The point where the price hits and reverse during an uptrend or upward movement is called a resistance level. The reversal here is due to the selling pressure in the market at that point.
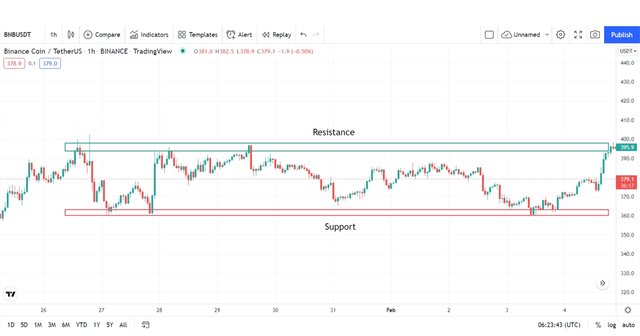
For more clarity, let's consider the screenshot above taken from the trading view website. I have been able to make the different regions of support and resistance for your information and understanding.
As explained above, the chart has shown the level we call the support and the resistance level. This is the same for all crypto charts so you can as well mark your regions of support and resistance.
The importance of locating the points of support and resistance on a chart can never be overemphasised and that is the reason I have decided to start this class with this very important sub-topic.
- To identify Price reversals and breakouts: One of the major reasons why we need to identify the points of support and resistance is to be able to know if the price will reverse or breakout. Price reversal occurs when the price hit the level of support or resistance and then changes direction. Alternatively, the price may get to these levels and then break the level and continue in the same direction. This act is what we call a breakout. With these, we will know the entry to make I.e either buy or sell.
- To identify the best entry and exit points: The points of support and resistance are points where we can easily predict price movement hence these points tell us when to buy or sell our asset to make good profits from the market. It helps you to avoid counter traders i.e. trading against the trend.
- To identify the trend of the market: With support and resistance levels on a chart, we can easily identify the trend of the market. We have two types of trend i.e. the horizontal trend and the dynamic trend. For a horizontal trend, the market shows that everything is in range whereas the dynamic trend shows if the asset is in its uptrend or downtrend.
From the explanation above, I will be sharing the charts of both horizontal and dynamic trends for all to have a clear picture of it below. Let's get started.
Horizontal Trend
From the above image, you can see that the price of the asset is in range. This means that both the buying and the selling pressure at the moment is almost the same and that is why you don't see much notable movement either up or down. This type of movement is called a horizontal trend.
Dynamic Trend
There are 2 types of dynamic trends i.e. uptrend and downtrend.
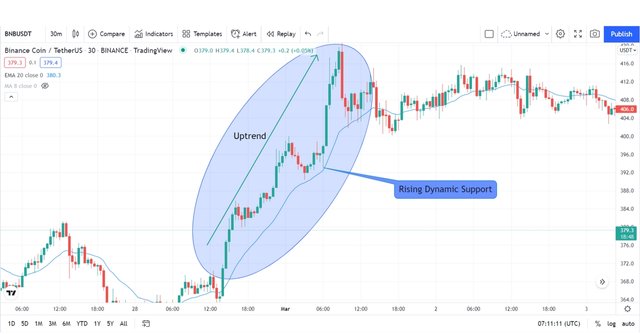
Uptrend, as seen from the above screenshot is a type of trend that is caused by the buying pressure in the market at that period. Here the trend is seen moving in an upward direction with a default colour of green for the candle sticks used in the chart.
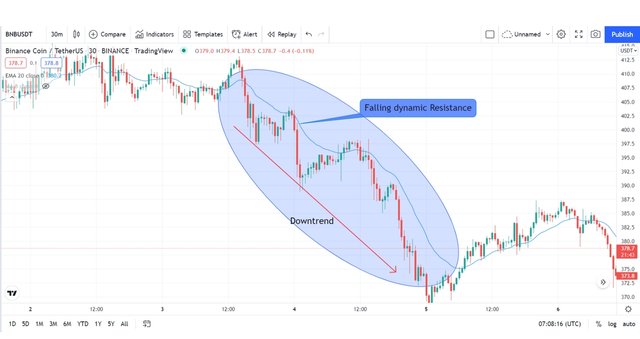
Similarly, a downtrend, as seen from the above screenshot is a type of trend that is caused by the selling pressure in the market at that period. Here the trend is seen moving in a downward direction with a default colour of red for the candle sticks used in the chart.
I want to believe that this article will go a long way in reminding us of some of the basic things we need to know about crypto trading. Since the crypto academy is not running like before, it is important to educate people about this especially admins and moderators since we are all mentors to the newbies. This will go a long way in helping us too in our trading analysis.
Note Board: All images except otherwise stated are screenshot taken by me from tradingview.com website.
Thank you, friend!


I'm @steem.history, who is steem witness.
Thank you for witnessvoting for me.
please click it!
(Go to https://steemit.com/~witnesses and type fbslo at the bottom of the page)
The weight is reduced because of the lack of Voting Power. If you vote for me as a witness, you can get my little vote.
https://twitter.com/xavierf14044615/status/1656146282661003266?s=20
With great emotion we notify you that this article has been curated by @josepha, member of team #2 at 50%. Your content is amazing, keep working hard to opt for the weekly top.