Multi-timeframe ANALYSIS Of BNBUSDT USING SMART MONEY CONCEPT

Hello crypto family,
It is a thing of excitement to be in this growing community today to share my technical analysis on the pair bnbusdt.
Today, I will be making use of smart money concept to share my analysis of the cryptomarket, but this strategy is known
to be an advanced support and resistance strategy.
We can learn a lot from this strategy, and before I continue, I also want to use this opportunity to extend my hands of greetings to the moderators of this great community, and also other members of this community for their tireless effort in making steemit great again.
My analysis is also a topdown analysis, that is, I begin from the monthly timeframe and take my entry on the 15min timeframe.
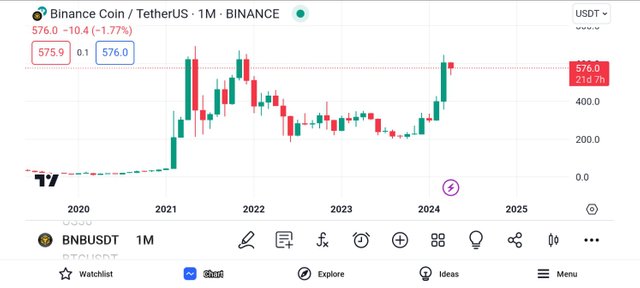
Begining with the monthly timeframe of the pair BNBUSDT so we can all have a view of how the price chart looks like.
From the above screenshot, we can see bullish and bearish candles in the colour green and red respectively.
And also, we can easily identify the overall trend of the market, as from the above screenshot, we can say that the market most recent structure is bullish.
It is also advisable to begin analysis from this level because, there are no or lesser noise on the monthly timeframe, and this can be very well confirmed from the above screenshot.
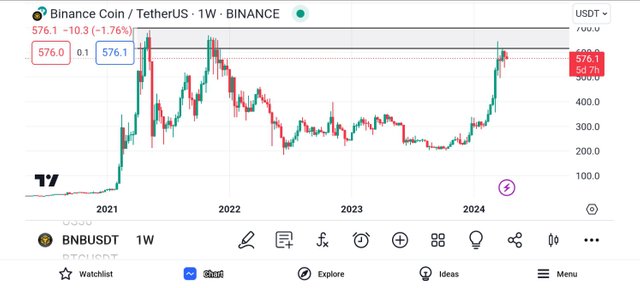
Going lower to the weekly timeframe, I can see that there are more market activities, there are series of demands and supplies in the market.
I was able to detect key highs in the market which is likely to function as liquidity in the long run.
And I watched and noticed that the market has failed to mitigate some levels, which will make it difficult for it to continue on a bullish move.
Then I also saw bullish rejection candles from this level, which Implies that the market is ready to go and mitigate some of the unmitigated levels, so it can confidently continue on its bullish move.
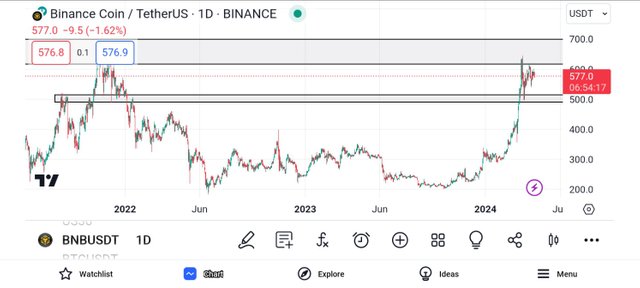
Moving to the daily timeframe, there are more market noise than the other higher timeframes.
On this timeframe, I was able to spot a key level which has been broken to signify a break of market structure to the bullish side.
And the market has failed to mitigate the order block on this level, as it is expected for this orderblock to be mitigated.
So I went ahead to mark this level using the rectangle tool, and when I enter a sell trade, I will be looking to use this level as my take profit zone.
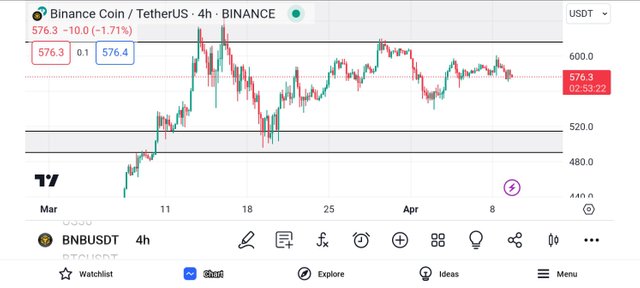
I then continued on the 4hr timeframe, which is lower than the daily timeframe.
On this timeframe, the market movement is seen very clearly, I can see how far the market has moved from the monthly high I marked.
Seeing the structure of the market, I have my bearish bias established, and as such, I am in search of bearish entries into the market..
And to discover profitable entries, I proceeded to the lower timeframe, just as seen below.
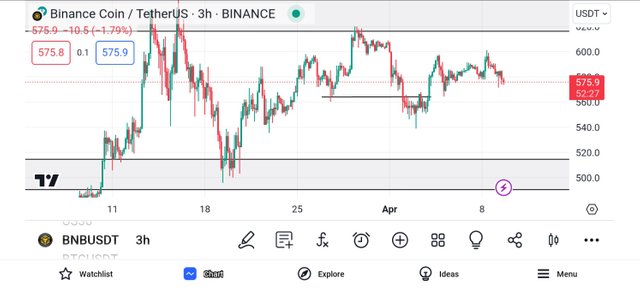
Moving to the 3hr timeframe in search of bearish entry into the market, I noticed there are so much noise In the market.
I can feel the presence of buyers and sellers in the market as they push price to their preferred direction.
As I looked carefully, I noticed a bearish break of structure, which can be signified to be a change of market character.
I then decided to watch and make use of the orderblock behind this choch as an entry into my trade.
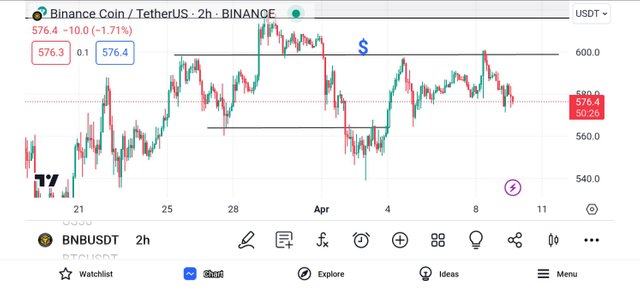
In my search for a suitable entry, I moved to the lower timeframe.
And on this timeframe, I was able to detect what is known as equal highs in the market.
These equal highs serves as liquidity in the market which is one reason it has a dollar sign on top of it.
It is expected that the market will clear out this liquidity before it continues on its bearish retracements.
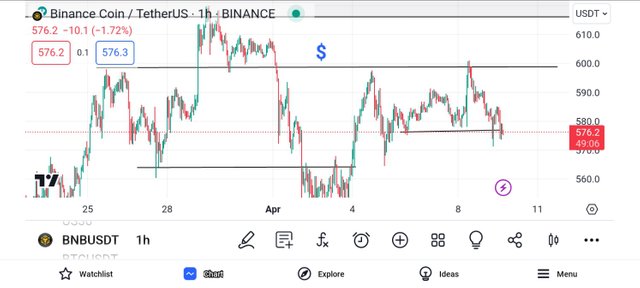
Also on this timeframe, I noticed a liquidity spot which the market came down to sweep.
And this can also be seen as a break of structure, that is a change of character, which is intended to be seen before the market continues it's movement.
I then moved to the lower timeframe in search of bearish entries into the market.
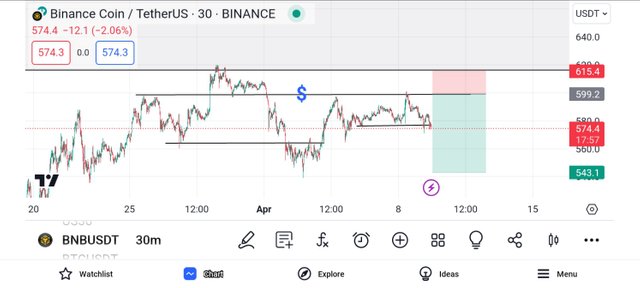
Looking at the market very carefully, I decided to place my entry on the liquidity level shown above.
This is so I can get kicked in into the market when the market comes to clear out liquidity.
And I placed my stop loss a little bit above the liquidity level, so this will give me some space Incase there would be some market manipulations.
Explain above is my analysis of BNBUSDT using smart money concept.
I want you all to remember that starrchris cares ❤️
https://twitter.com/starrchriz/status/1777788027995087023?t=0YpM_7jNWz3RXlOXzb2nvg&s=19
Note:- ✅
Regards,
@jueco