Multi-timeframe ANALYSIS Of BTCUSDT USING SMART MONEY CONCEPT
.jpg)
Hello crypto family,
It is a thing of joy to be in this great community today to share my technical analysis on the pair btcusdt.
Today, I will be making use of smart money concept to share my analysis of the cryptomarket, but this strategy is more advanced than a normal support and resistance strategy.
We can learn a lot from this strategy, and before I continue, I also want to use this opportunity to extend my warm greetings to the moderators of this great community, and also other members of this community for their tireless effort in making steemit great again.
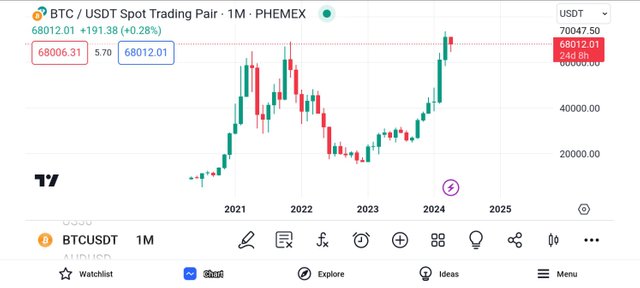
Begining my Analysis from the monthly timeframe, I aim to get an overview of the market trend.
I aim to check what direction the market is heading towards so I can channel my entry toward that direction too.
On the monthly timeframe, as seen above, it is easier for the overall market trend to be identified, and we won't be mistaking if we say that the overall market trend is being bullish.
And also we will notice that there are fewer candles on this timeframe, which makes analysis in this timeframe easy to carryout.
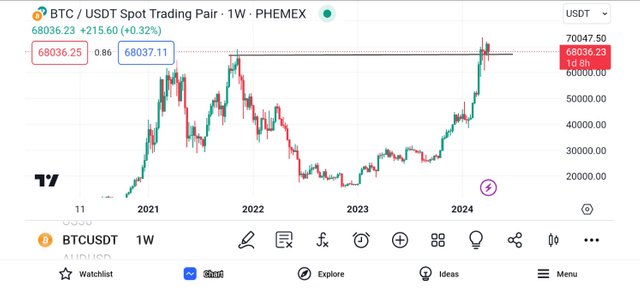
To make progress with my analysis, I decided to switch to the weekly timeframe.
And this timeframe is a weekly timeframe because every candle in it is formed within the space of 1week.
Looking at the structure of the market, I can see the formation of higher highs and higher lows and I also noticed that the market latest level has been broken.
This broken level can be referred to as break of structure.
A break of structure of the market is often a sign of the change of structure or trend of the market.
And the break of structure from the weekly timeframe signifies that the market is in an uptrend.
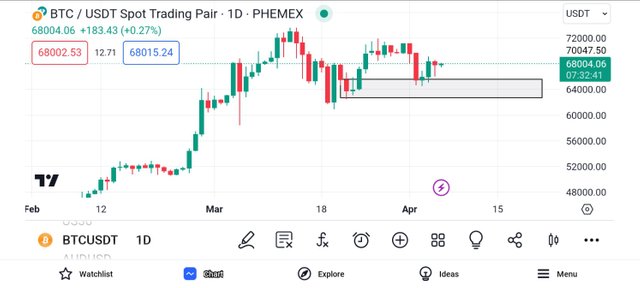
On the daily timeframe also, I was able to identify a bullish order block, and this order block is one that is meant to push the market price upward.
And as shown above, the market has reacted off this order block and has began it's movement to the upside.
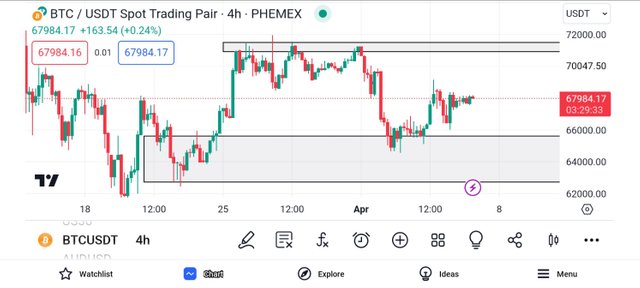
On the 4hr timeframe, the numerous candlestick can be vividly seen, and also, we can see the market reacting to the bullish order block.
There are also lots of noise on this timeframe, as we can see the market forming several bullish and bearish candles.
As I looked carefully, I detected a liquidity above in the form of equal highs, in support and resistance strategy, it is known as resistance level.
But then I decided to continue my analysis on the lower timeframe inorder to make a more informed trading decision.
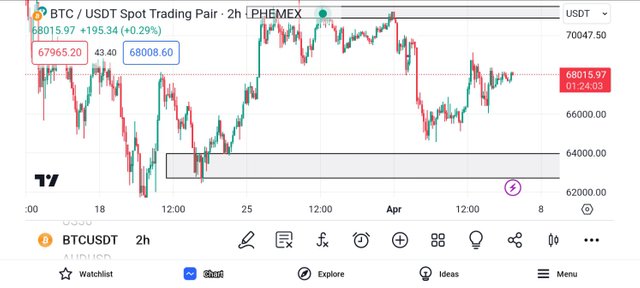
Moving to the 2hr timeframe, I focused my gaze on what I came for, as I noticed there are several noise in the market.
On this timeframe, I noticed that the market has failed to properly mitigate a particular order block before begining it's bullish move
And I still expect the market retrace to this level, so it can properly mitigate this order block before it moves in its upward direction.
This order block has been marked out for you all to see, it was marked using a rectangle, and whenever the market gets to this level, I expect to join the market on a bullish move.
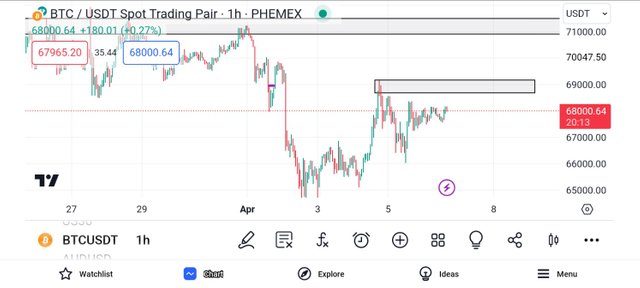
I moved to the 1hr timeframe, and I was able to spot another order block just as shown above.
The market is about to mitigate this order block and when it does, we either expect to see a bearish turn out of the market or a bullish break of structure.
When we see a bullish break of structure, then we can search for bullish entry into the market and when we see a rejection, we can search for bearish entry into the market.
And as for me, I expect the market to be rejected so it can properly mitigate the order block it failed to initially mitigate.
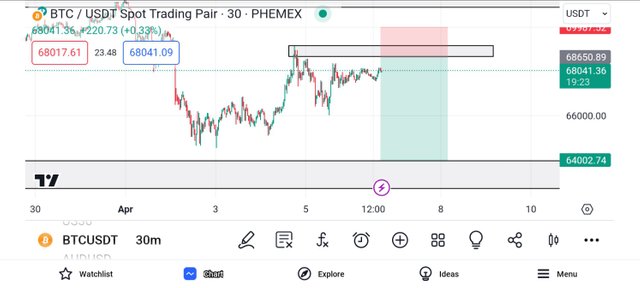
I then placed my first entry in the bearish resistance, and I sold the market up to the point where it properly mitigates the bullish order block.
And as seen above, my stop loss was placed above the order block so as not to get easily stopped out by the market.
And then I moved to the lower timeframe to place one more trade
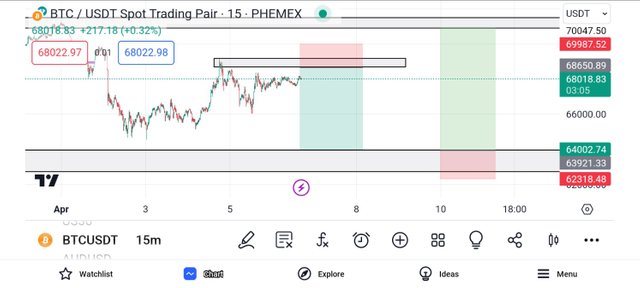
As shown above, I also bought the market immediately because I expect it to move forward immediately after mitigating the order block.
I also made sure to place my stop loss below the order block because there can be some liquidity sweep before the market continues upward.
Shared above is my analysis of btcusdt and I hope to see you all some other day.
Remember starrchris cares ❤️
Upvoted! Thank you for supporting witness @jswit.
https://twitter.com/starrchriz/status/1776740491377205564?t=J2_2QGZTcC4OLmjqfjddGQ&s=19
Moderation
Note:- ✅
Regards,
@theentertainer