STEEM Cryptocurrency Technical Outlook | club75 10% payout to Steemalive

Hello Steemians, I welcome you all to the weekly cryptocurrency outlook with an emphasis on STEEM/USD pair. Hopefully, I will be performing this analysis every week to give us insight into the market movement and also the reaction of price. This analysis will mainly focus on the technical aspect of the crypto market.
Firstly, let's look at the Total Cryptocurrency Market Cap.
Total Cryptocurrency Market Cap
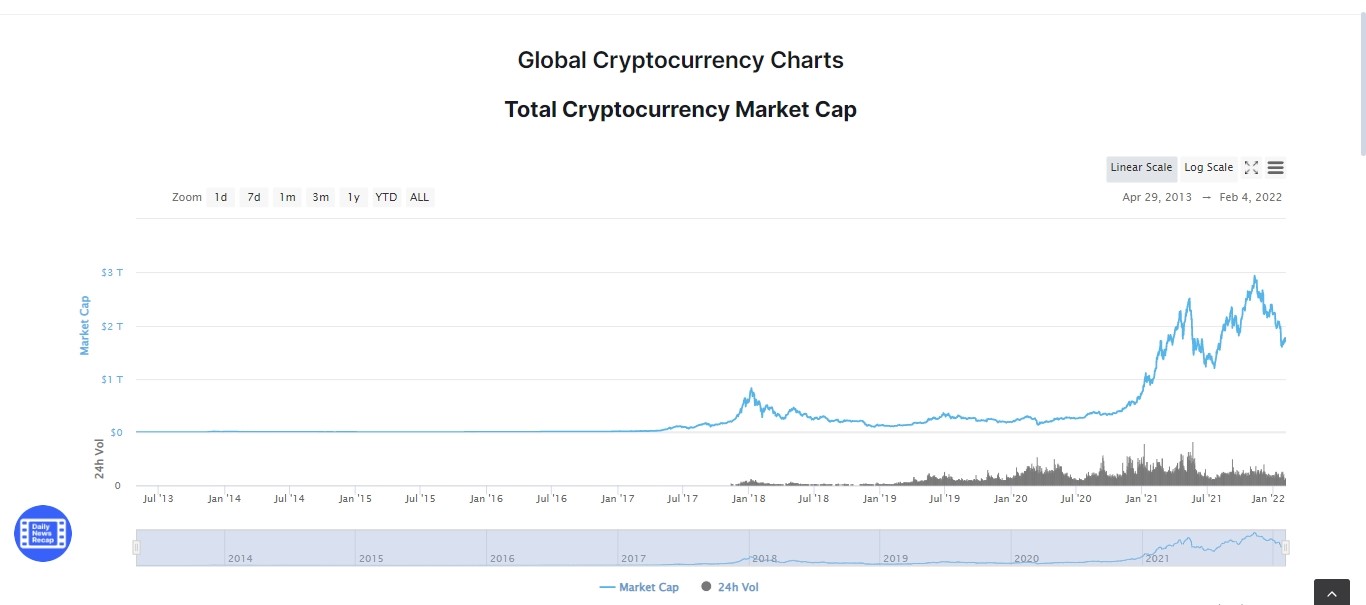
Looking at the chart above, we can see that the entire crypto market cap has experienced a decline after hitting an all-time high of $2.8 Trillion. Currently, at the time of making this analysis, the entire crypto market has a market cap of $1.7 Trillion with a 24h trading volume of $83 billion. There's a probability that the decline will continue to at least a cap of $1.2 Trillion which served as a reversal zone for the previous bull run.
Bitcoin Dominance Chart
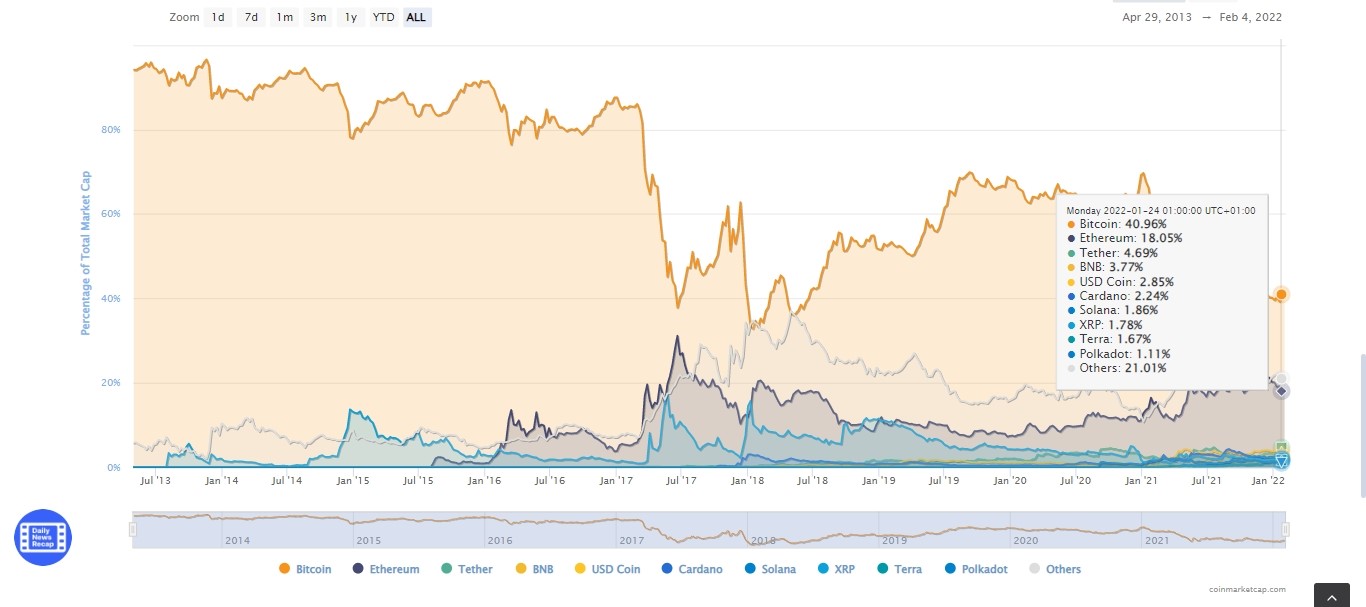
The chart above shows the percentage of the total market cap of major cryptocurrencies (Bitcoin Dominance). Bitcoin Dominance compares the ratio between Bitcoin market cap to the market cap of the rest of the entire cryptocurrencies. Currently, Bitcoin has a dominance of 40% in the crypto market cap of $719 billion. This shows that Bitcoin is losing its dominance in the crypto market and this can be tagged to the rise of DeFi projects, NFTs and Stablecoins. However, Bitcoin remains the prime mover of other cryptocurrencies.
STEEM Technical information
The information on the image below represents the technical information on STEEM at the time of making this post.
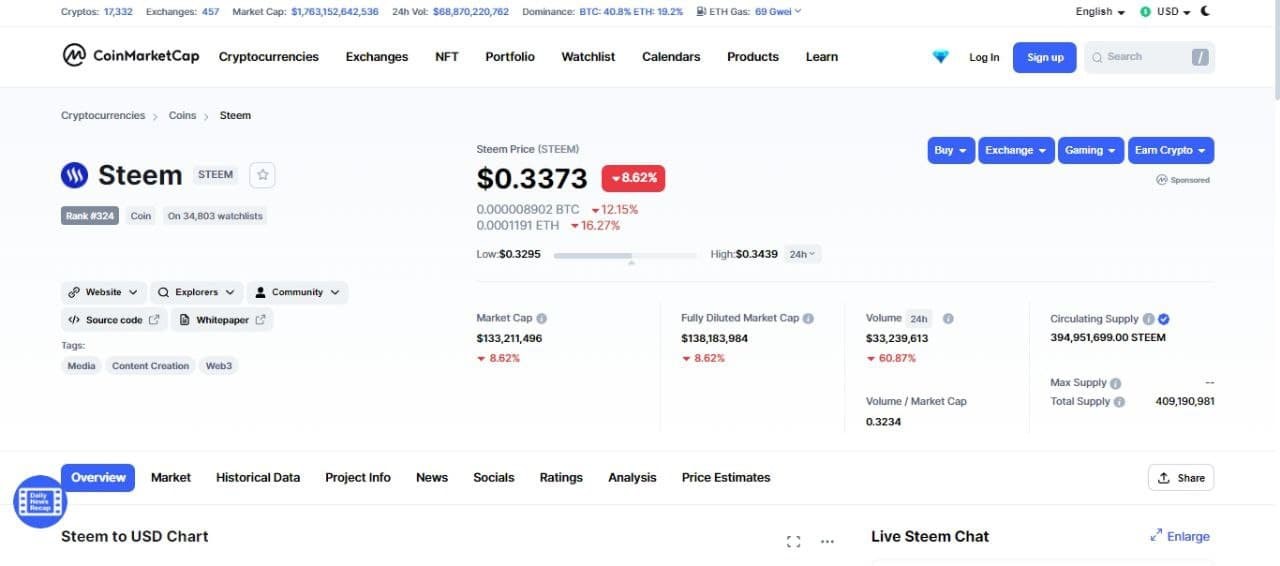
STEEM is currently ranked #324 with a market dominance of 0.01%. STEEM is currently trading at $0.337 with a marketcap of $134 million. The total circulating supply of STEEM is 394.9 million and also a 24hr trading volume of $28.15 million.
STEEM/USD Analysis
For this purpose, the analysis will be carried out on Tradingview.com platform. A multi-timeframe analysis will be performed on the Monthly, Weekly, and the Dialy Chart. From this analysis, we can be able to predict the future price of STEEM from a technical perspective.
Monthly Chart
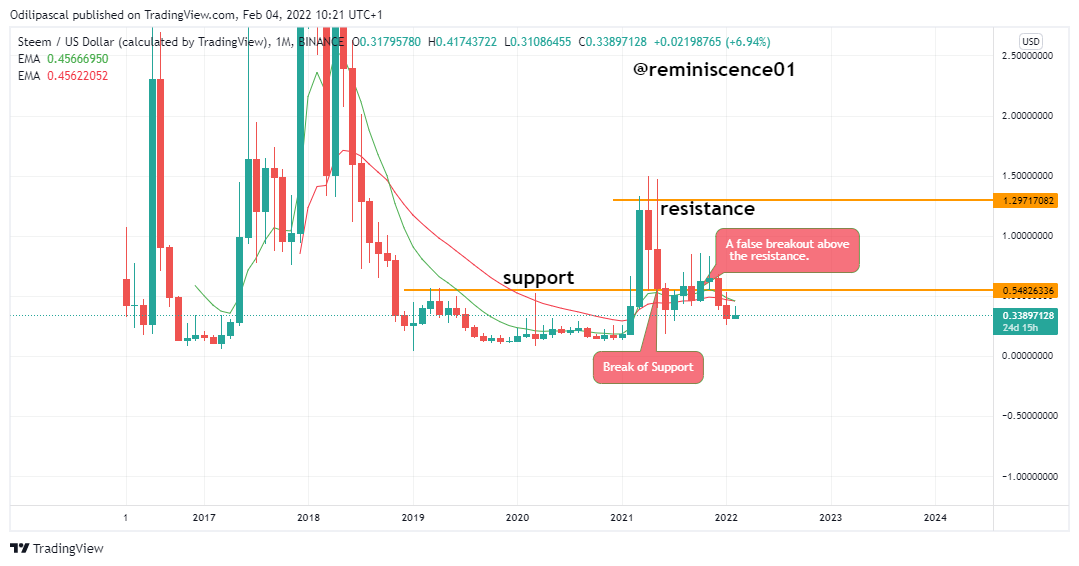
Looking at the monthly chart, after the bull run of STEEM up to $1.45, there was a reversal of price which led to the break of the previous resistance now turned support. After that, there was a fake breakout above the support which the formation of inverted hammers. Price came back down to break below the support level at $0.55. Also, we can see this downward movement is in confluence with the Exponential moving average as price breaks below the moving average line.
Weekly Chart
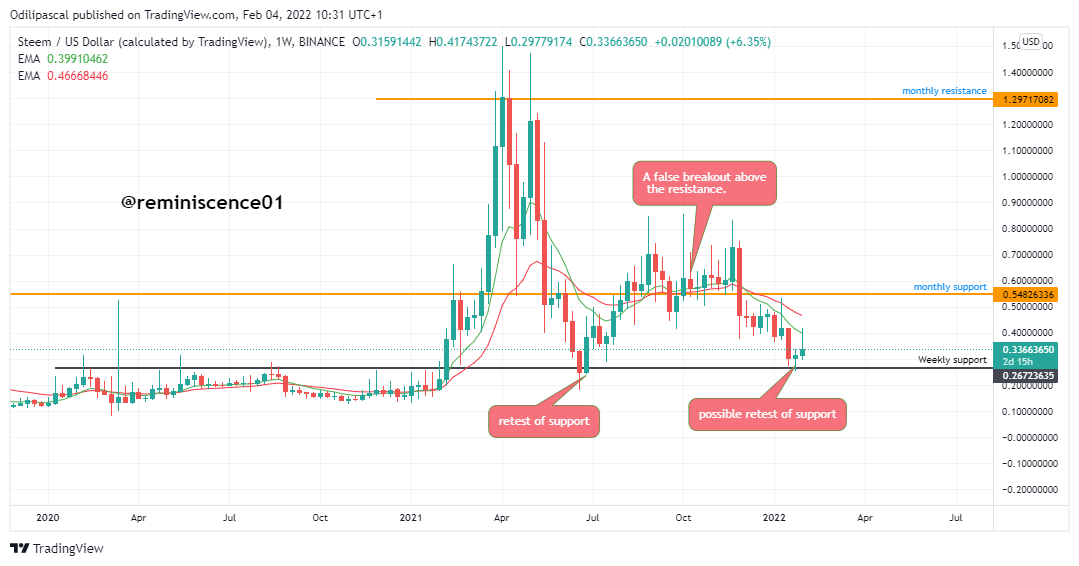
Looking at the situation on the Weekly Chart, we can see price broke the monthly support and surge down to retest the weekly support at 0.26. Price reversed upward to the monthly support. After, we can see a false breakout of the monthly support now turned resistance. Price ranged for a couple of weeks before surging down to weekly support again at $0.26.
We hope that this weekly support will serve as a reversal zone for a bull run on STEEM. Also, price can break this support to continue its downward movement. From the previous market structure, this weekly support is a very strong one and price is expected to reverse from here.
Daily Chart
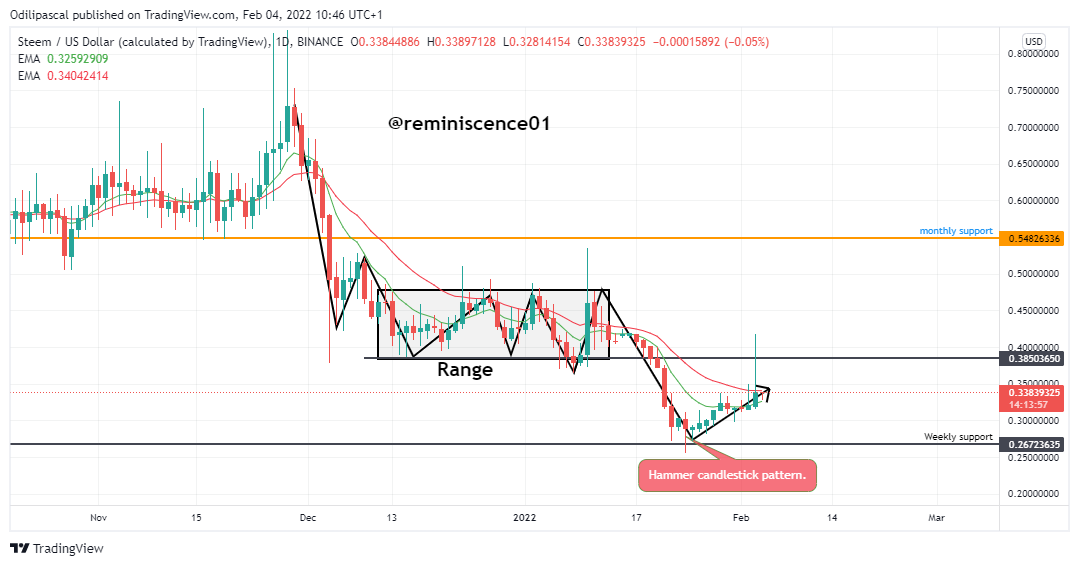
The daily chart is clearly showing the bearish trend in STEEM/USD with the formation of lower highs and lower lows. Price formed a range to gather momentum and then continue to surge down to the weekly support. From what we have currently, we can see a hammer pattern formed at the weekly support. This is a sign of reversal but there's no momentum to push price up.
Right now, price is still bearish until we see a break of market structure above the low of the range. This can also be confirmed with another technical analysis tool to confirm the trend reversal.
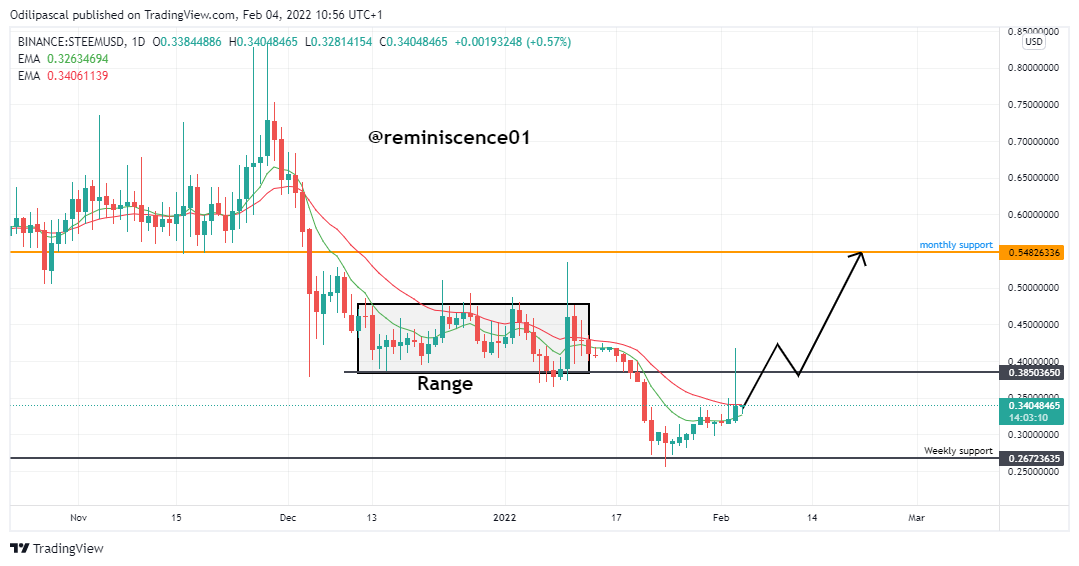
Future Price Prediction
From the multi-timeframe analysis made, we can see that the price of STEEM is still in a bearish trend. Though a reversal of expected at a major support level as seen on the weekly and daily chart. We have two possible scenarios from price. This includes:
Price can reverse upward and break the previous. When this happens, we can expect price movement up to the monthly support at $0.54. This can be seen on the chart below.
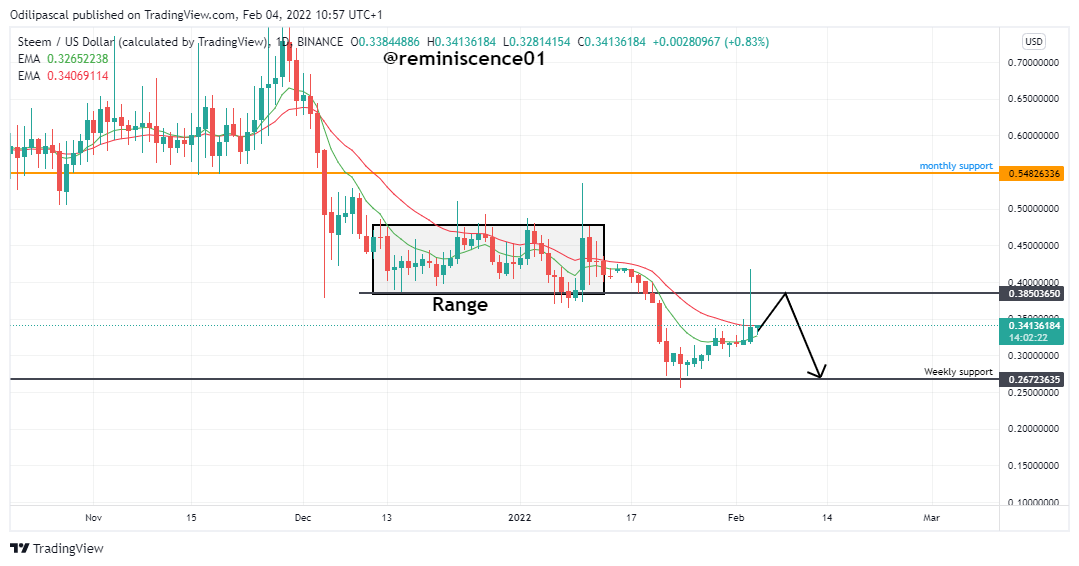
Another possible scenario is for price to get rejected from the previous low for a continuation of a downtrend. This can see price back to the weekly support at $0.26. This can be seen on the chart below.
In this post, we have analyzed the crypto market cap and also the Bitcoin Dominance on the rest of the cryptocurrencies. We have also carried out a multi-timeframe analysis on STEEM/USD using the higher timeframes. The future price of STEEM has been predicted and we will be back next week to see how the market has reacted.
Disclaimer: This analysis is not a piece of financial advice, rather it is made for just educational purposes to help you understand the price reactions to make your own analysis. Investing in cryptocurrency is very risky and it is advisable to consult a professional before making any investment decision. Also, ensure you implement proper risk management on any investment decisions you make in the market.
Best regards,
@reminiscence01
Lovely post, I read an article saying the price of crypto currency depends on demand and supply and if so, those this means we can boost it.
Thanks for this analysis I understood a lot from it
Thank you so much @reminiscence01, for the the detailed analysis of crypto price reactions.
Hi @reminiscence01,
Glad to read your crypto analysis for the past few days.It has served as an eye opener to let us know the direction that the price of Steem may swing.Thats the beauty of having good knowledge of technical analysis.
Thank you Brother. Hopefully, i will be performing this analysis on a weekly basis.
Good analysis, will appreciate if we can be having this every week
Hopefully, the analysis will be carried out every week. I guess with this information, we can know what to expect from the market in the coming week.
This is a great analysis, very educational and insightful into the crypto world. Thanks for sharing this
Thank you.
@reminiscence01 thank you so much for this indept analysis. I am looking forward to a favourable reversal of Steem.
Thank you. Market is sitting at a strong support level. A potential reversal is expected at this level.
You made a great analysis here @reminiscence01. With your careful technical analysis I can stand by your side that steem coin will reverse upward in the nearest future. Thanks for this educational post. We keep steeming.
Thank you Master Lee 😁.
But looking at the market general and all of the time frame analysed, it is obvious that the market is in a downtrend as the EMA is still above the candles..
Correct me if i am wrong. It just what i see.
And an advice to yall, this is the time to accumulate as much steem as you can.
Very informative analysis mate
Steem on.
The EMA is just acting as a confirmation tool. Also, when price is above the EMA, it signals a shift from bearish to bullish pressure.
Exactly, this is the best opportunity to invest in STEEM.
Wow thann you so much for these analysis..i will wait