Estimating fluctuations HBD/HIVE + cat tax
When the price goes up and down you can make profit. But by how much will it go up and by how much will it go down? If the fluctuations are not too big and if the average price remains relatively constant you can try to estimate these ups and downs using fundamental statistics.
Before the big jump up the average HBD/HIVE remained relatively constant:
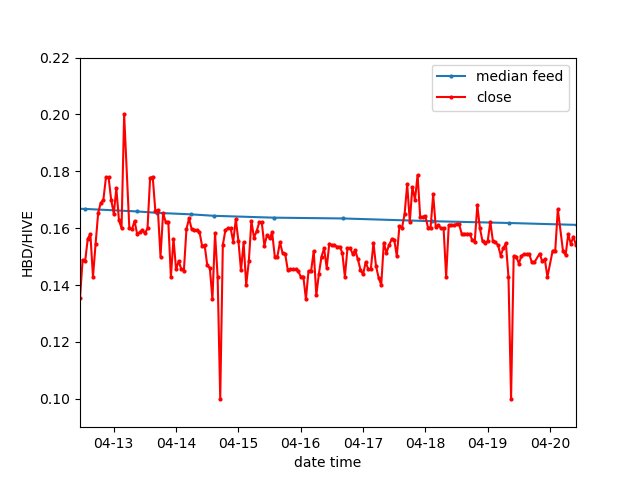
There are some irregularities but the average HBD/HIVE is cruising at about 0.15. Given the data with extreme values removed you might consider fitting a distribution to it. However, this might not give a full picture of the price dynamics since besides the price we are also concerned with volume. To include the volume you can weight the HBD/HIVE price by the volume. In doing so you reduce influence from low volume price changes. Fitting some nice distributions to it you get this lovely plot:
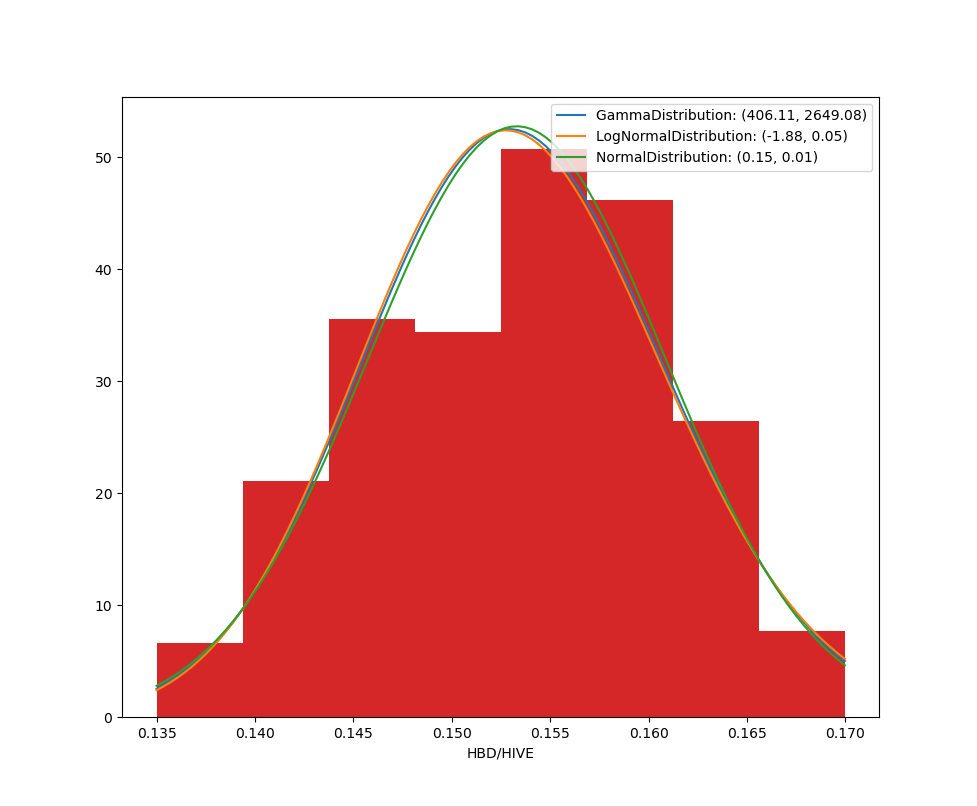
The fit is by no means perfect but there is a clear correlation. From a trading application you would want to sell at a value on the right tail of the distribution and buy for a value on the left tail of the distribution.
So how would this work if the average price does not remain constant? What you then can do is just compute a local weigthed average and compute the fluctuations w.r.t. to that average. For the last few days you would get this
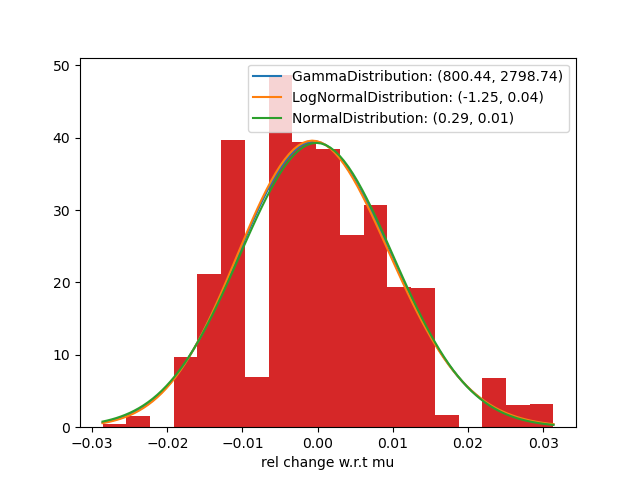
It is definitely not as a good fit as before. Probably because price surges lead to unpredictable behaviour. Anyway, this is a nice method to add to your trading tool-box.
All of the data brought to you by the wonderful beem package
That's enough complicated words for now. Here is some cat tax:

Posted Using LeoFinance
#hive #coding #neoxian #palnet #steemstem #stem #mathematics #statistics #hivecats #cat #dpets #leofinance