US Dollar Index (DXY) Technical Analysis | Important Support & Resistance Zones
Hello Steemit Community 👋
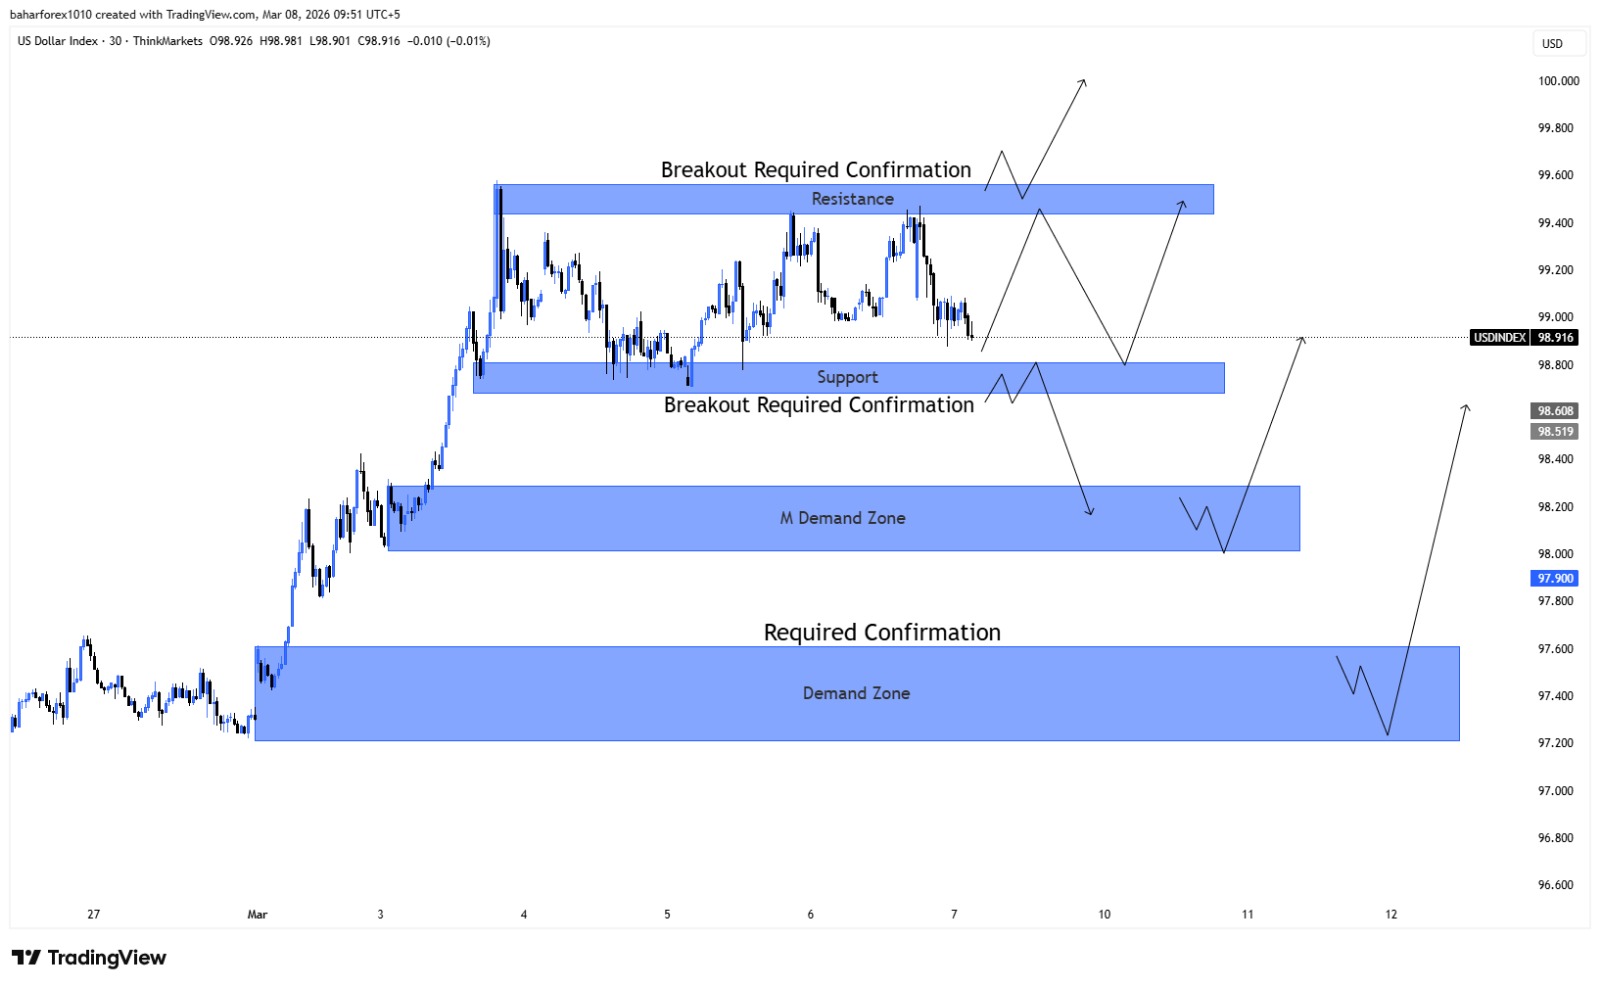
Today I am sharing a technical analysis of the US Dollar Index (DXY) based on support, resistance, and demand zones.
From the chart we can clearly see that the market is currently moving between an important support and resistance range.
🔹 Resistance Zone:
The upper blue zone is acting as a strong resistance level. If the price breaks this zone with confirmation, the market may move upward with strong bullish momentum.
🔹 Support Zone:
The middle zone is working as support. If the price breaks below this level, we could see a downward move toward the M Demand Zone.
🔹 Demand Zones:
The lower demand areas are strong zones where buyers may enter the market again and push the price upward.
📊 Possible Market Scenarios
• Break above resistance → Strong bullish move
• Break below support → Price may fall to demand zone
• Reaction from demand zone → Possible bullish reversal
⚠️ Always wait for proper confirmation and risk management before entering a trade.
Thank you for reading my analysis.
السلام علیکم دوستو 👋
آج میں
US Dollar Index (DXY)
کی ایک سادہ ٹیکنیکل اینالیسس شیئر کر رہا ہوں جس میں سپورٹ، ریزسٹنس اور ڈیمانڈ زونز کو دیکھا گیا ہے۔
چارٹ کے مطابق مارکیٹ اس وقت ایک اہم سپورٹ اور ریزسٹنس رینج کے اندر حرکت کر رہی ہے۔
🔹 ریزسٹنس زون:
اوپر والا نیلا زون ایک مضبوط ریزسٹنس ہے۔ اگر قیمت اس زون کو بریک کرتی ہے تو مارکیٹ میں تیزی آ سکتی ہے۔
🔹 سپورٹ زون:
درمیانی زون سپورٹ کے طور پر کام کر رہا ہے۔ اگر یہ سپورٹ بریک ہو جائے تو قیمت نیچے M Demand Zone تک جا سکتی ہے۔
🔹 ڈیمانڈ زون:
نیچے والے زون مضبوط ڈیمانڈ ایریاز ہیں جہاں سے قیمت دوبارہ اوپر جا سکتی ہے۔
📈 ممکنہ صورتحال
• ریزسٹنس بریک ہو جائے → مارکیٹ اوپر جا سکتی ہے
• سپورٹ بریک ہو جائے → قیمت نیچے جا سکتی ہے
• ڈیمانڈ زون سے ری ایکشن → مارکیٹ ریورس ہو سکتی ہے
ٹریڈنگ میں ہمیشہ رسک مینجمنٹ اور کنفرمیشن کا خیال رکھنا ضروری ہے۔