Trading 101: Learning about Trend lines, Support and Resistance
Every financial market is determined by demand and supply and every market just like it needs investors, needs traders to keep the market going.
Disclaimer: This post should not be taken as financial advice, but should be read for educational or recreational purposes, be sure that trading is risky and your money can be lost in the process.
One thing I want to let you know is that the market is emotional and the market deals with certain rules such as for every bull, there will be a bear. Except for cases of bankruptcy, every low will see a rebound and so on. Due to this rule, the market now follows a repeat procedure making the market identical.
How to Identify the trend of a market by reading the chart.
Charts are a combination of candlesticks in form of buys and sell. The buys are in green and the sells are in reds (you can set your colors but this is the default for most exchanges and markets). Trends are the direction in which the market is moving and these trends can be up or down.
Trends are connections between 2 or more lines making an upward or downwards slope towards support and resistance. Graphs can be very complicated if not understood and mastered, do not forget that it takes time and continuous practice to master the art of trading.
Charts are a combination of two lines, The support and the Resistance The Supports are always at the down and the resistance is always at the top. In other to create a line, either support or resistance, you need to join two or more candles together.
Support Line
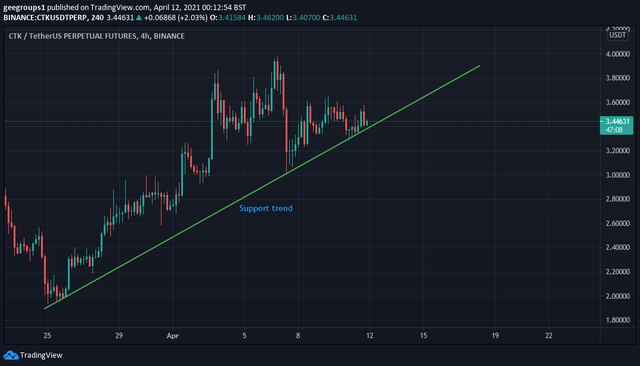
https://www.tradingview.com/x/xU0cfM4z/
Resistance Line
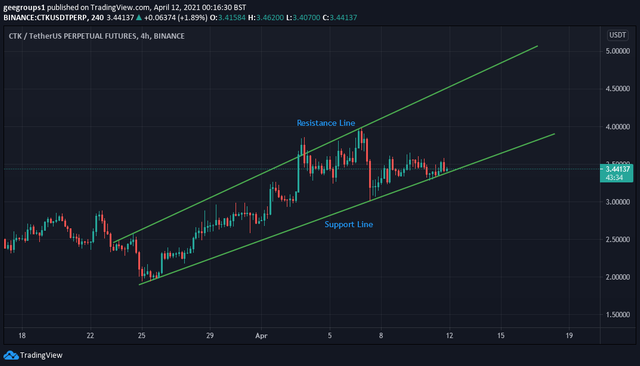
https://www.tradingview.com/x/rUT38DZq/
The trend line keeps the chart between a particular trend until there is a breakout or break down from the trend. There might be fake-out or fake down but this doesn't mean the chart isn't correct. When there is a breakout, then the candlestick that breaks out shows a buy signal. There might be false breaks such as drops but do not be scared, once a candlestick breaks out of the trendline, the breakout candlestick becomes support also, when there is a break-through to the down, the previous support becomes resistant.
Conclusion.
Trading is a combination of technical analysis and strategy. I hope you enjoyed this post. See you in the next post.
For a tradjg to produce effective profit, proper technical analysis and strategy needs to be applied